Feature image for SF: November 2025 Market Stats

November 10, 2025

SF: November 2025 Market Stats

By Compass

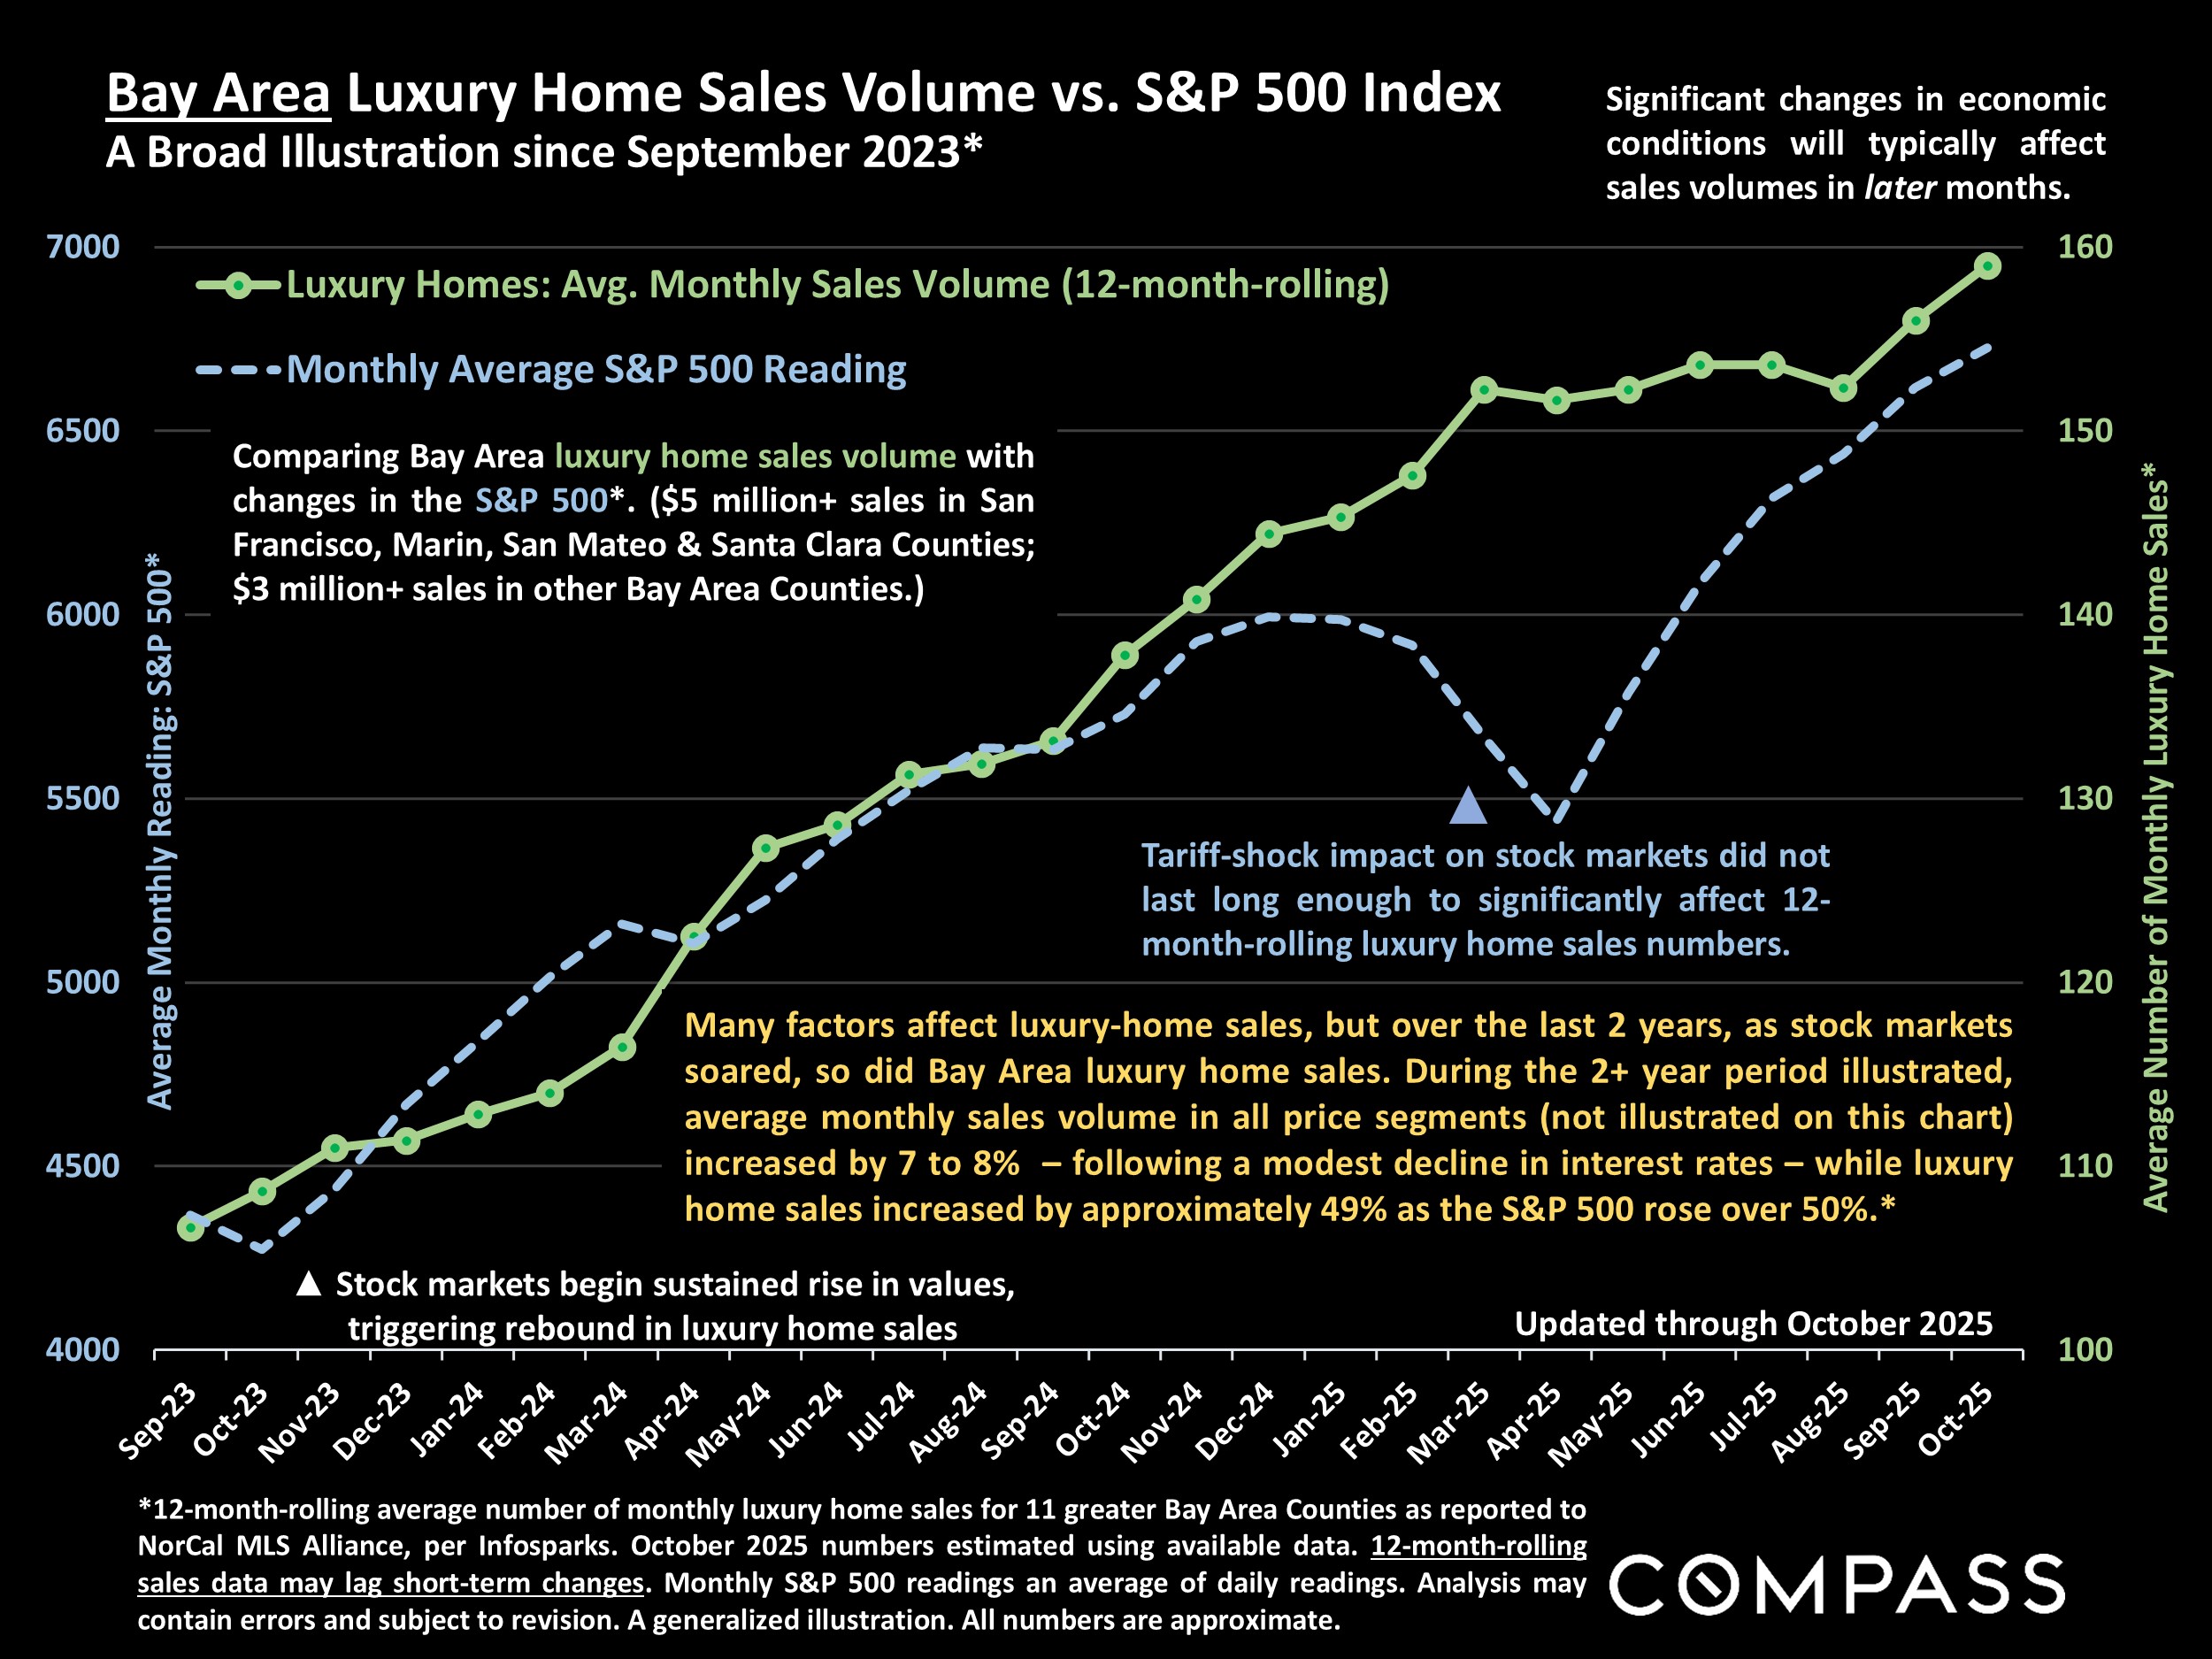
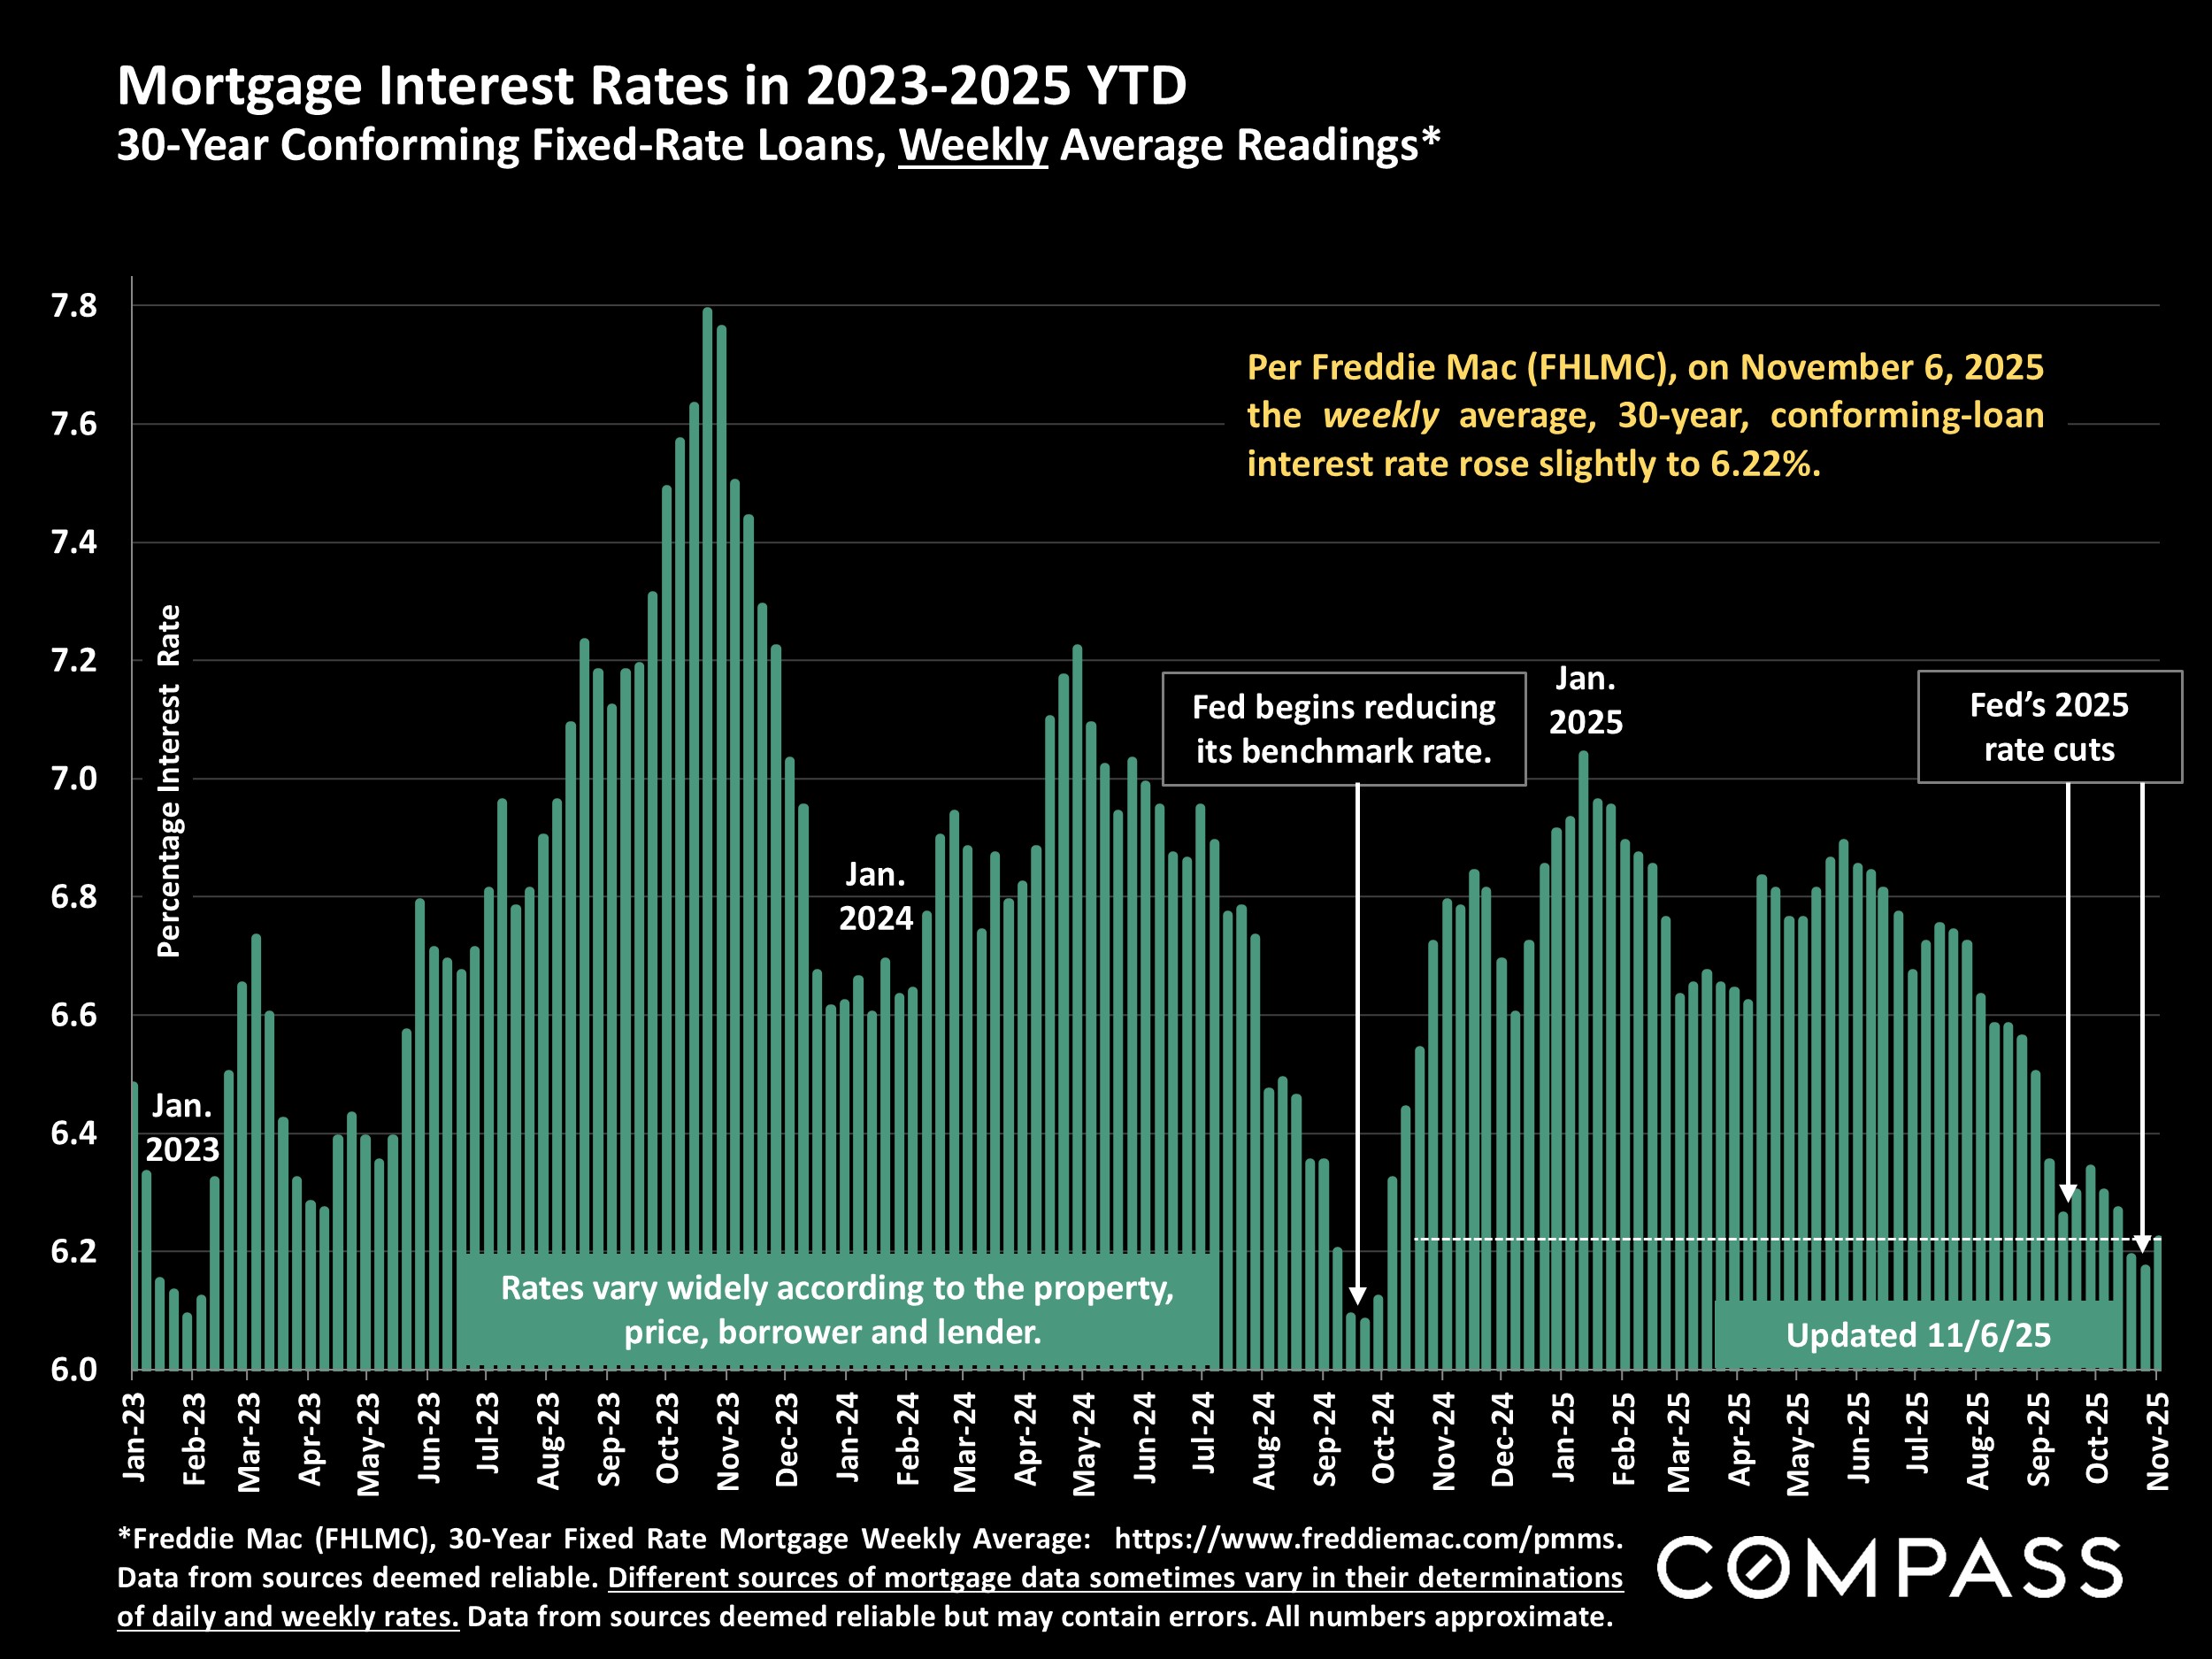
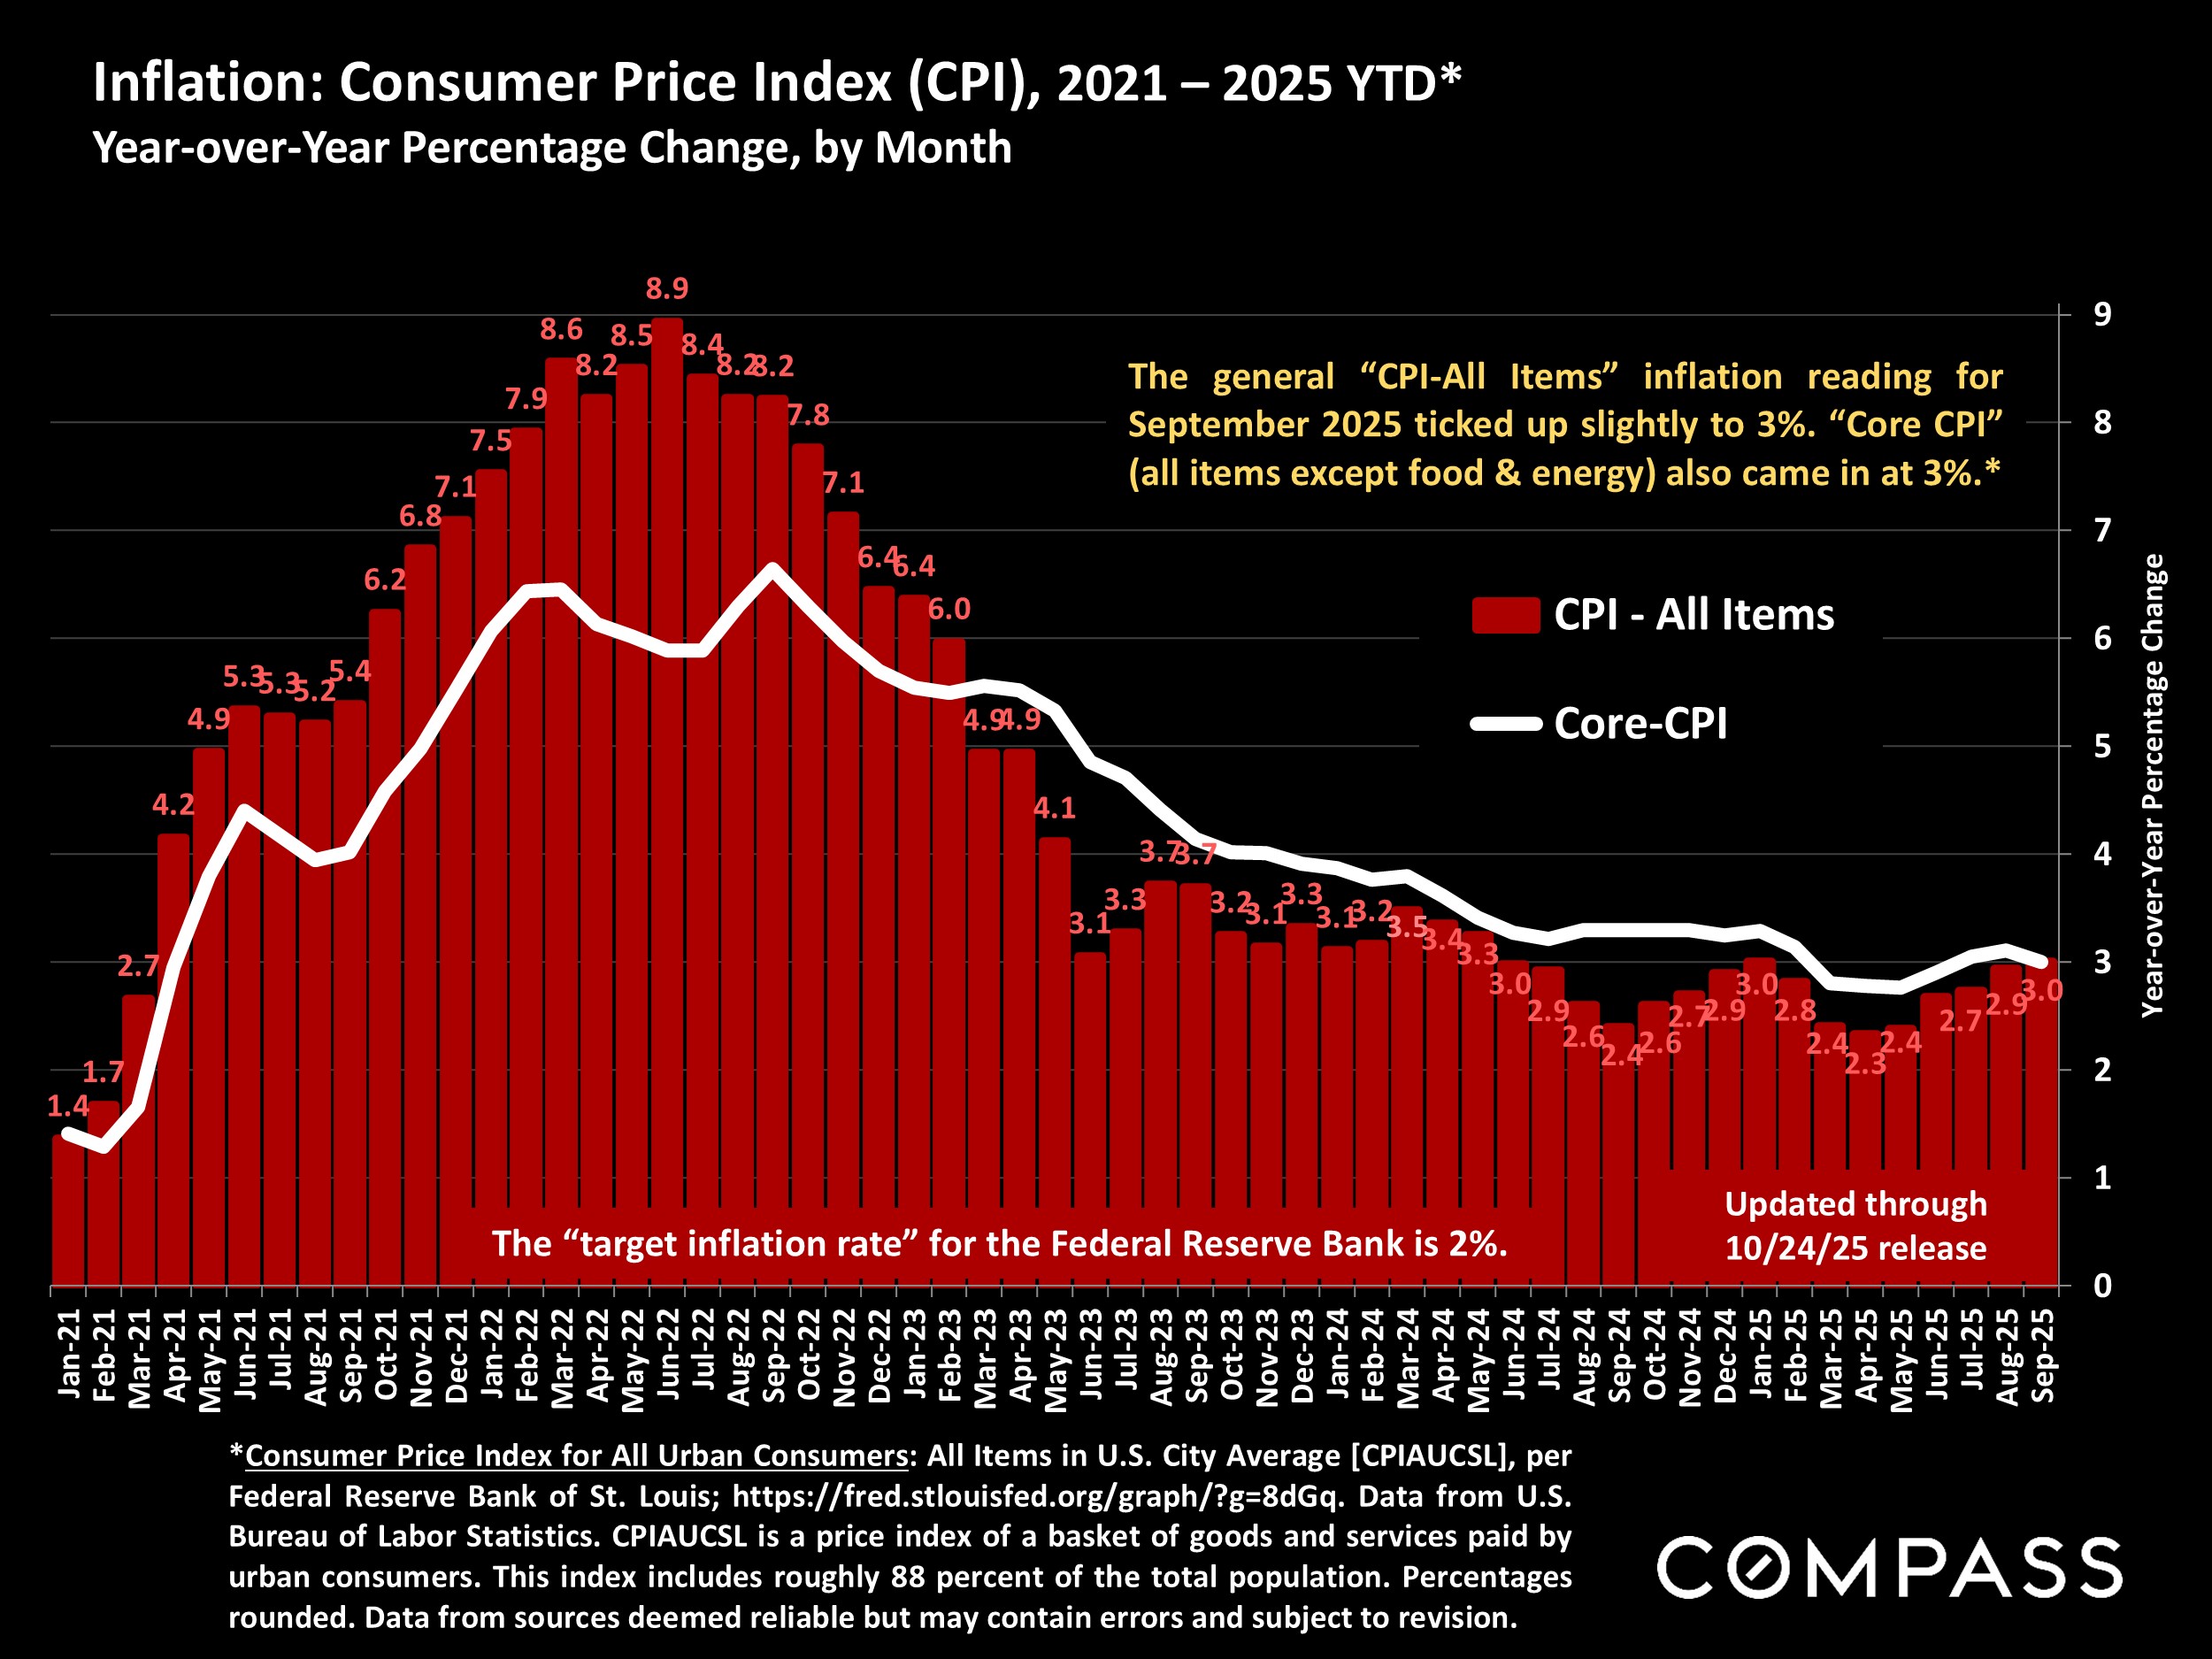
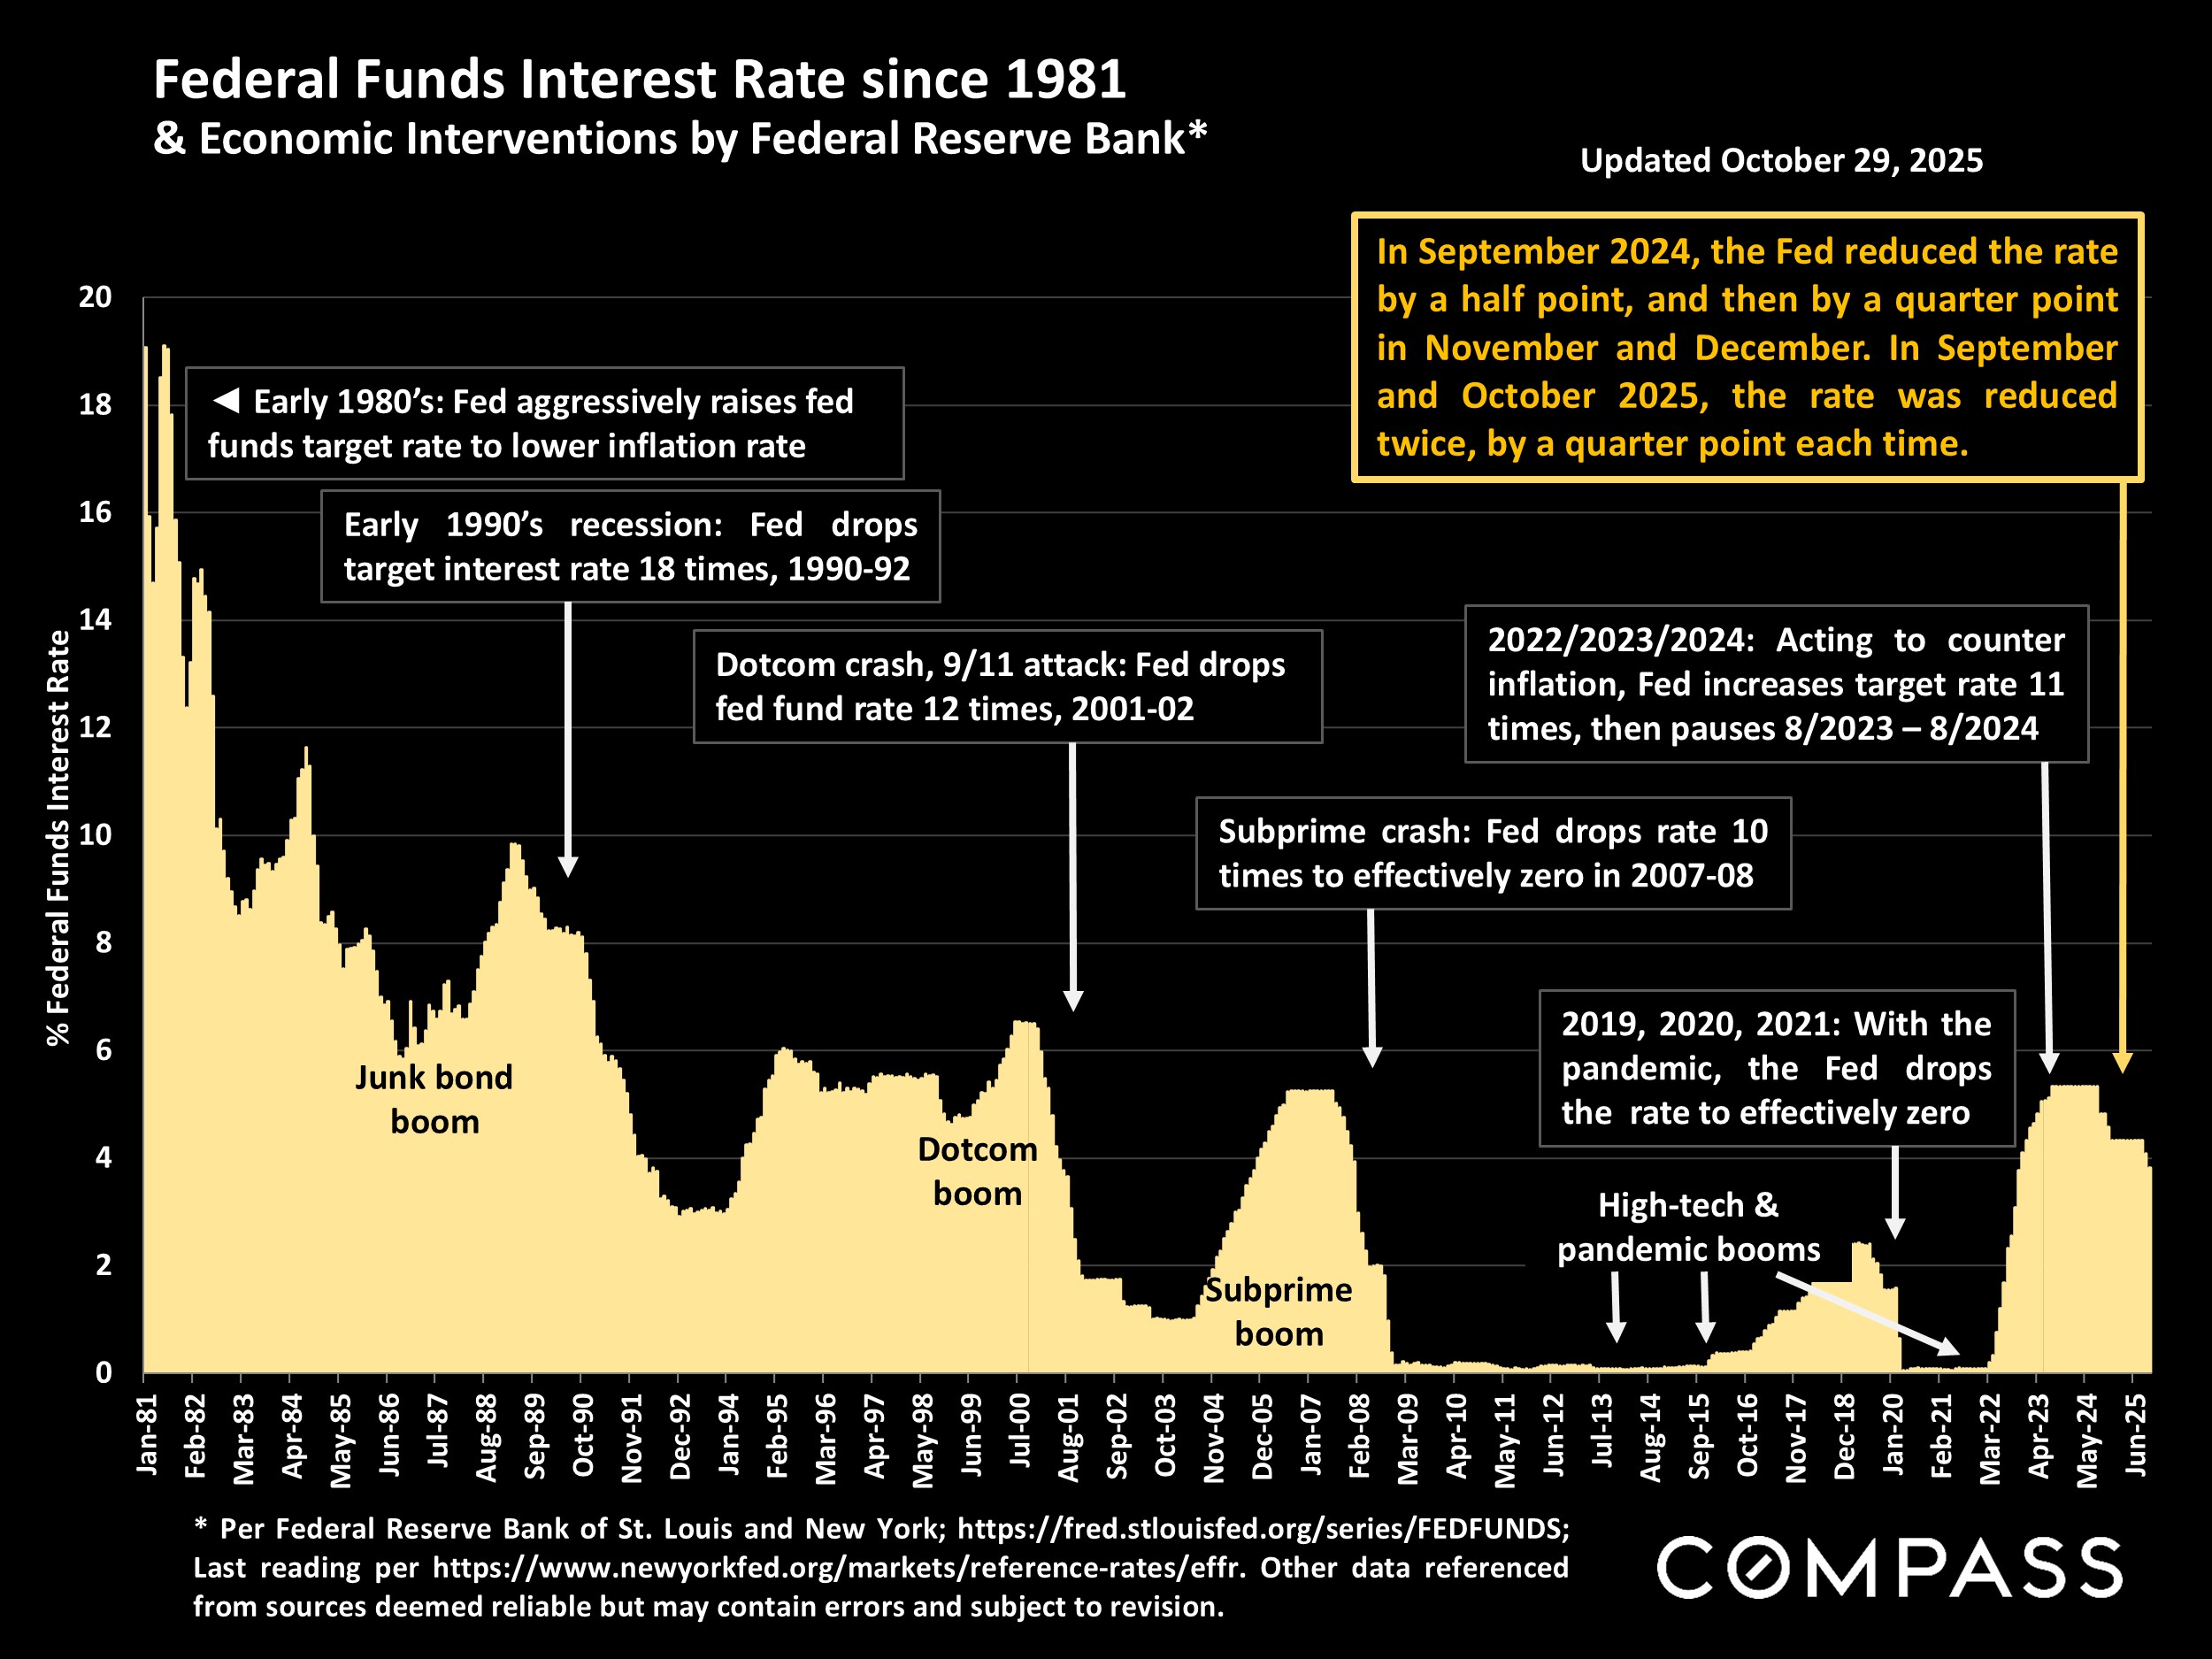
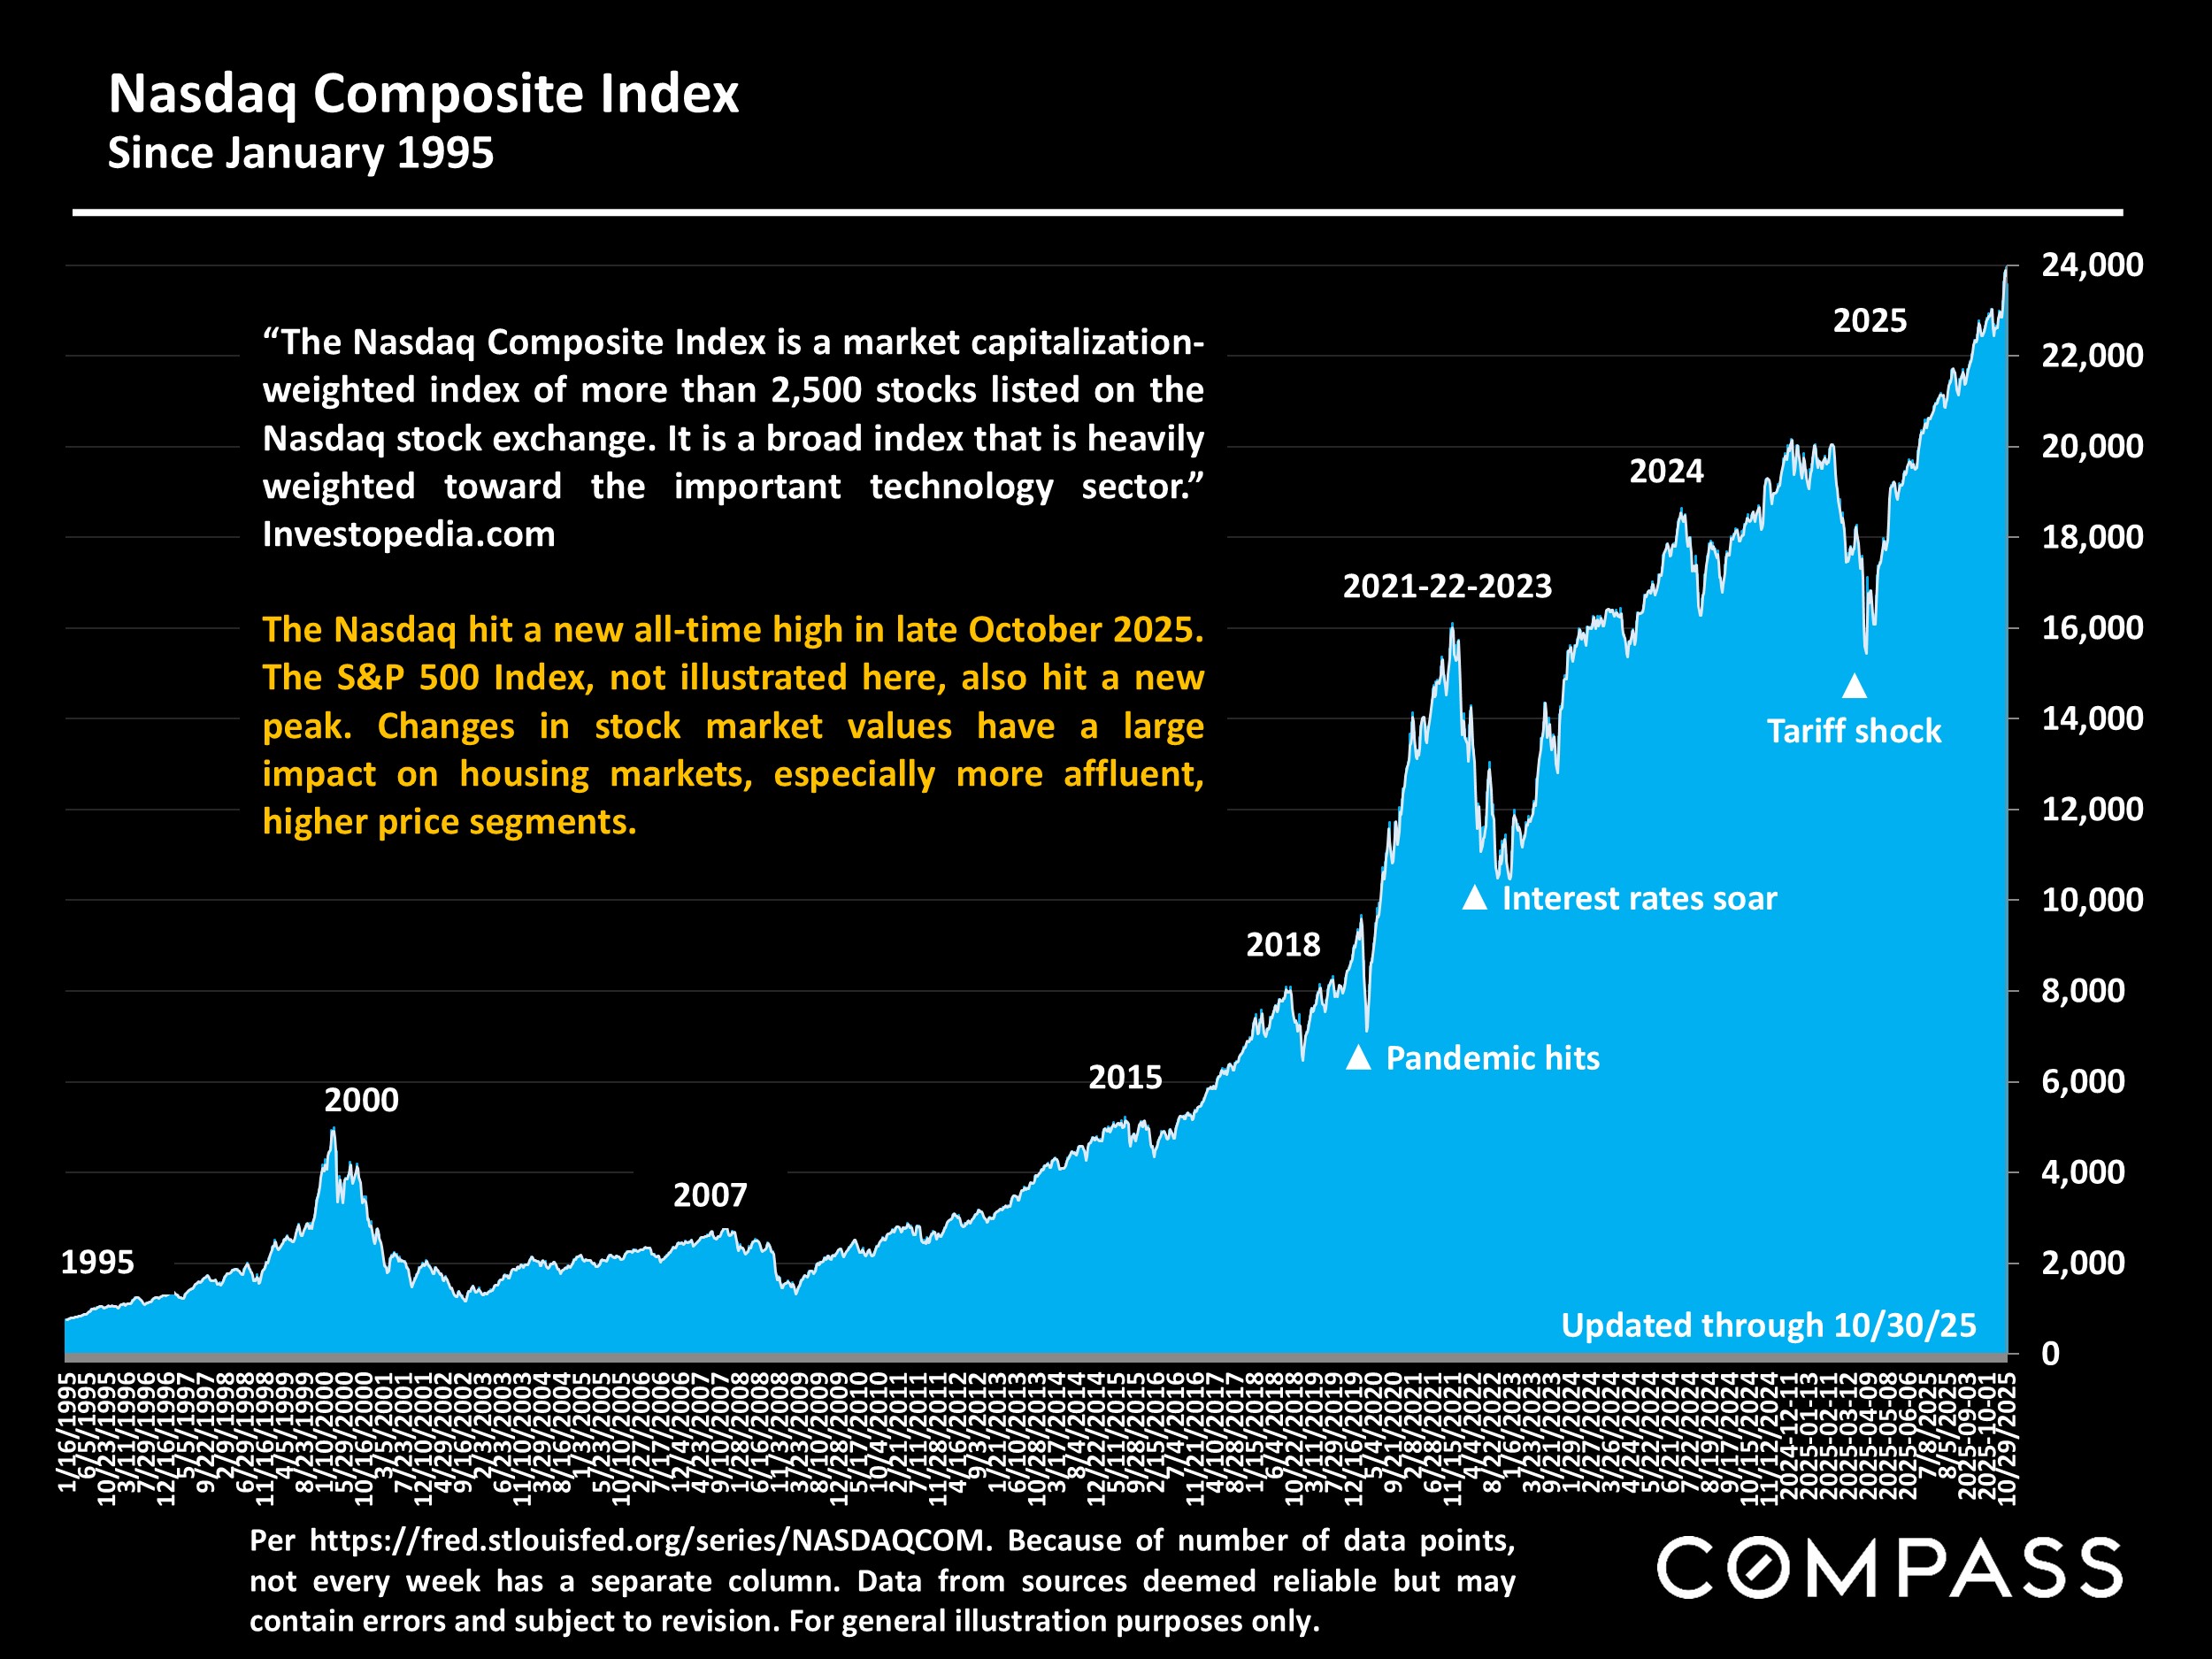
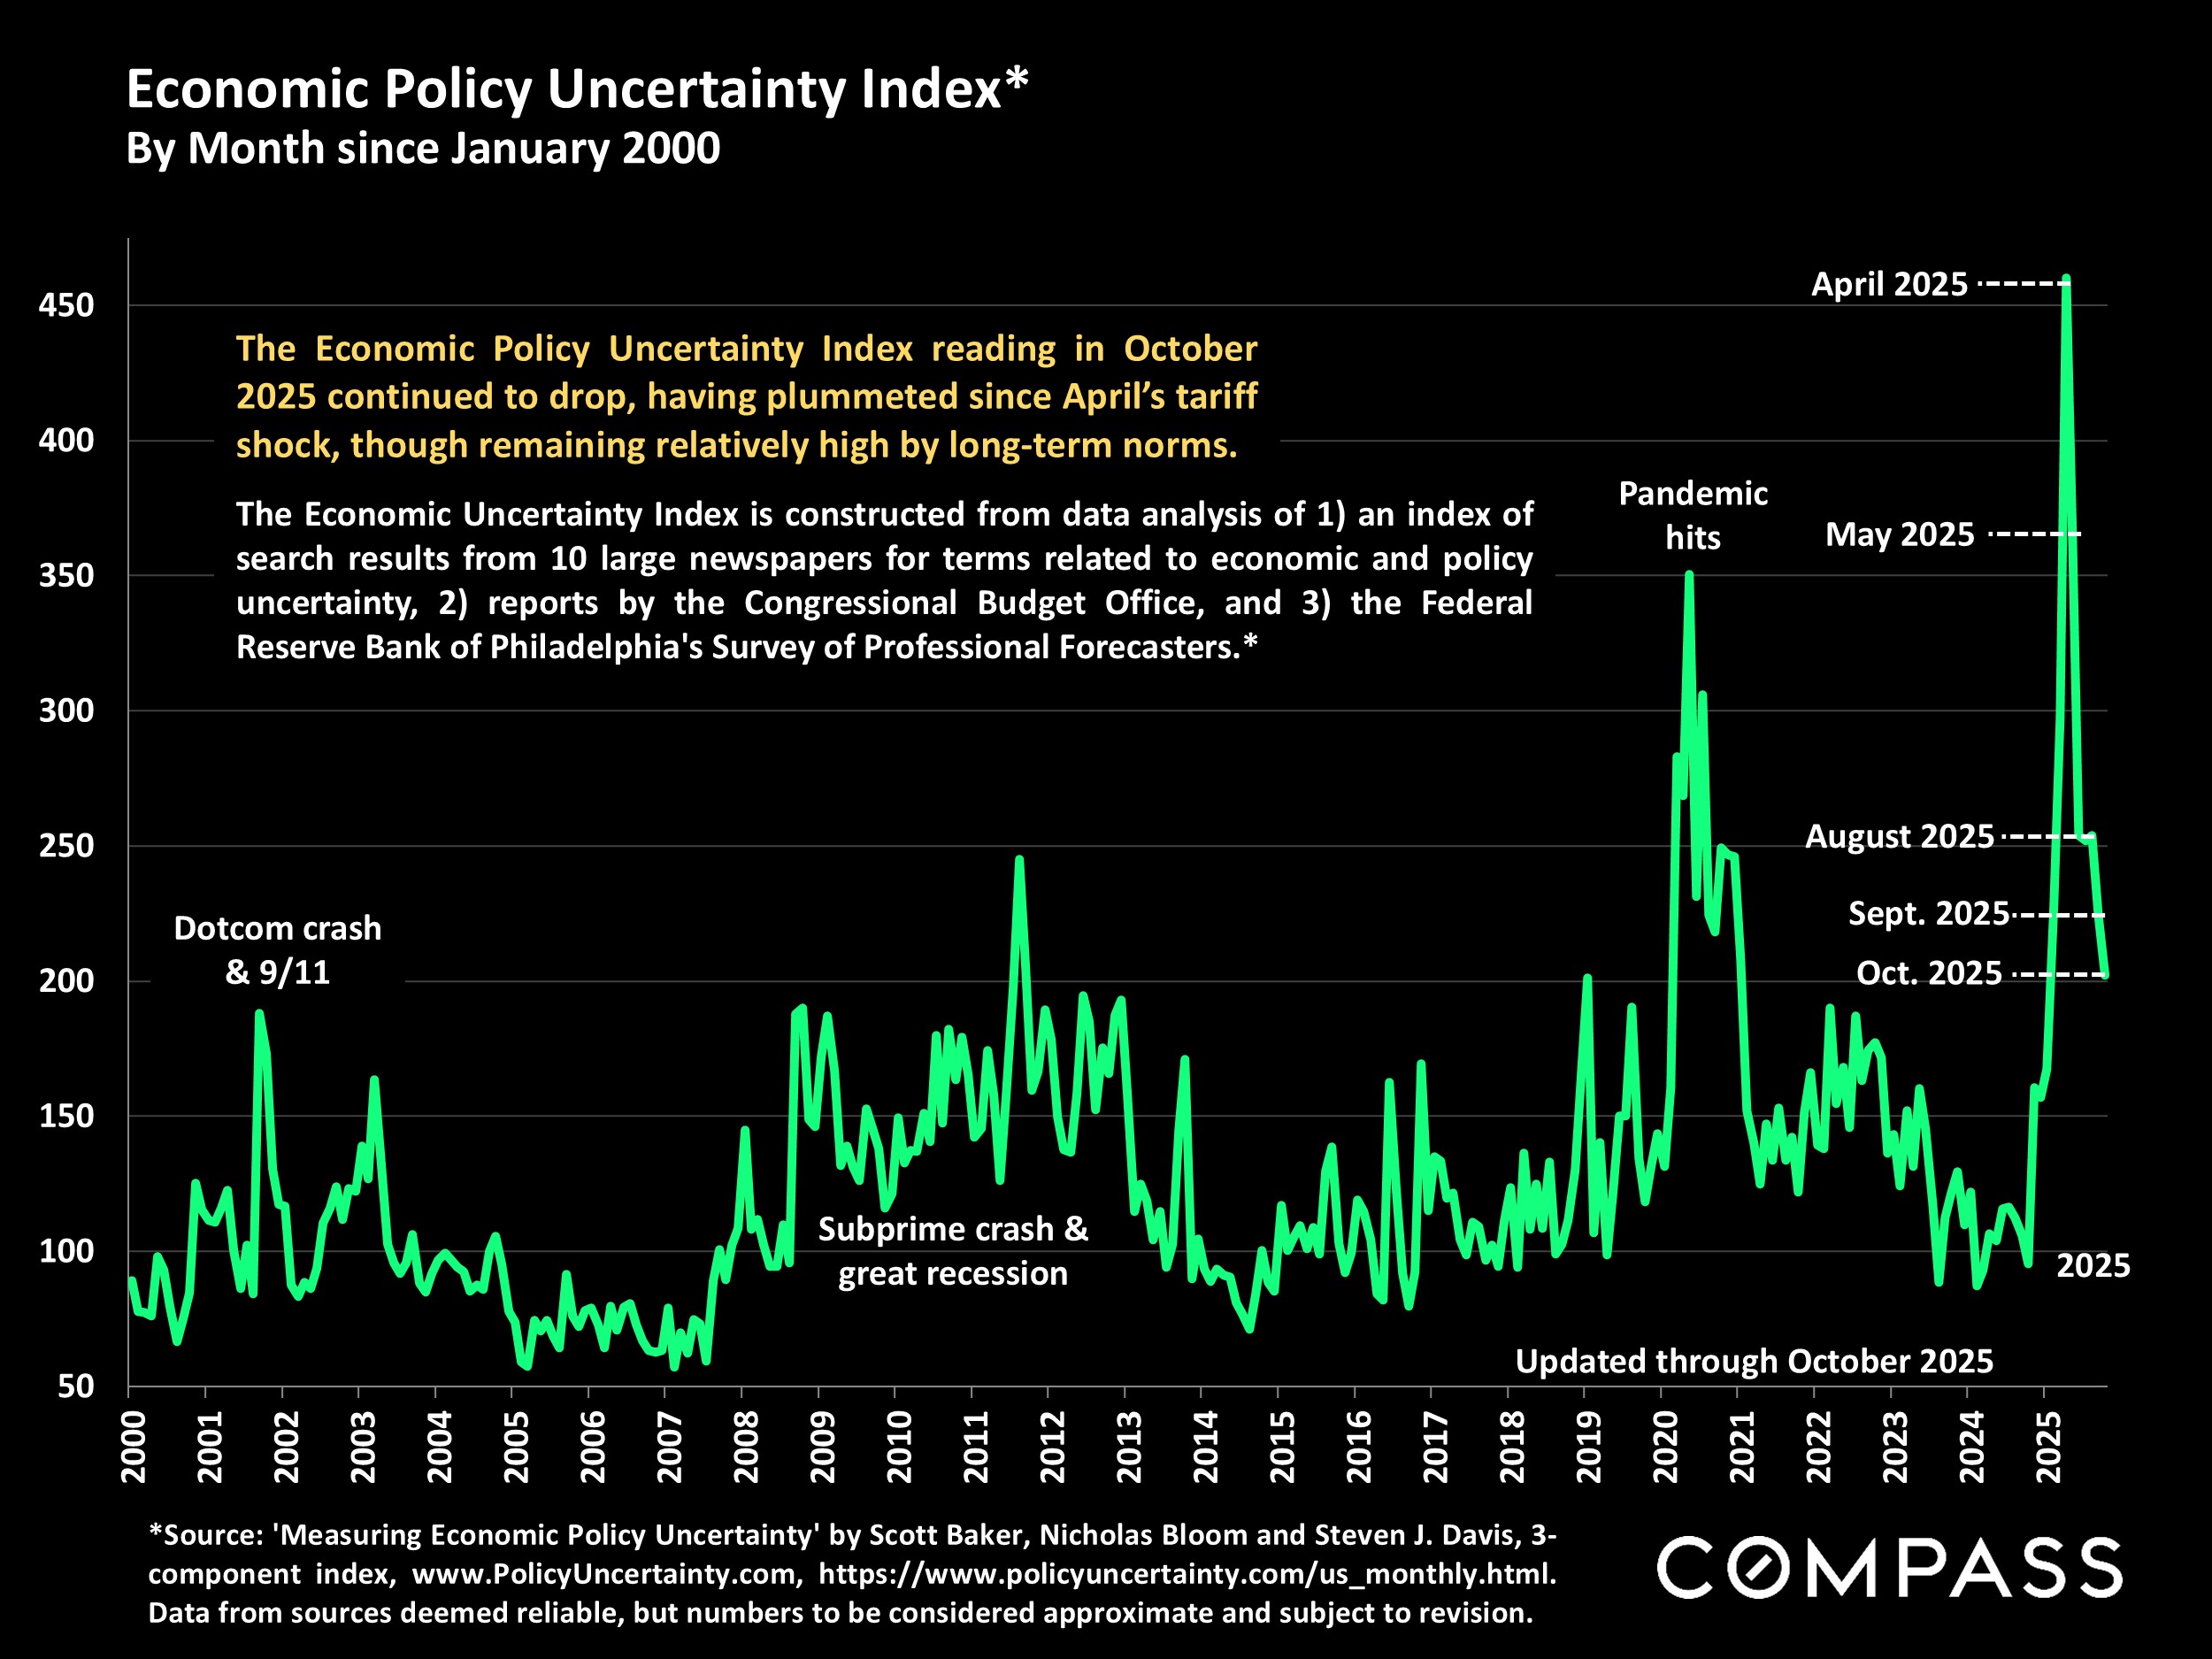
As of the end of October, the S&P 500 and Nasdaq had reached new highs; 30-year mortgage rates hit their lowest point in over a year; inflation ticked up slightly to 3%; and the Fed made its second .25% reduction of its benchmark rate in 2025 (while cautioning that another reduction in December was not certain). General consumer confidence remained low, with significant unease regarding personal finances, job security, and inflation - though affluent consumers enjoying substantial stock market gains were less worried. The Economic Policy Uncertainty Index continued to decline from its tariff-shock peak in April but remained high by long-term norms.

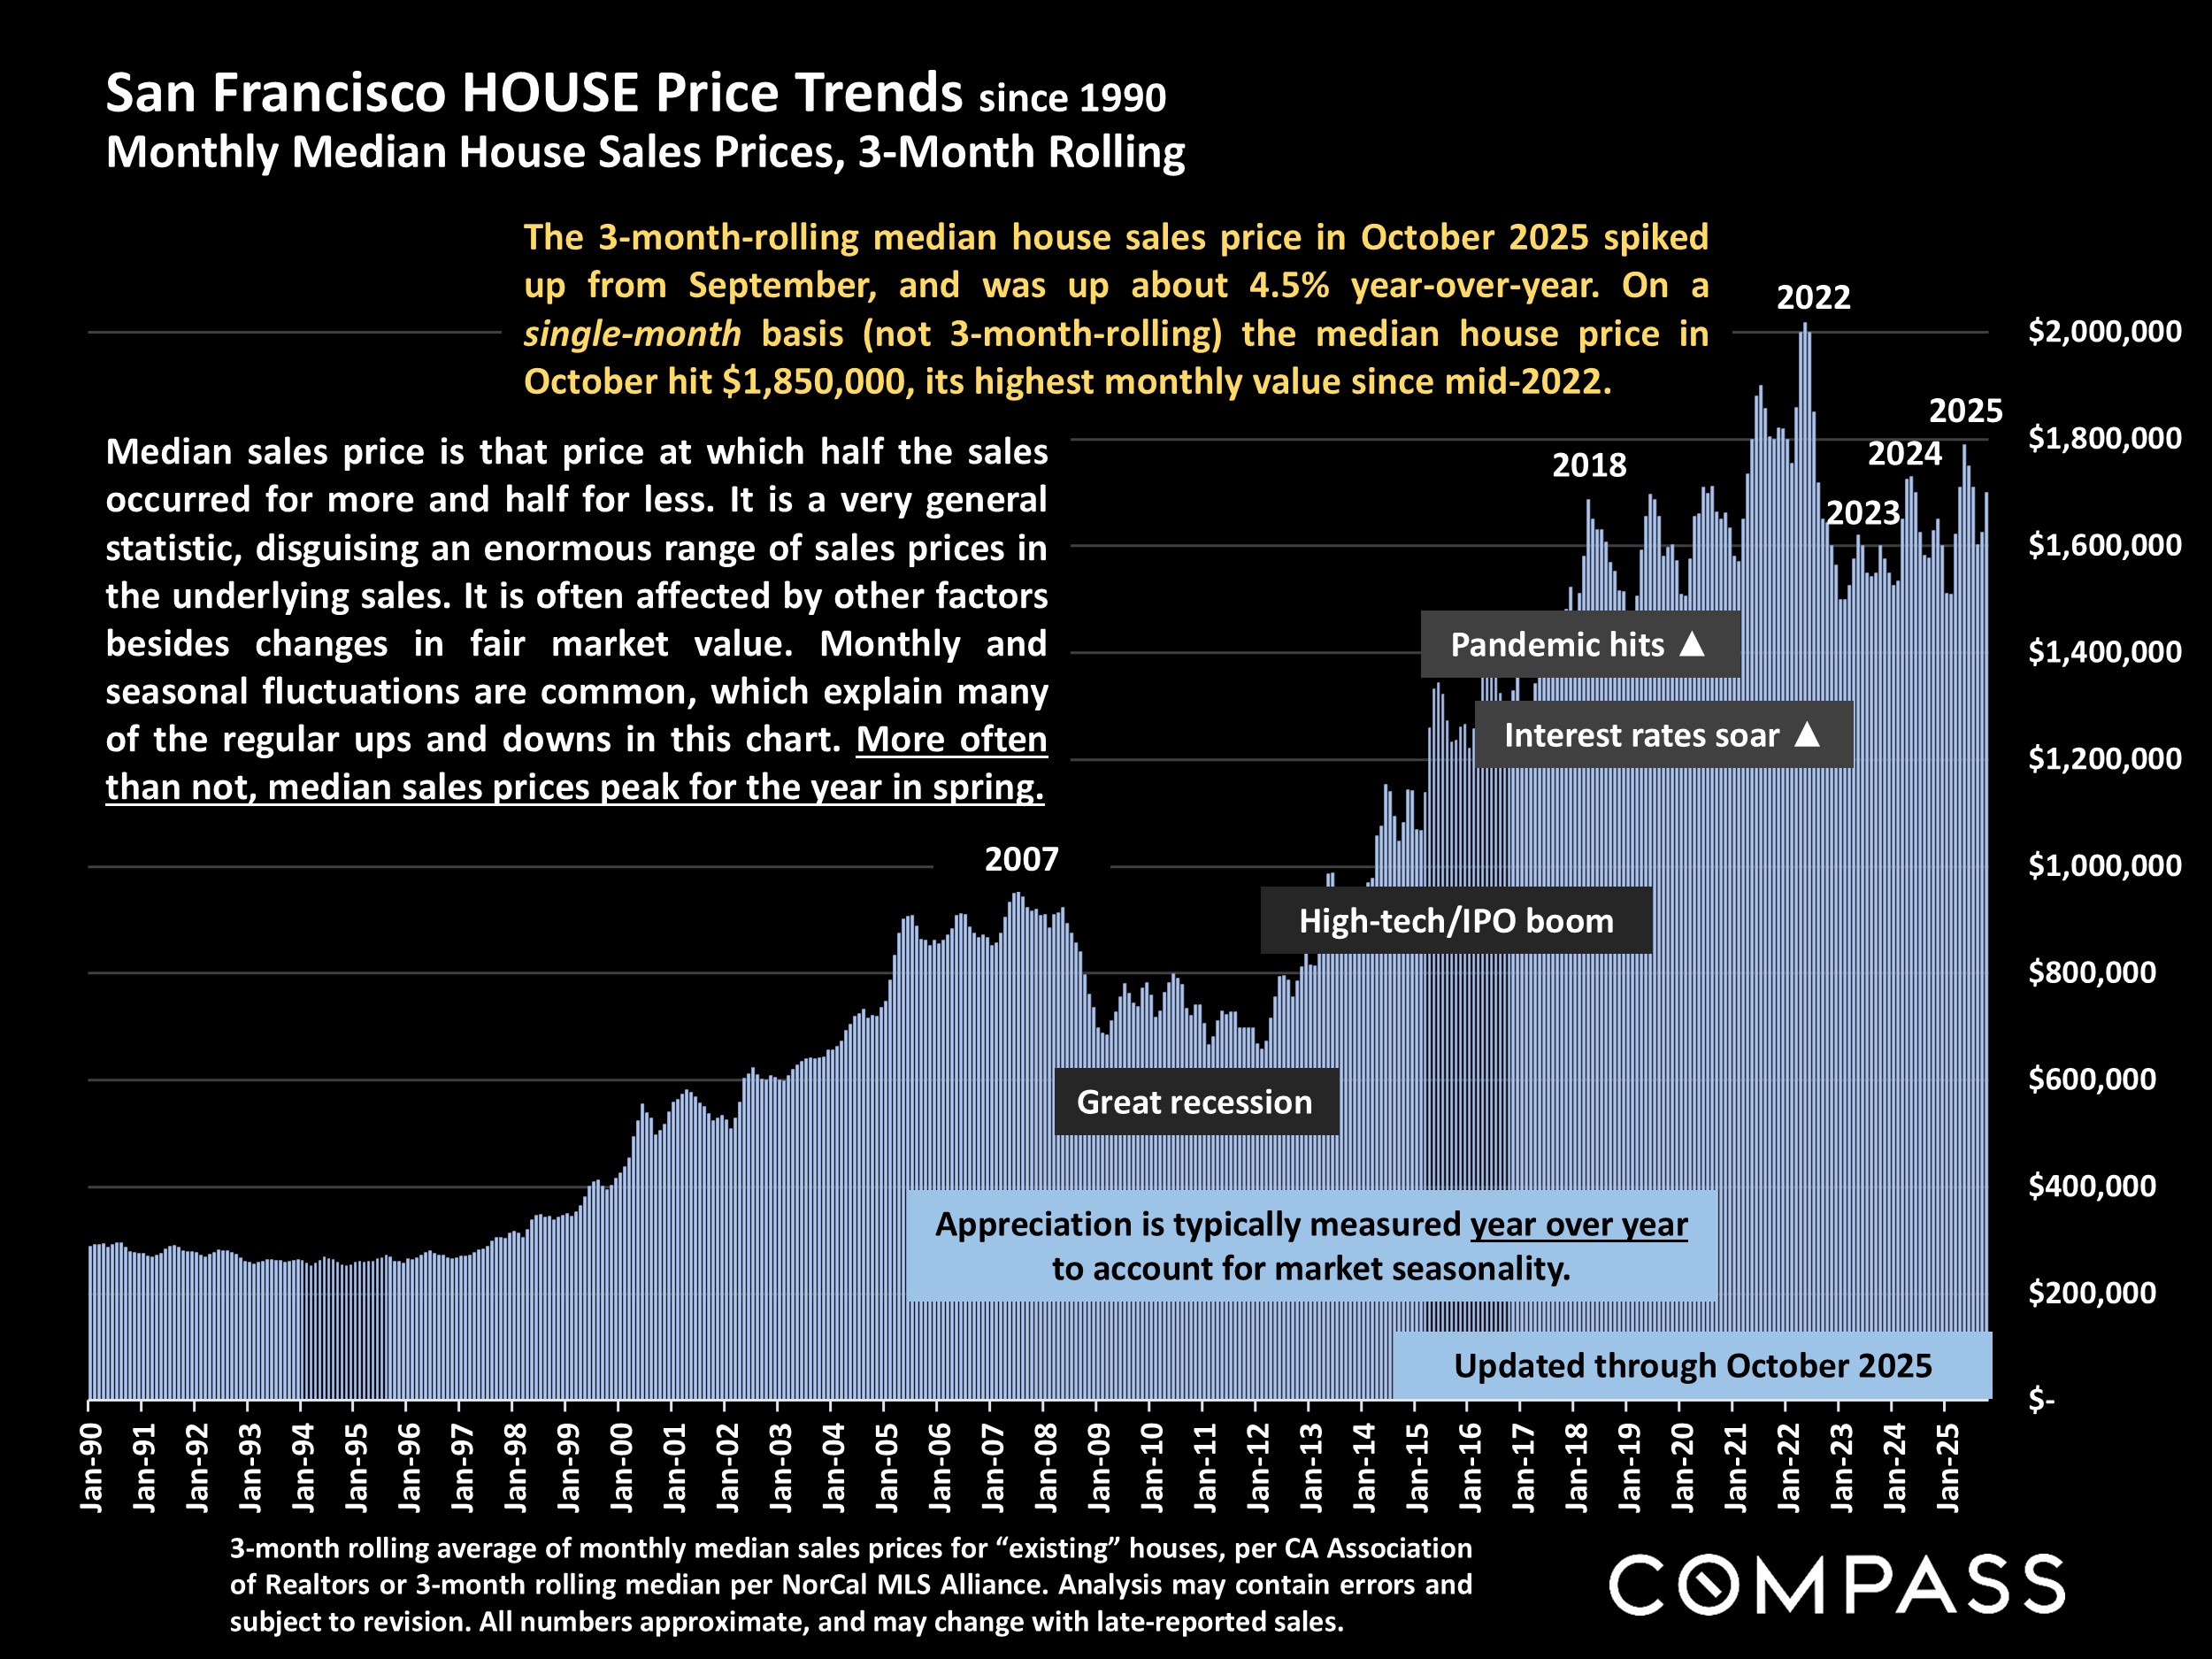
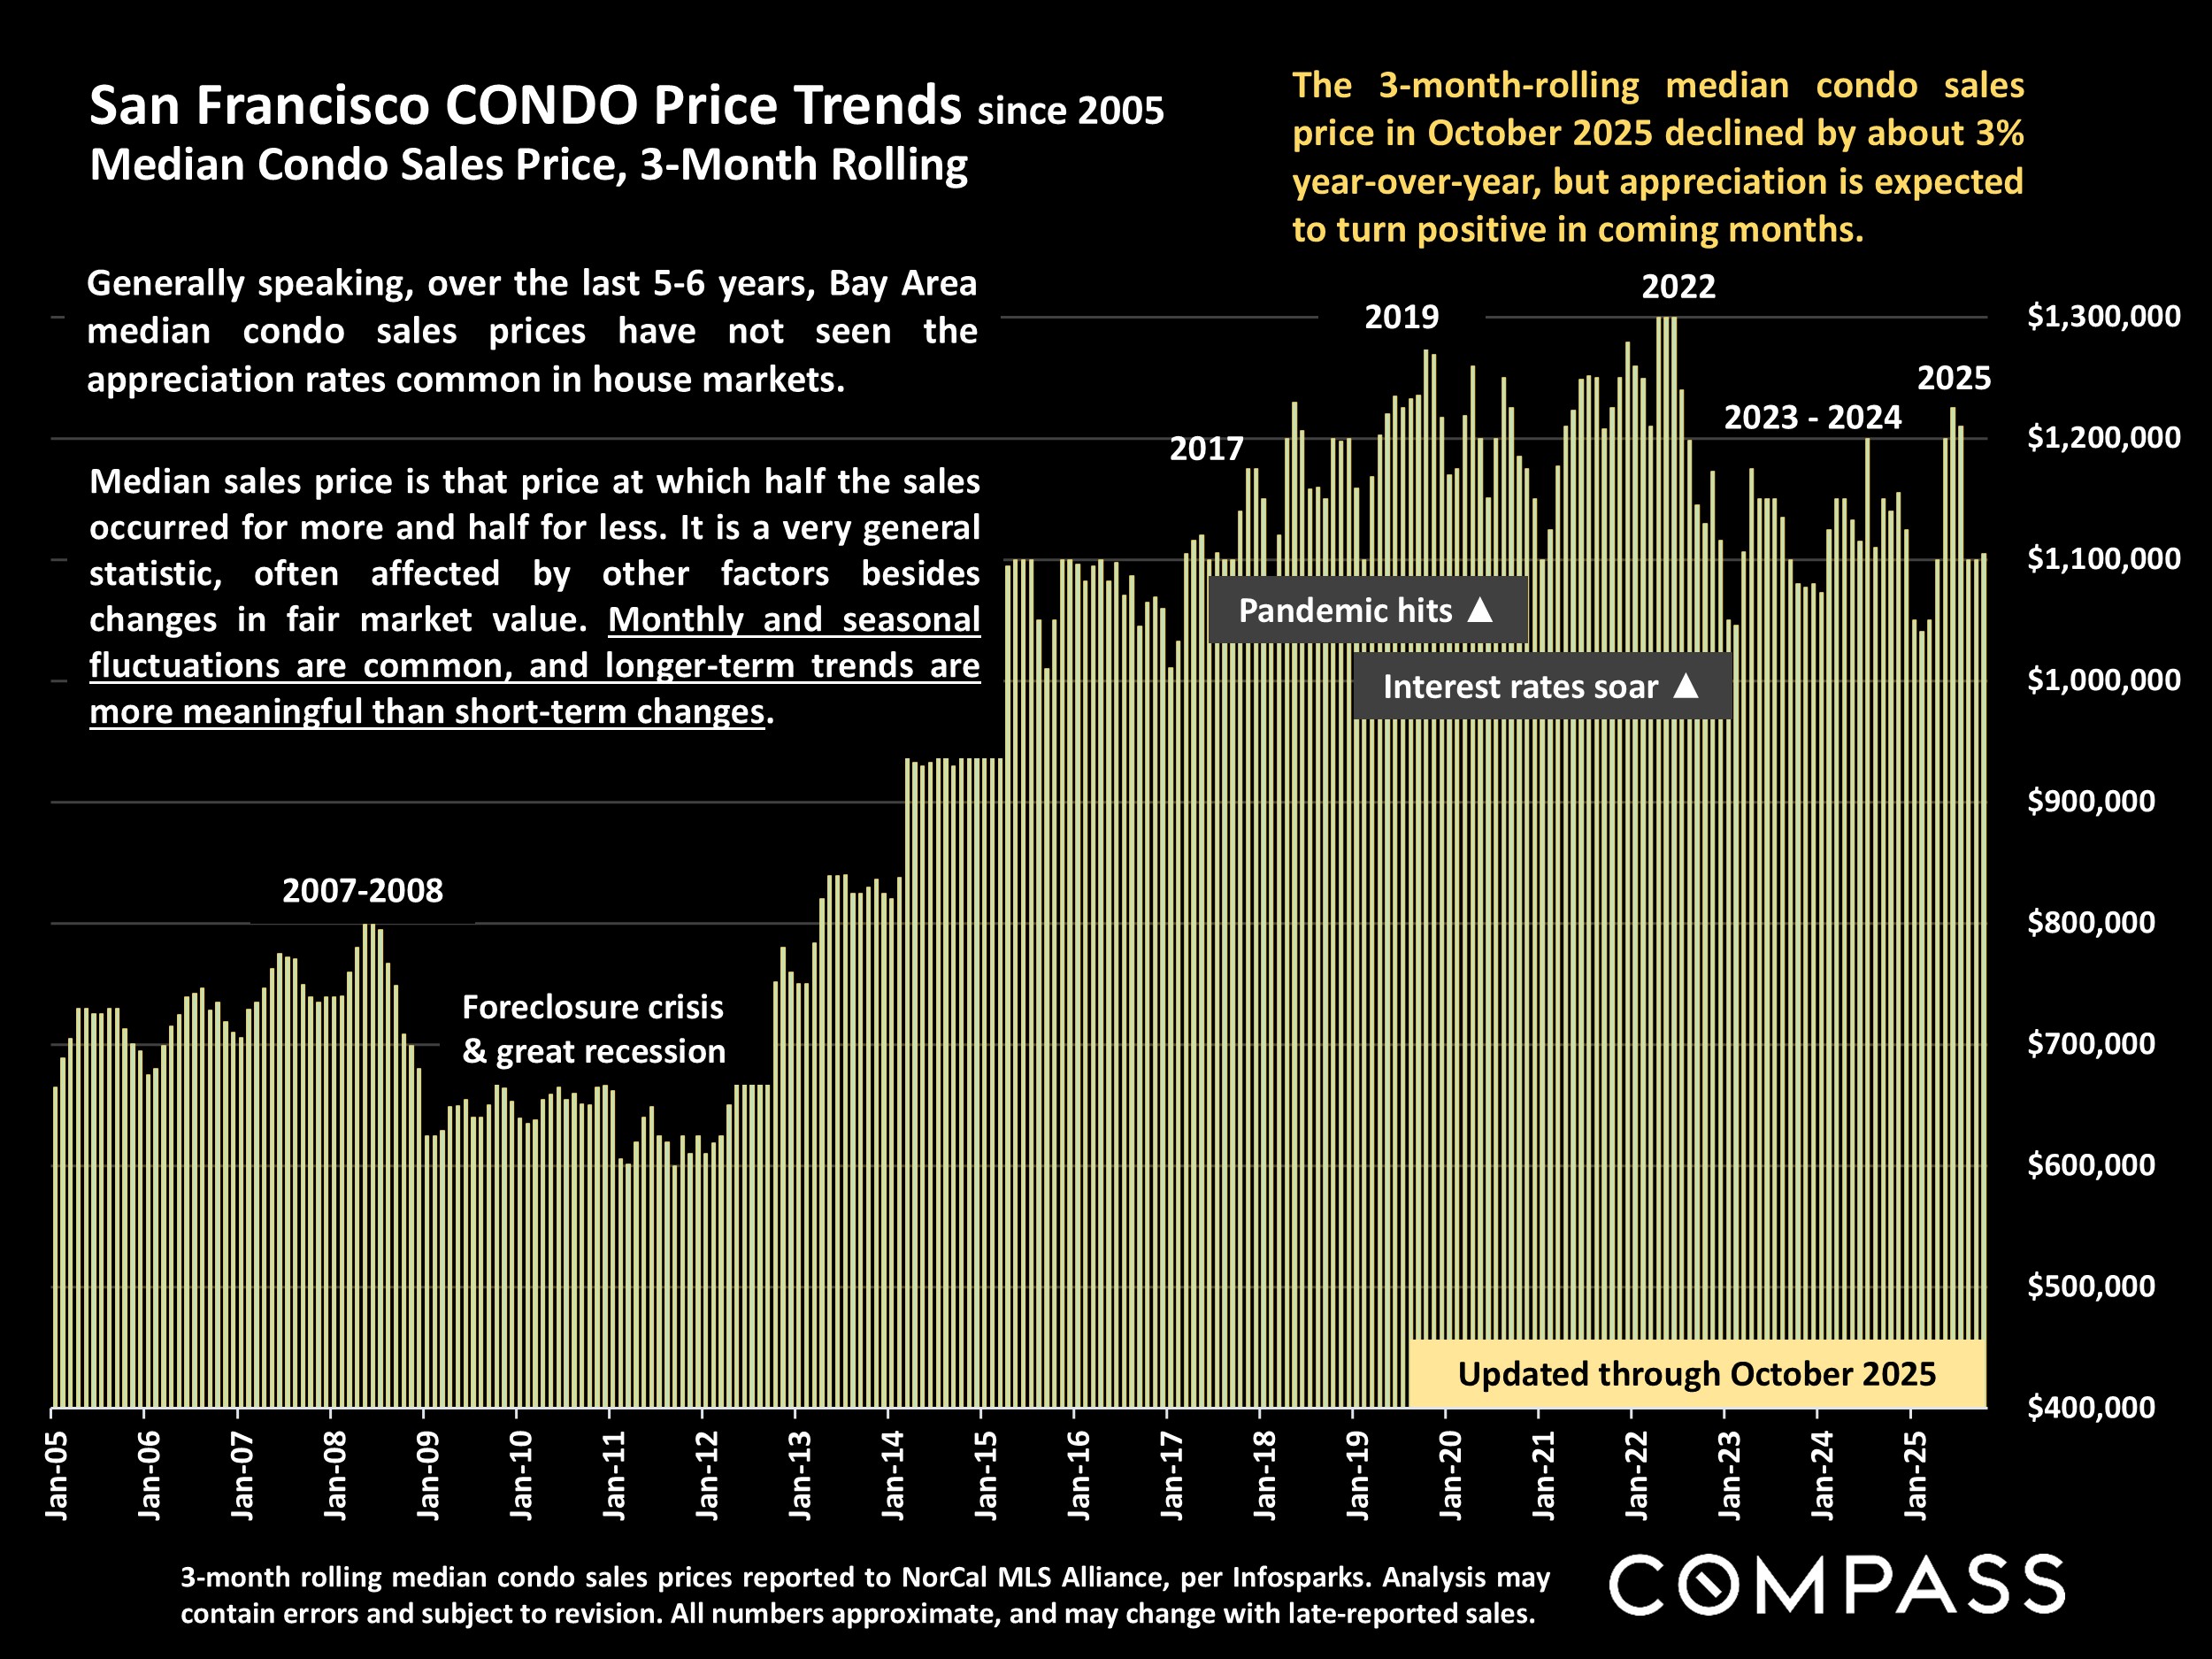
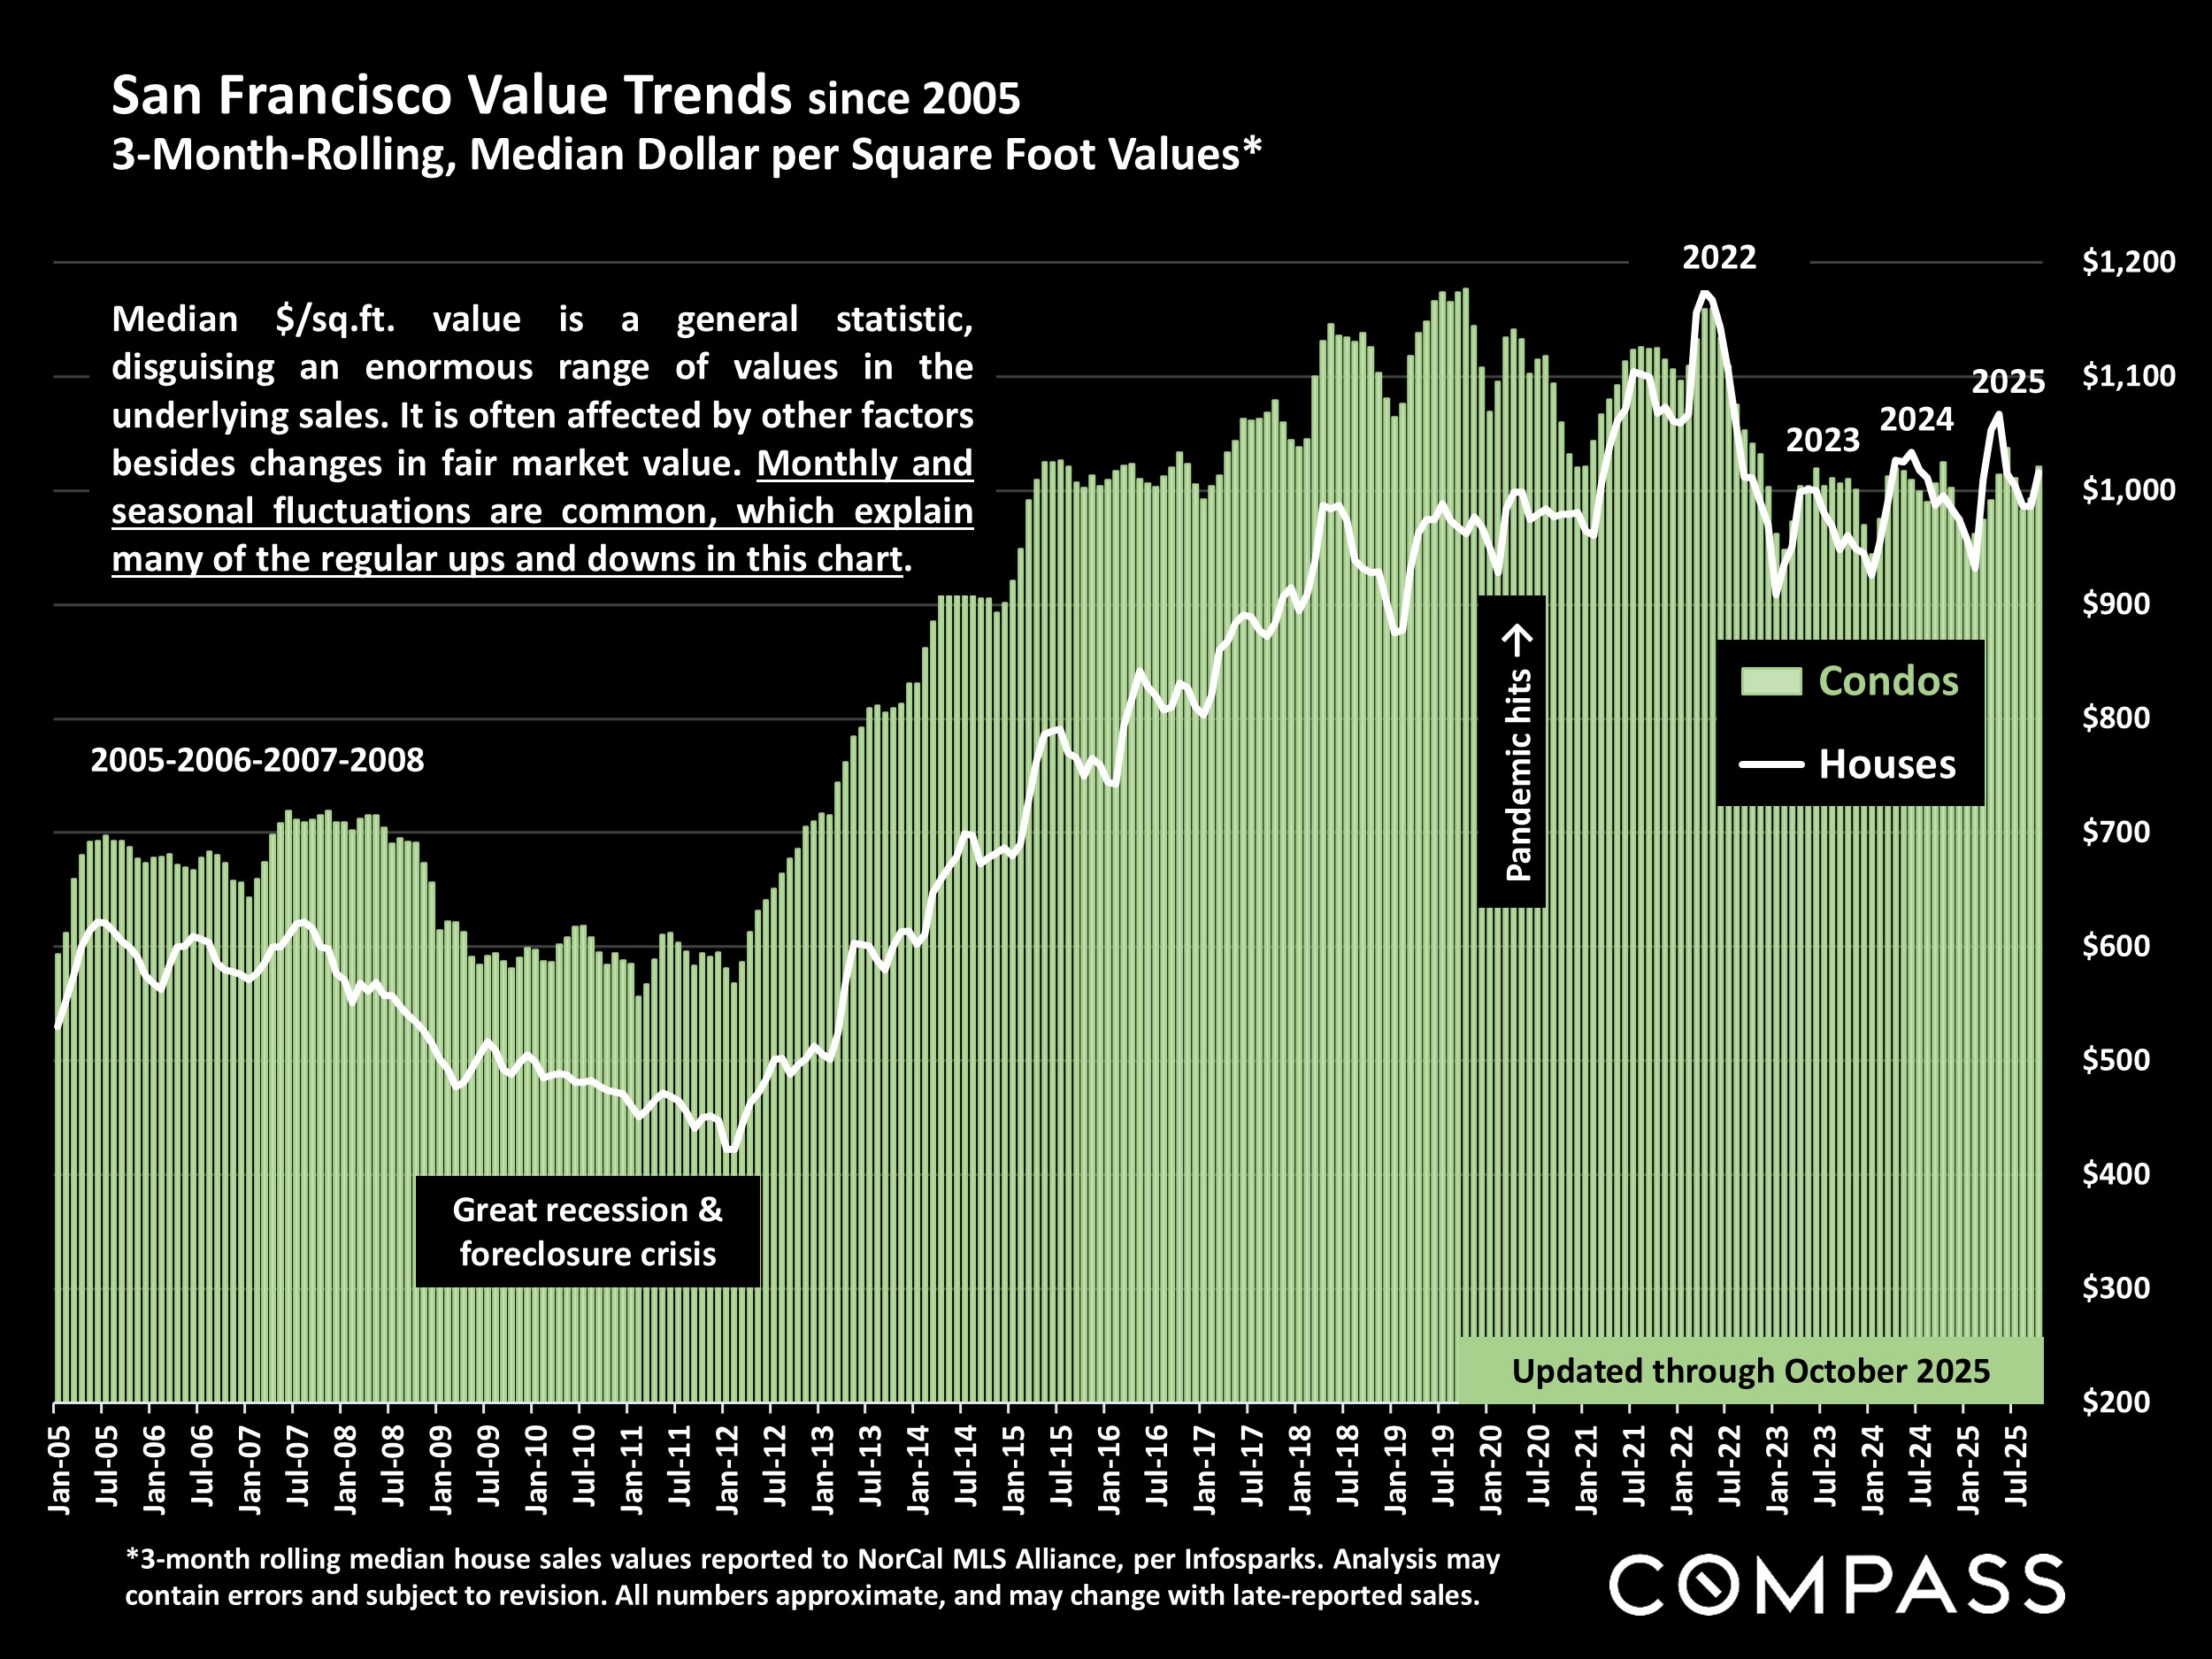
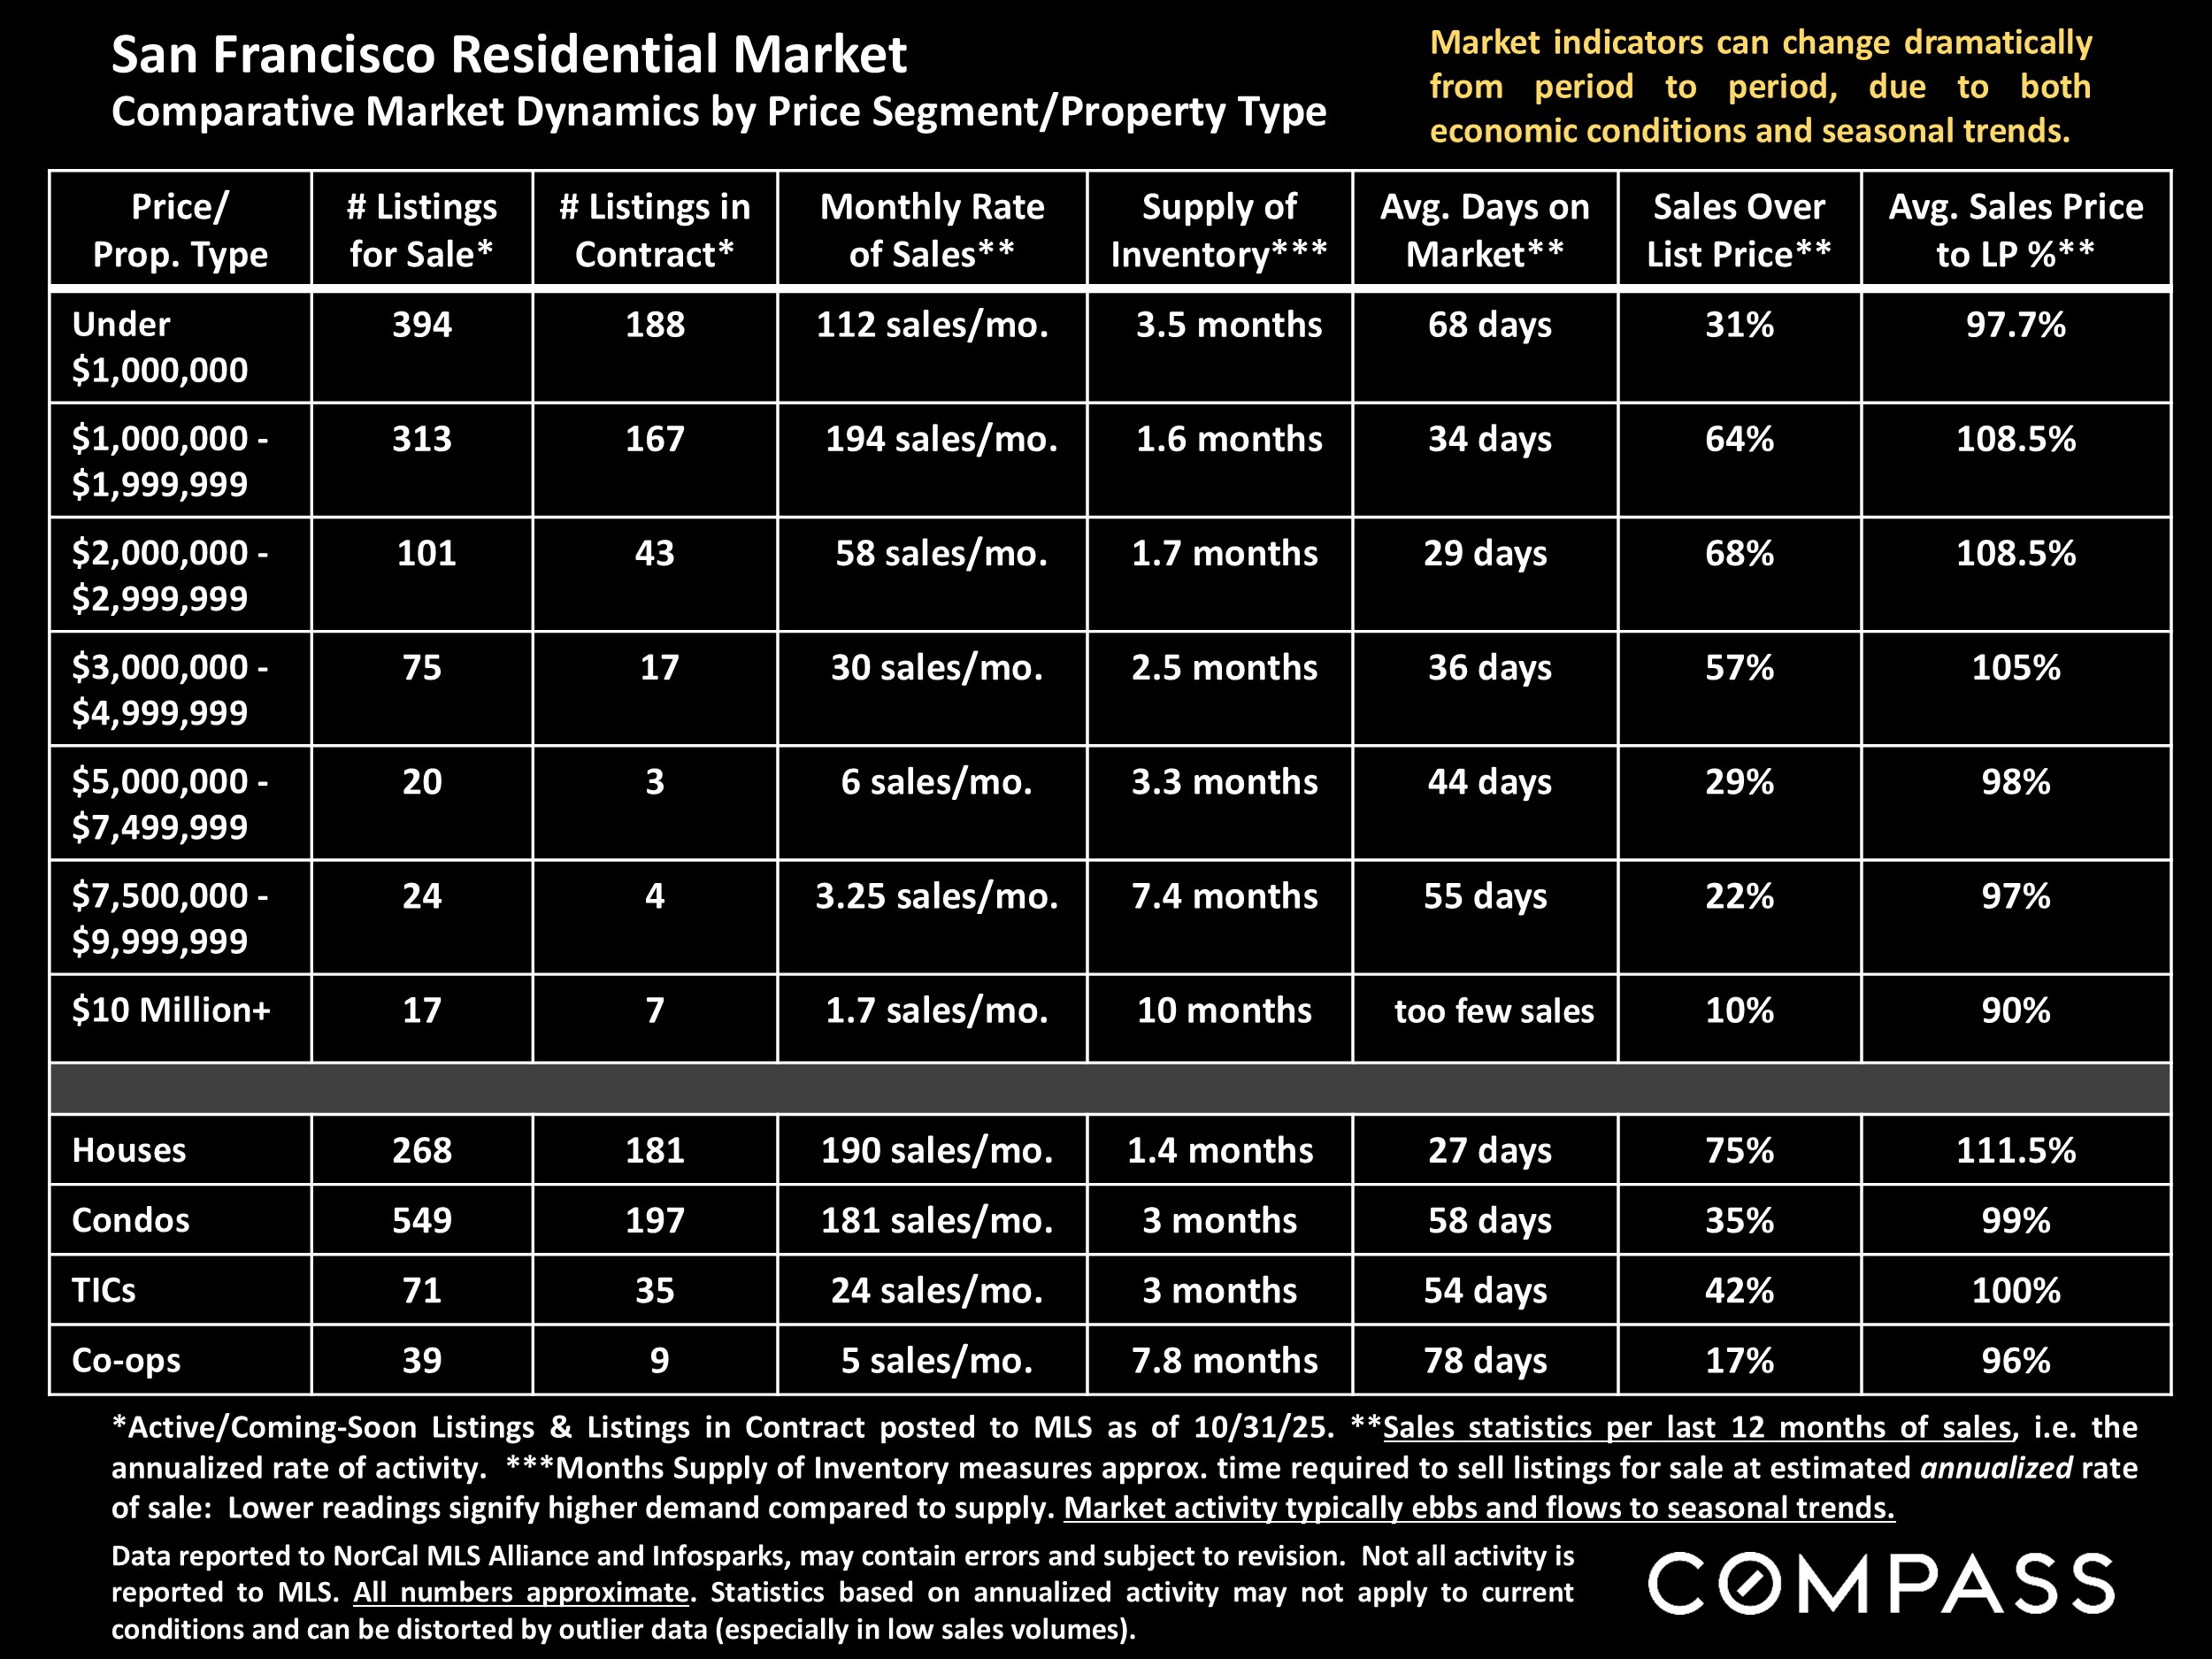
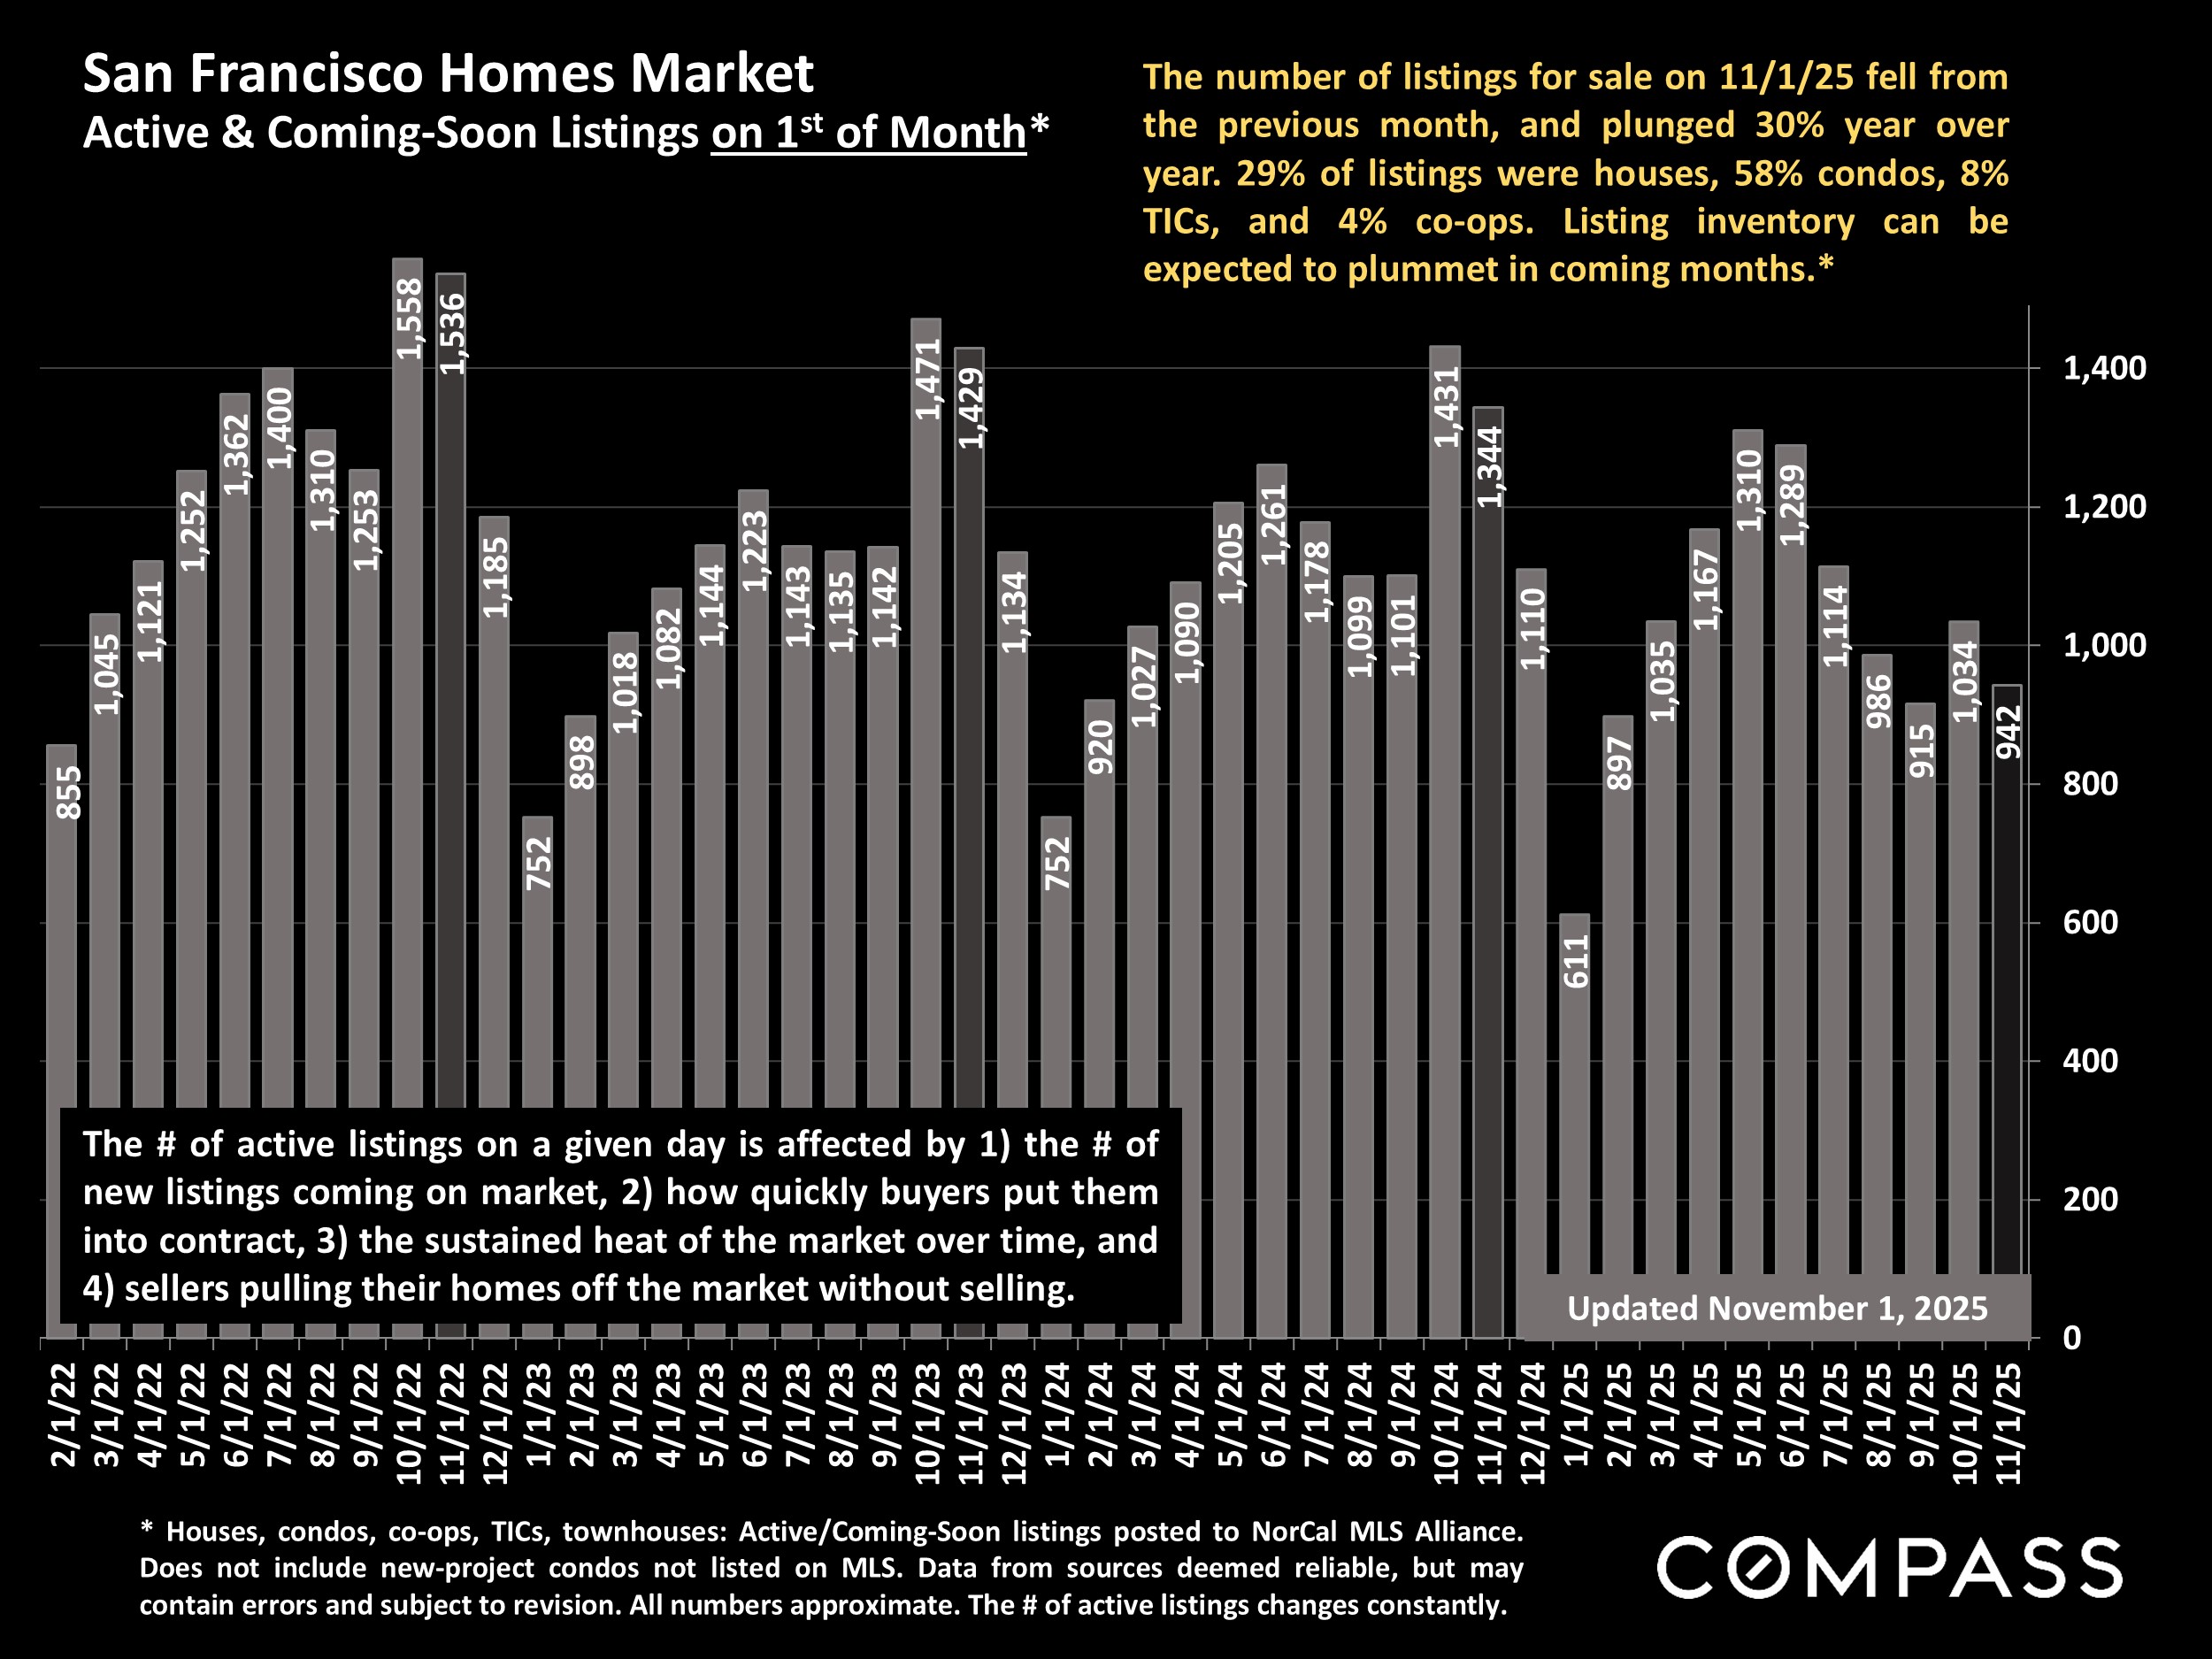
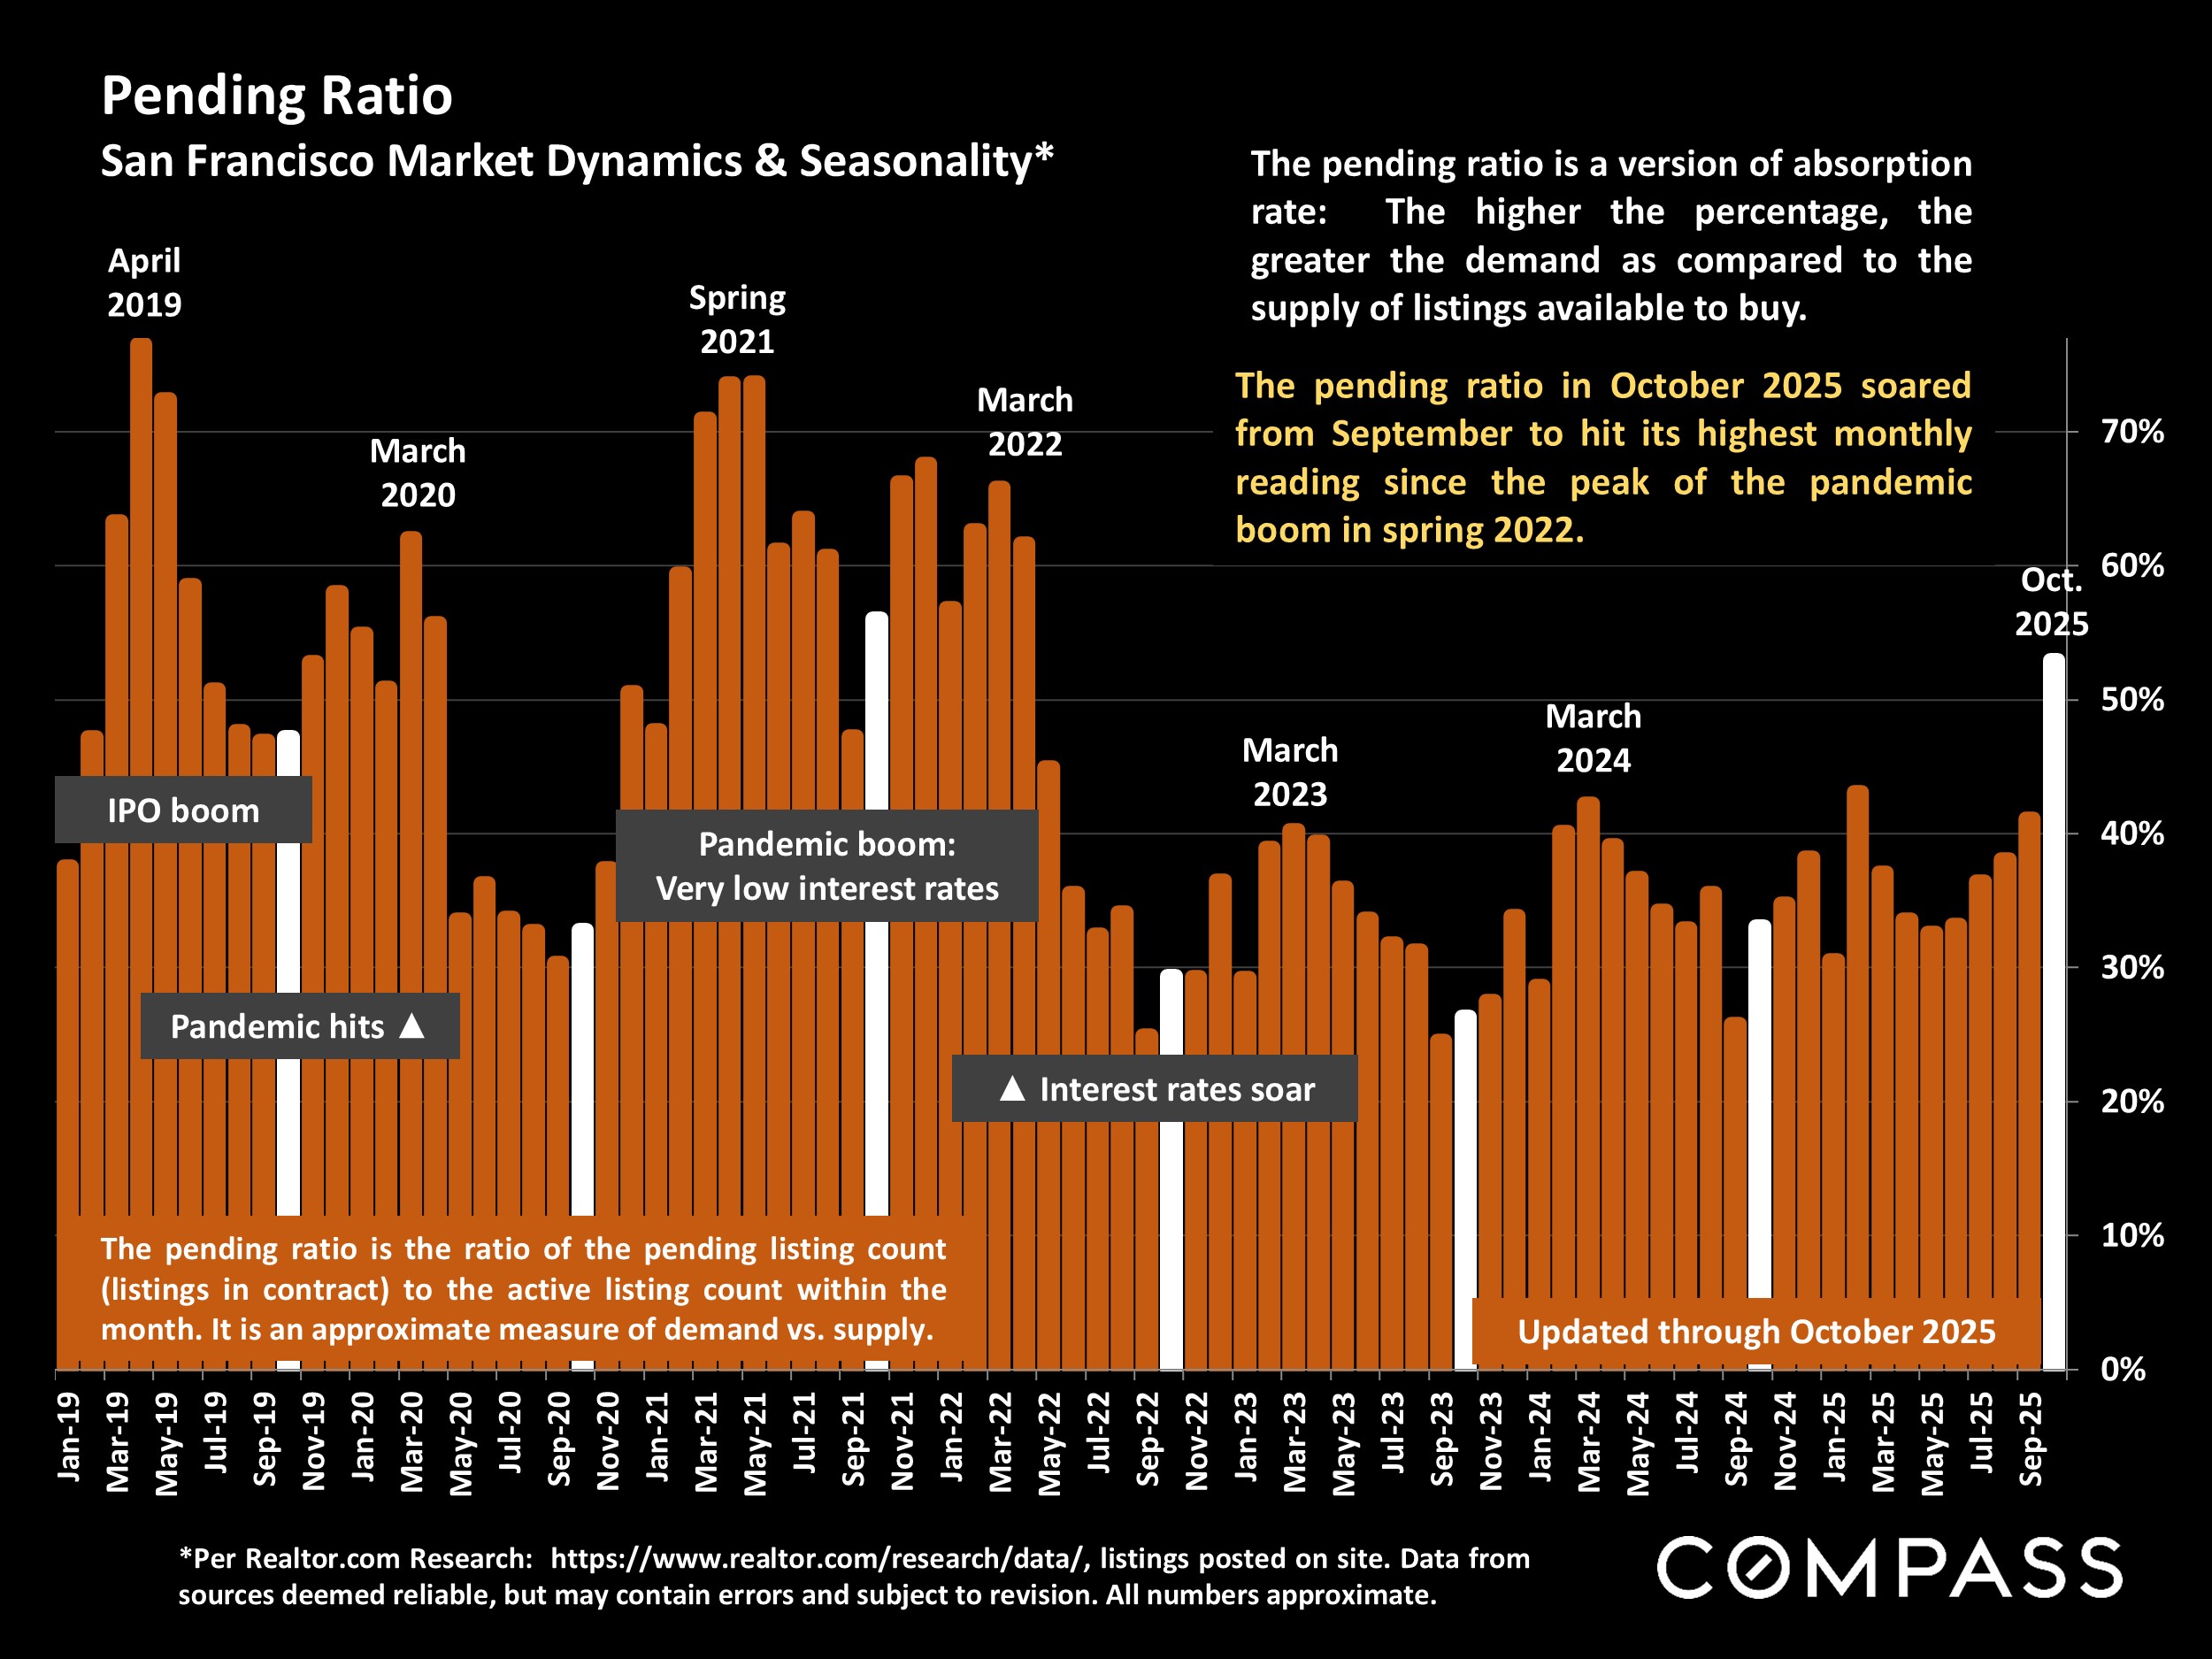
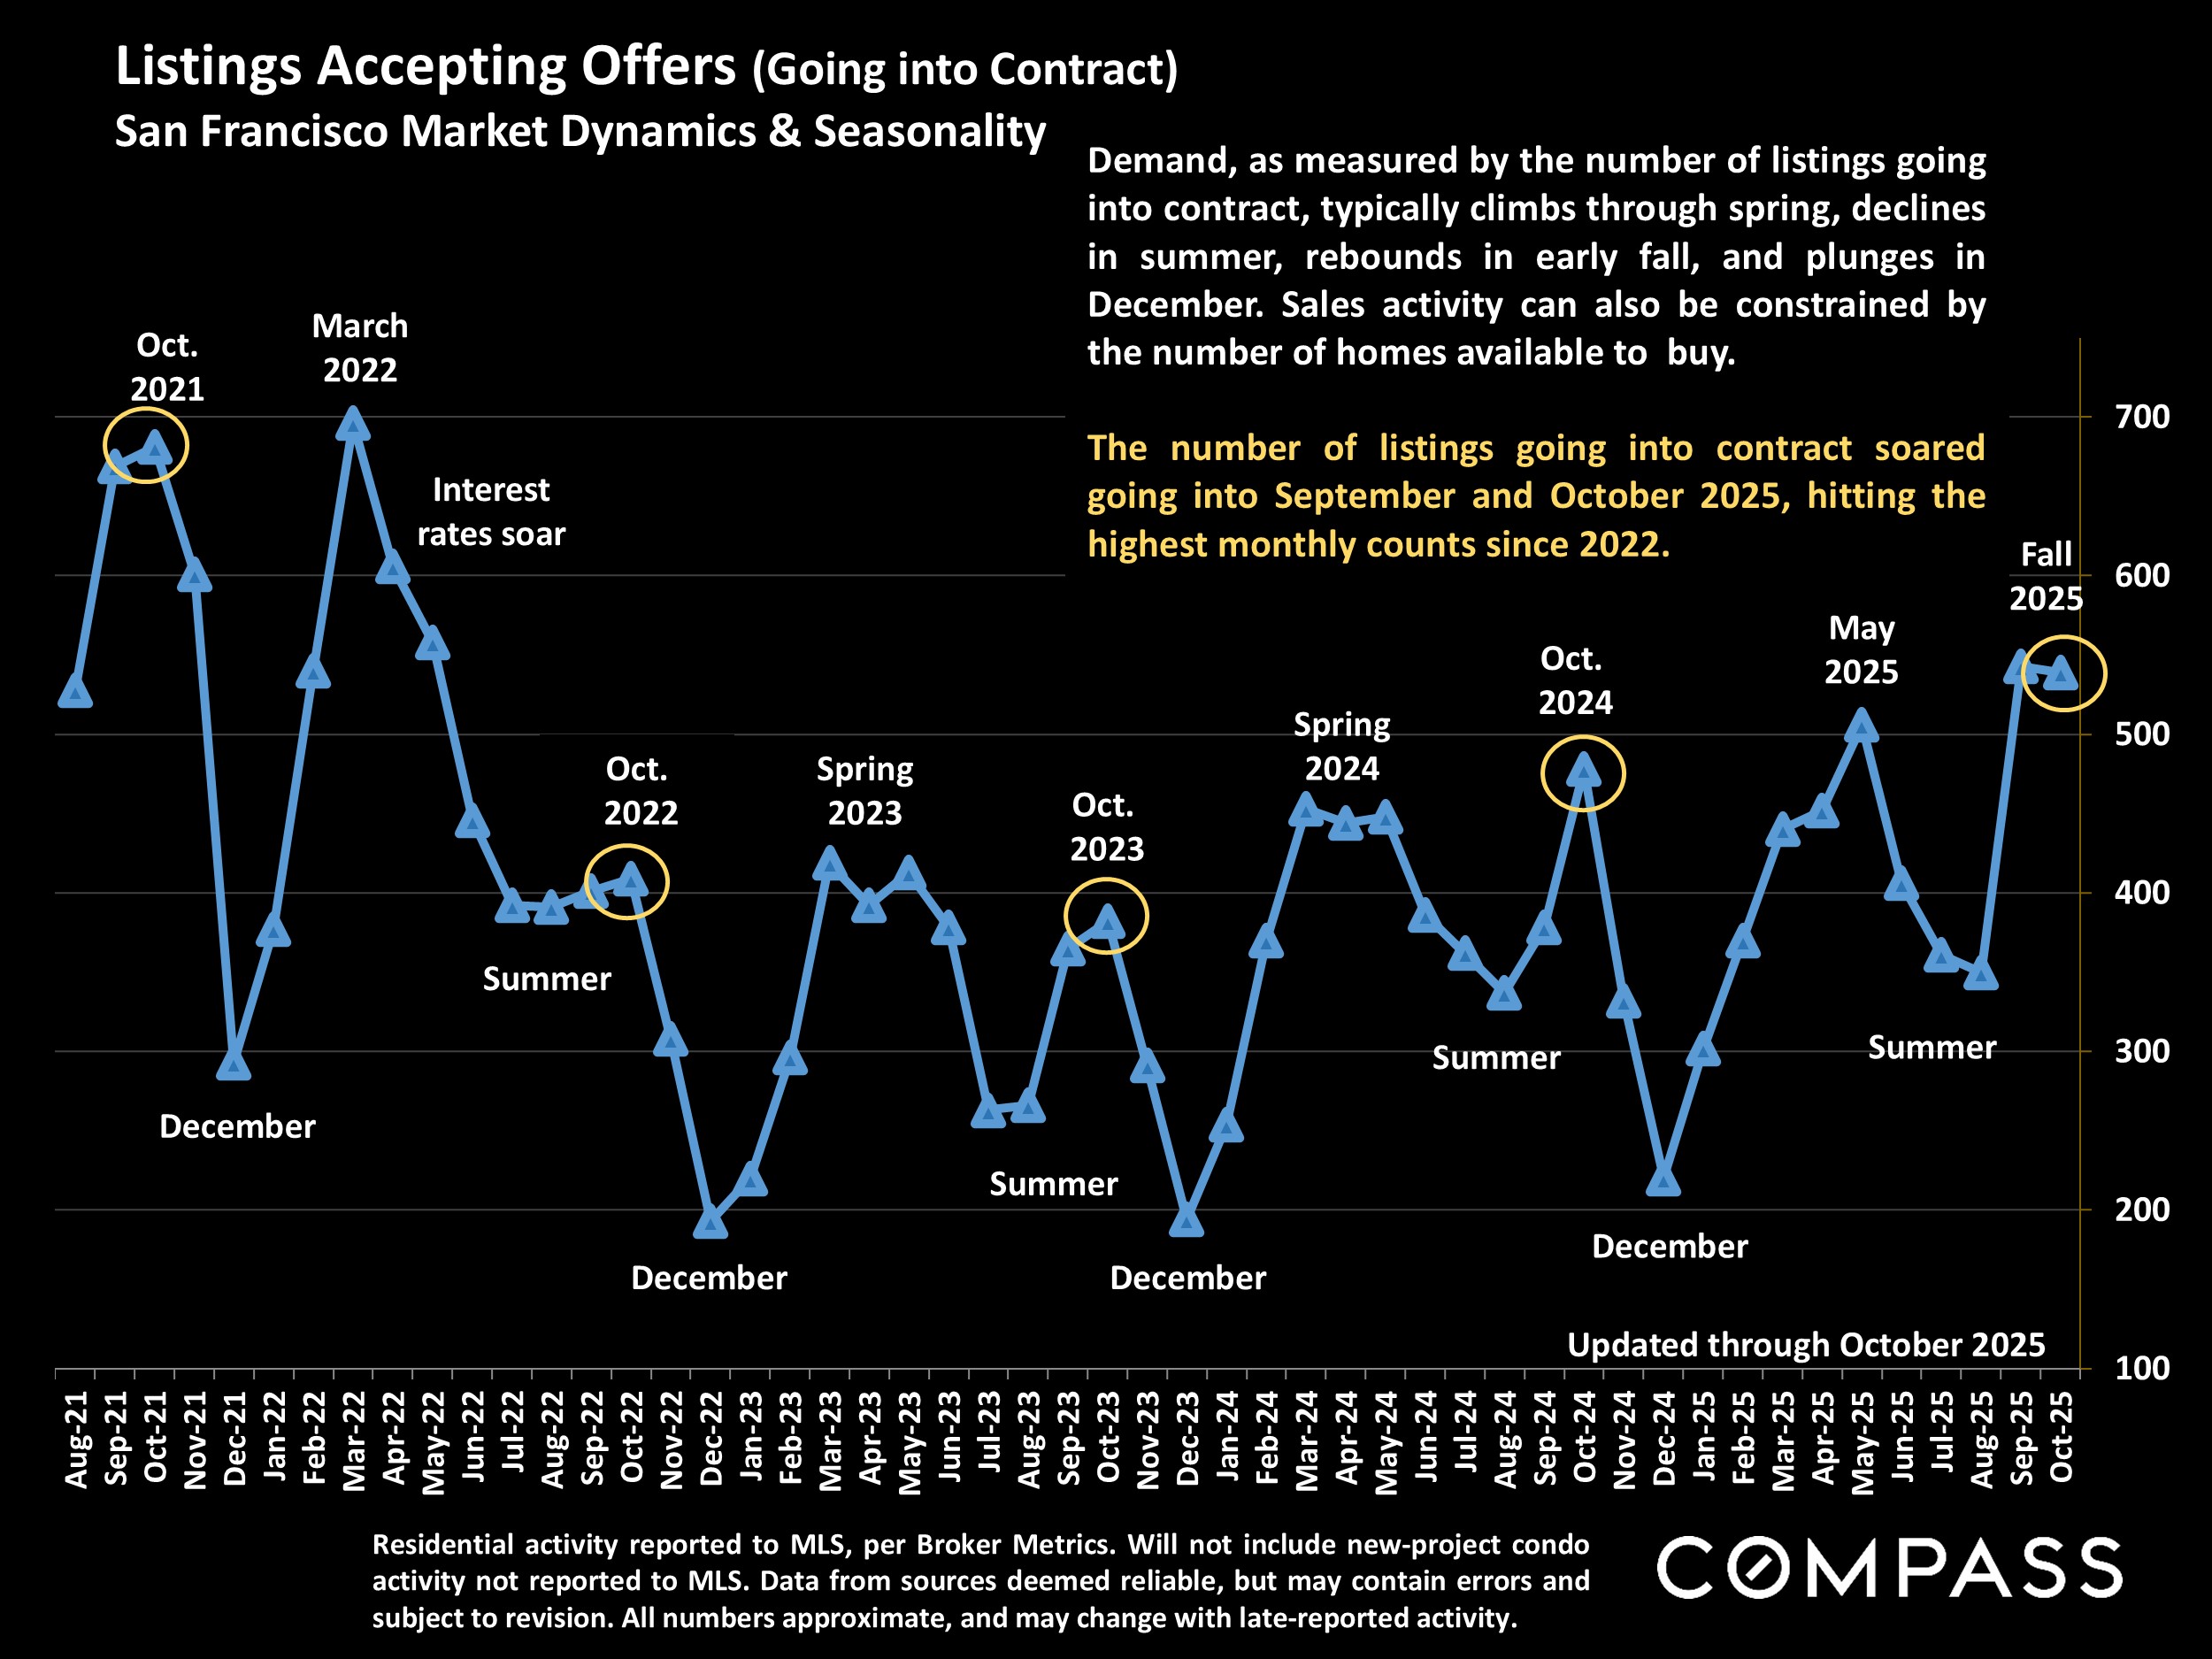
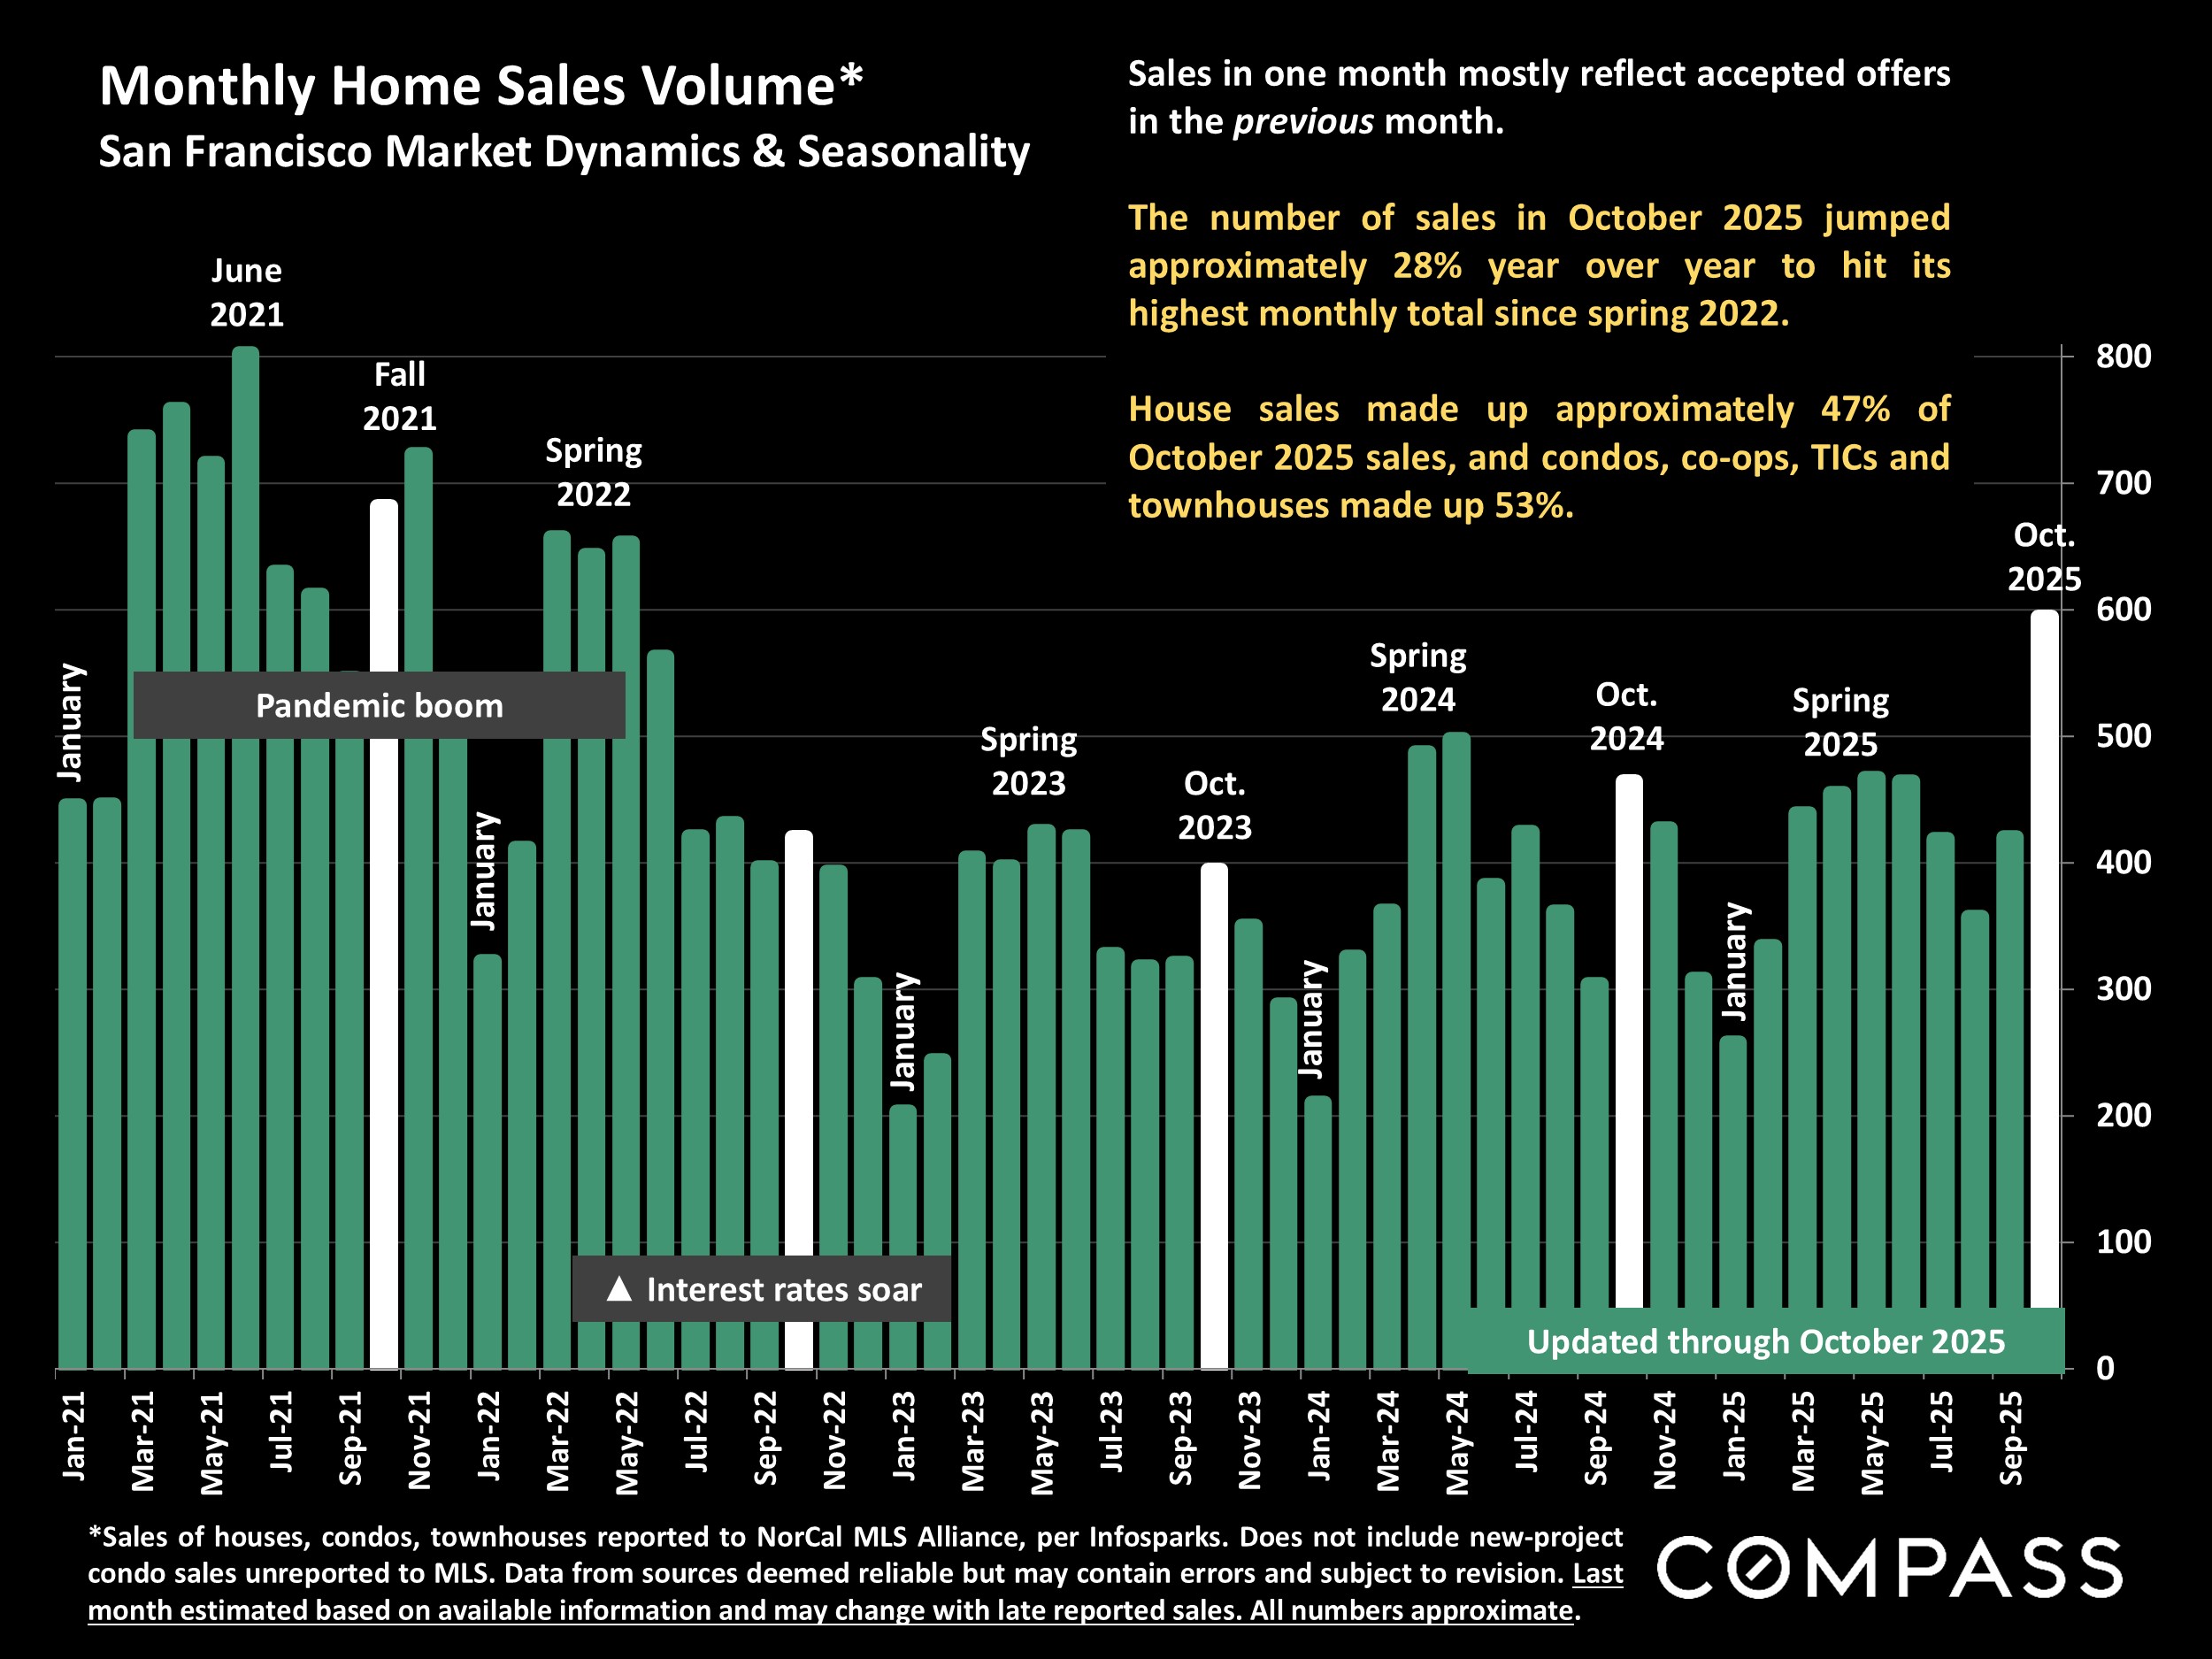
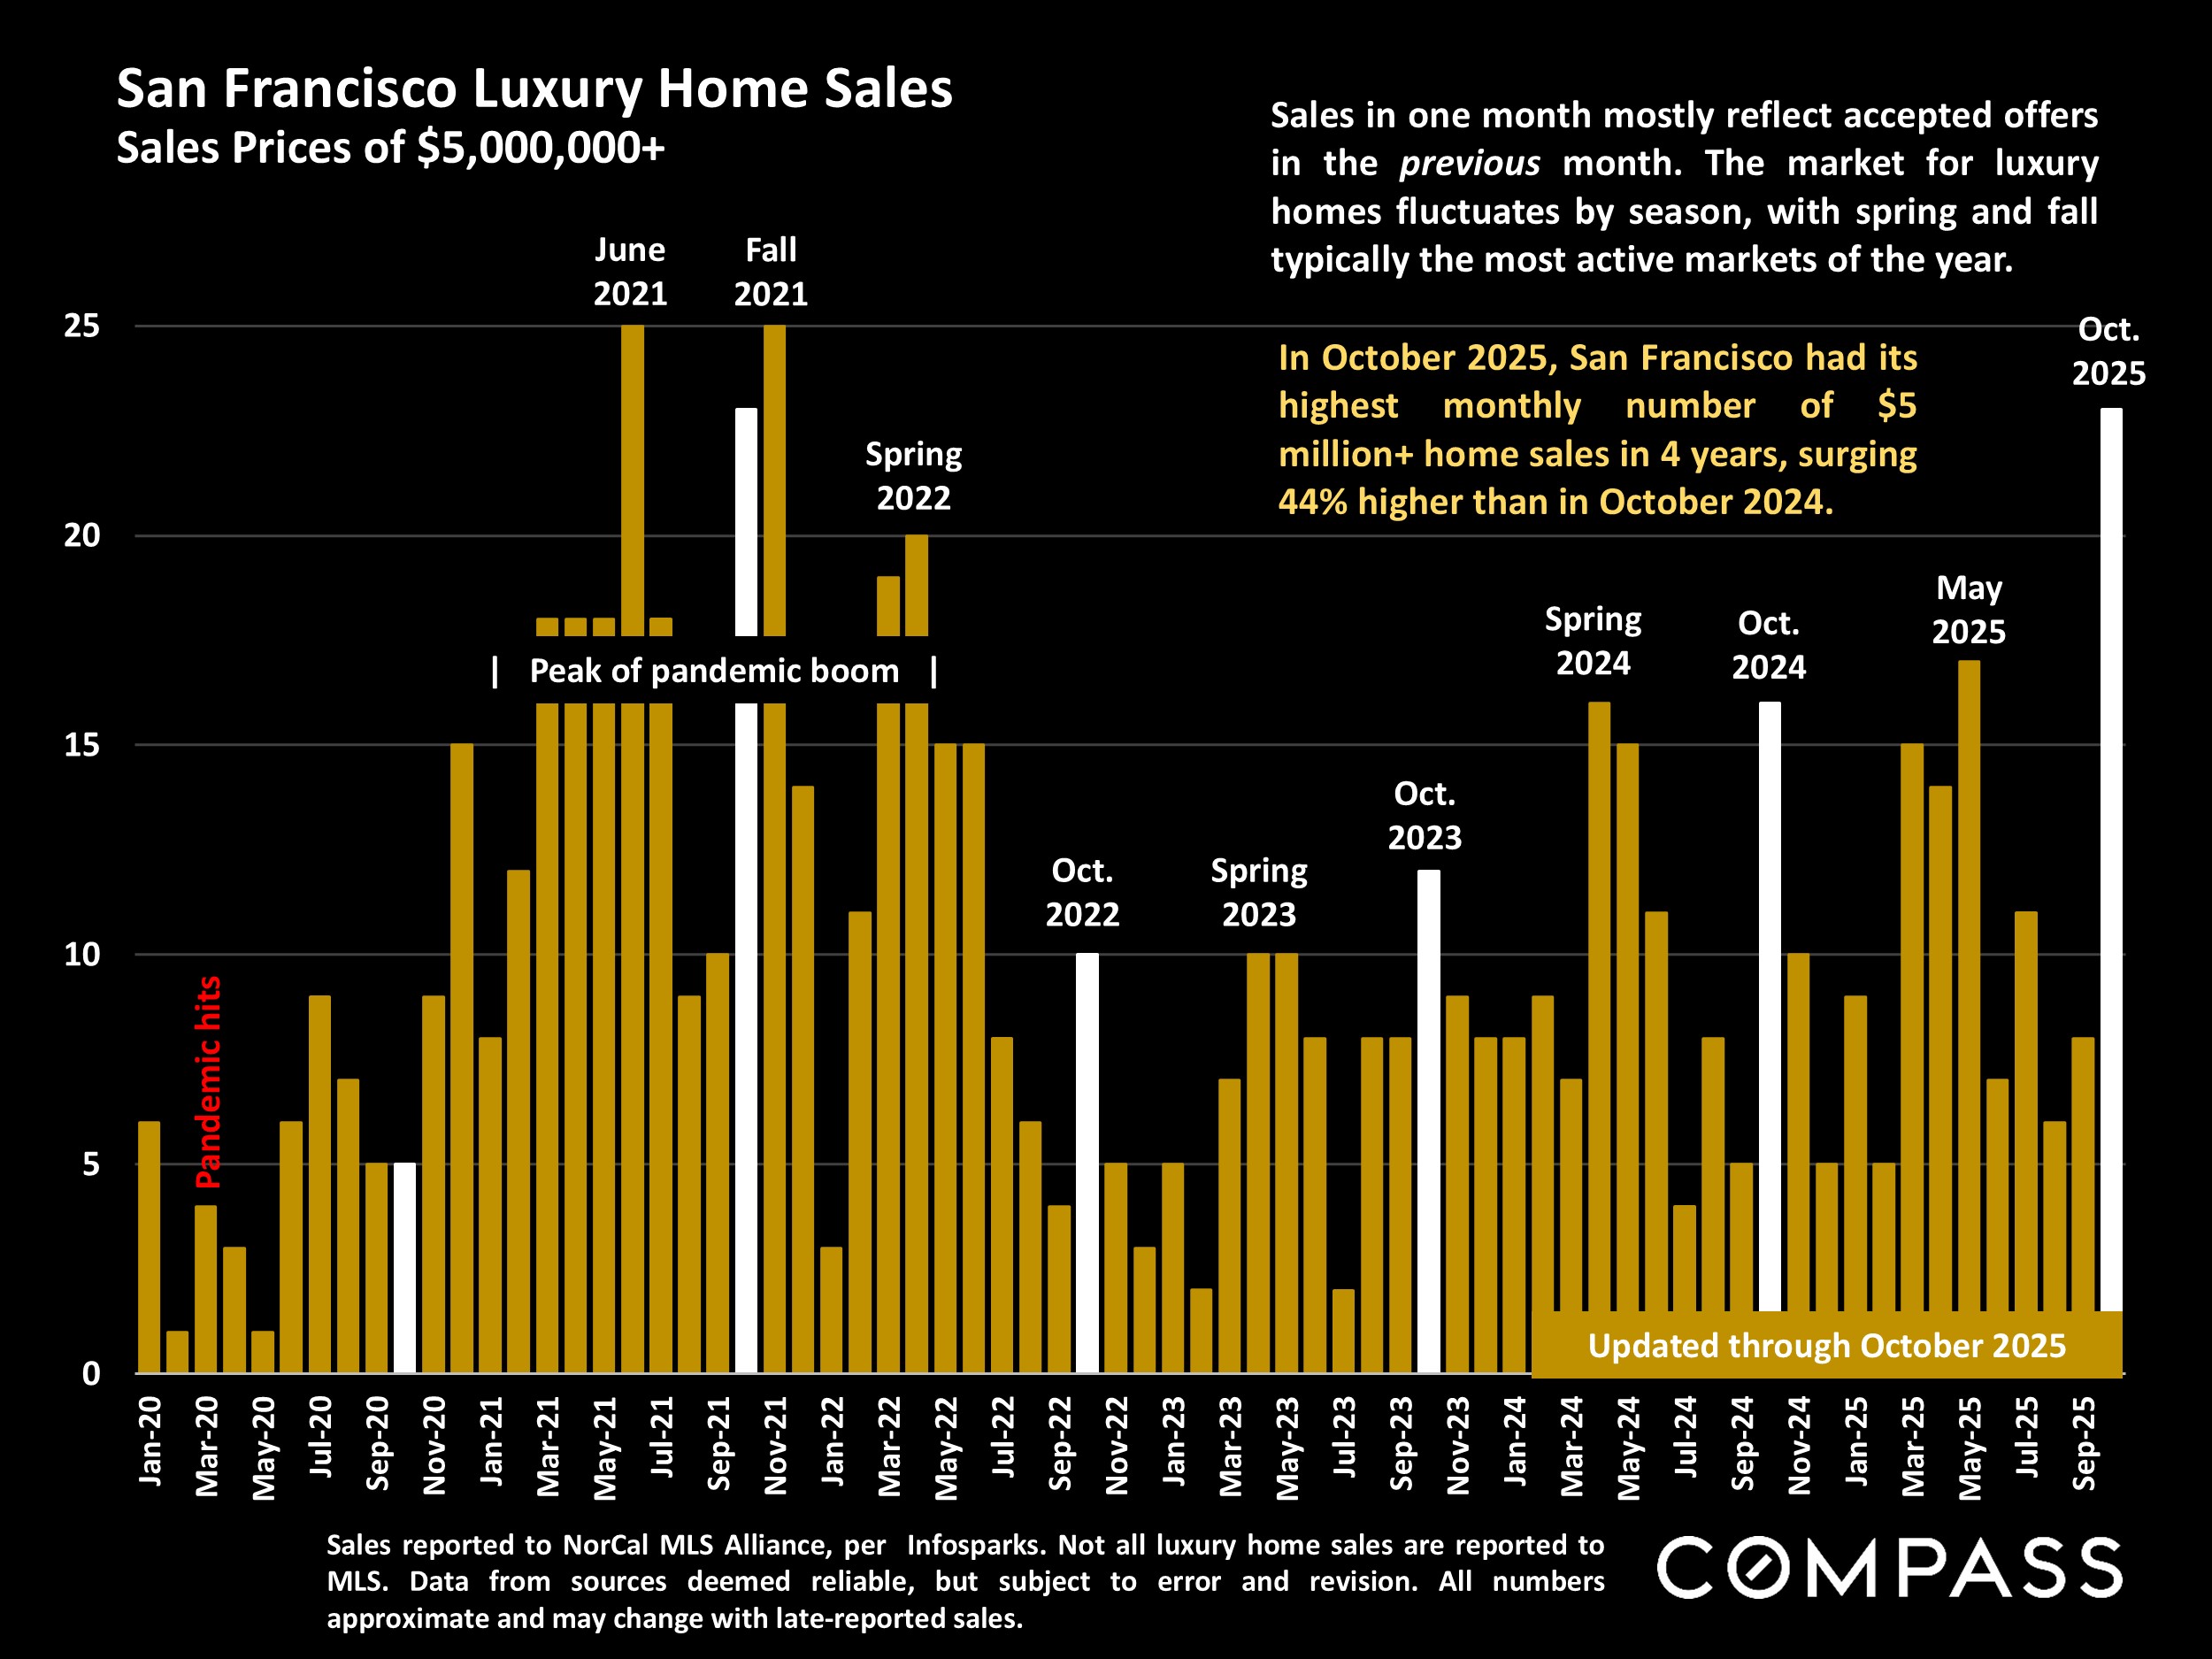
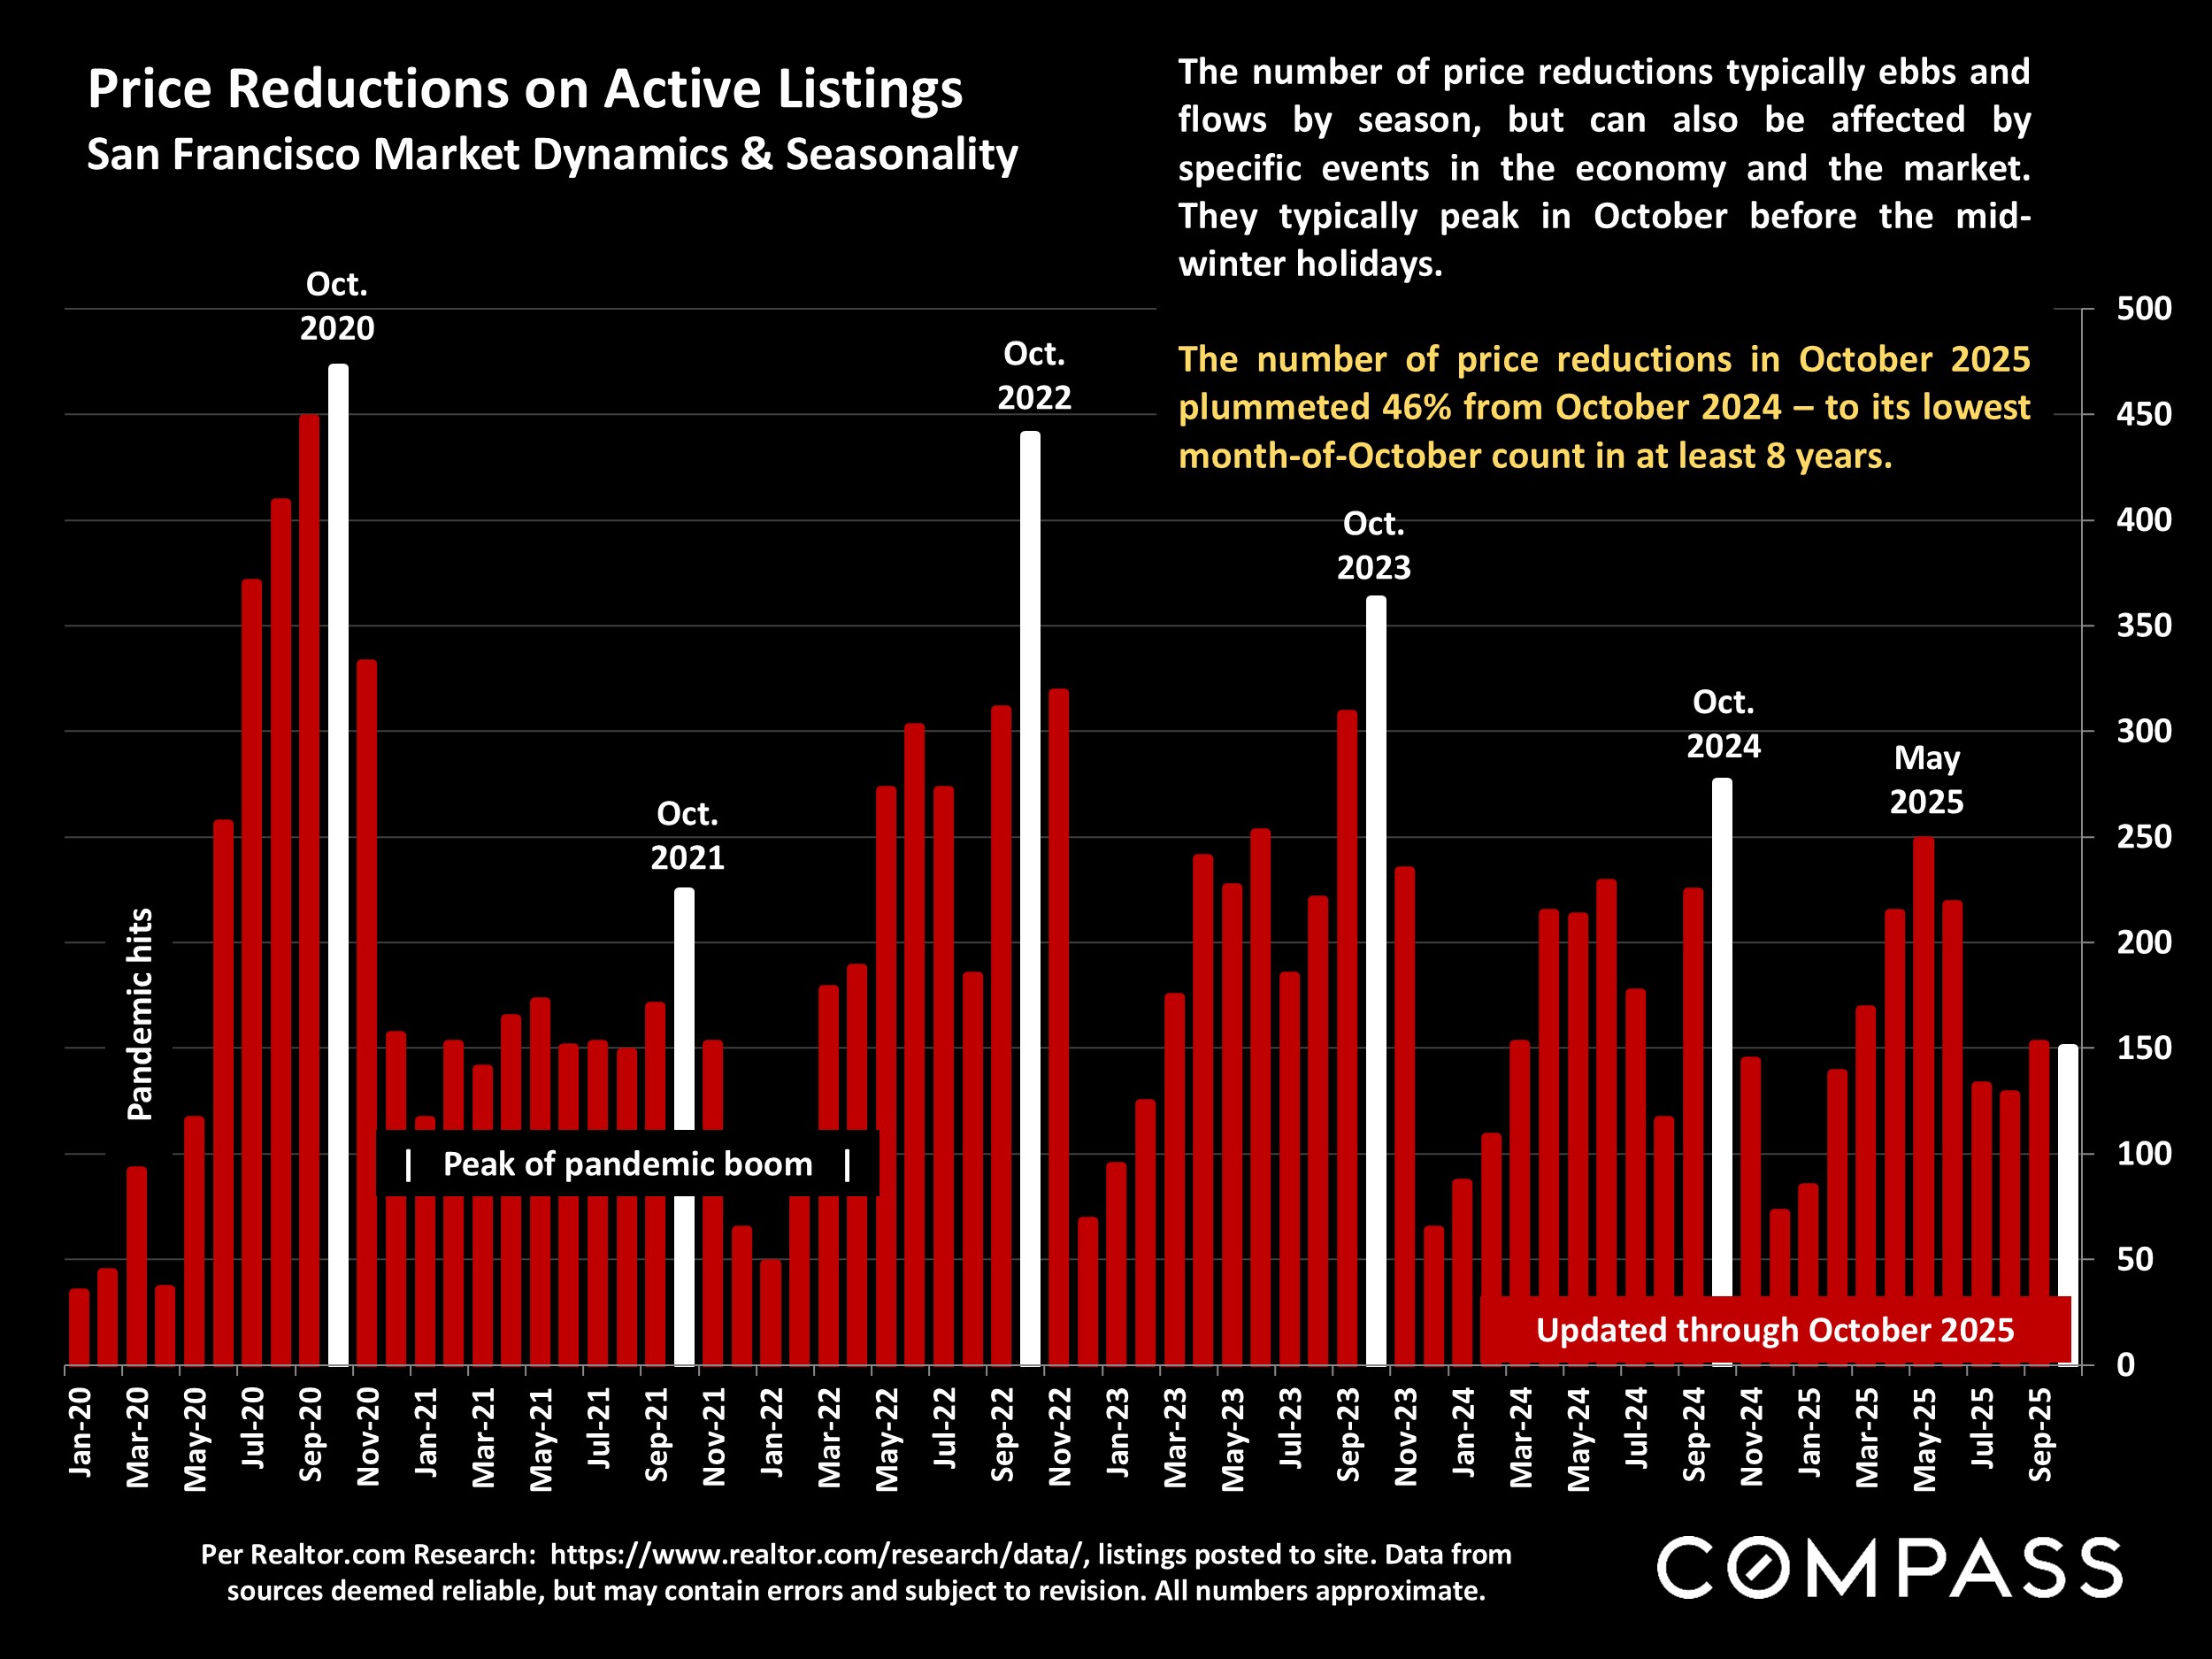
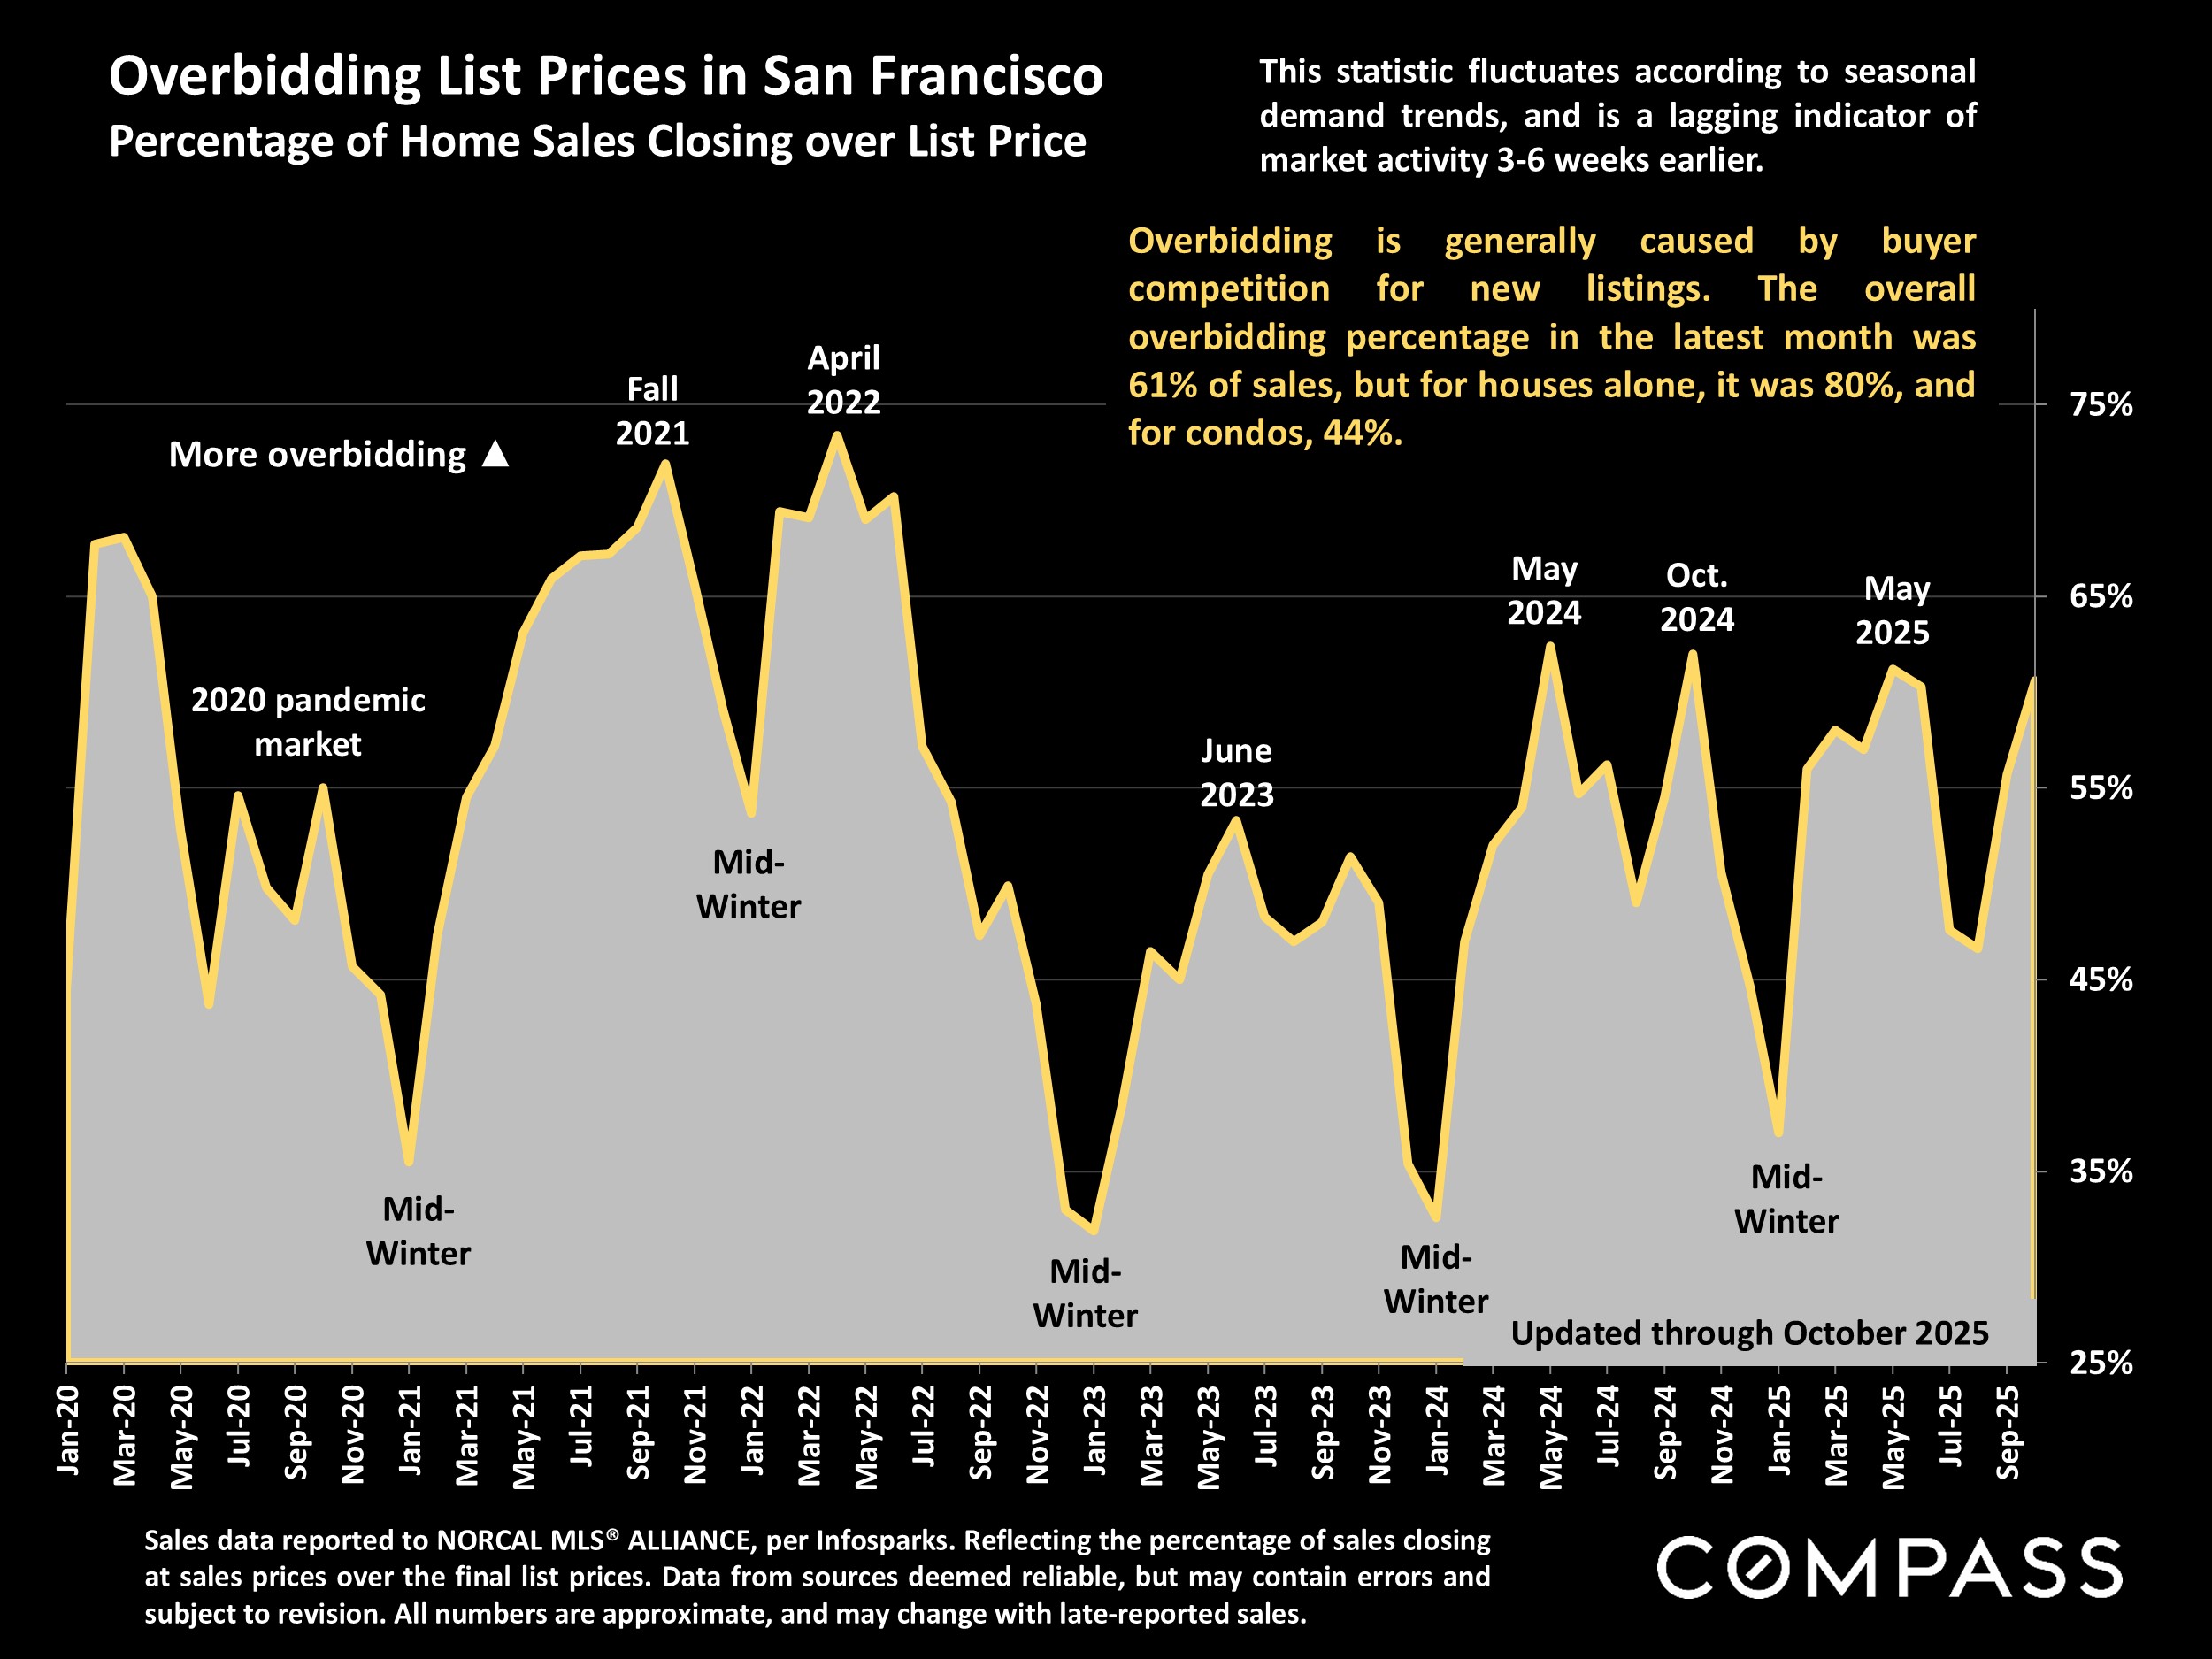
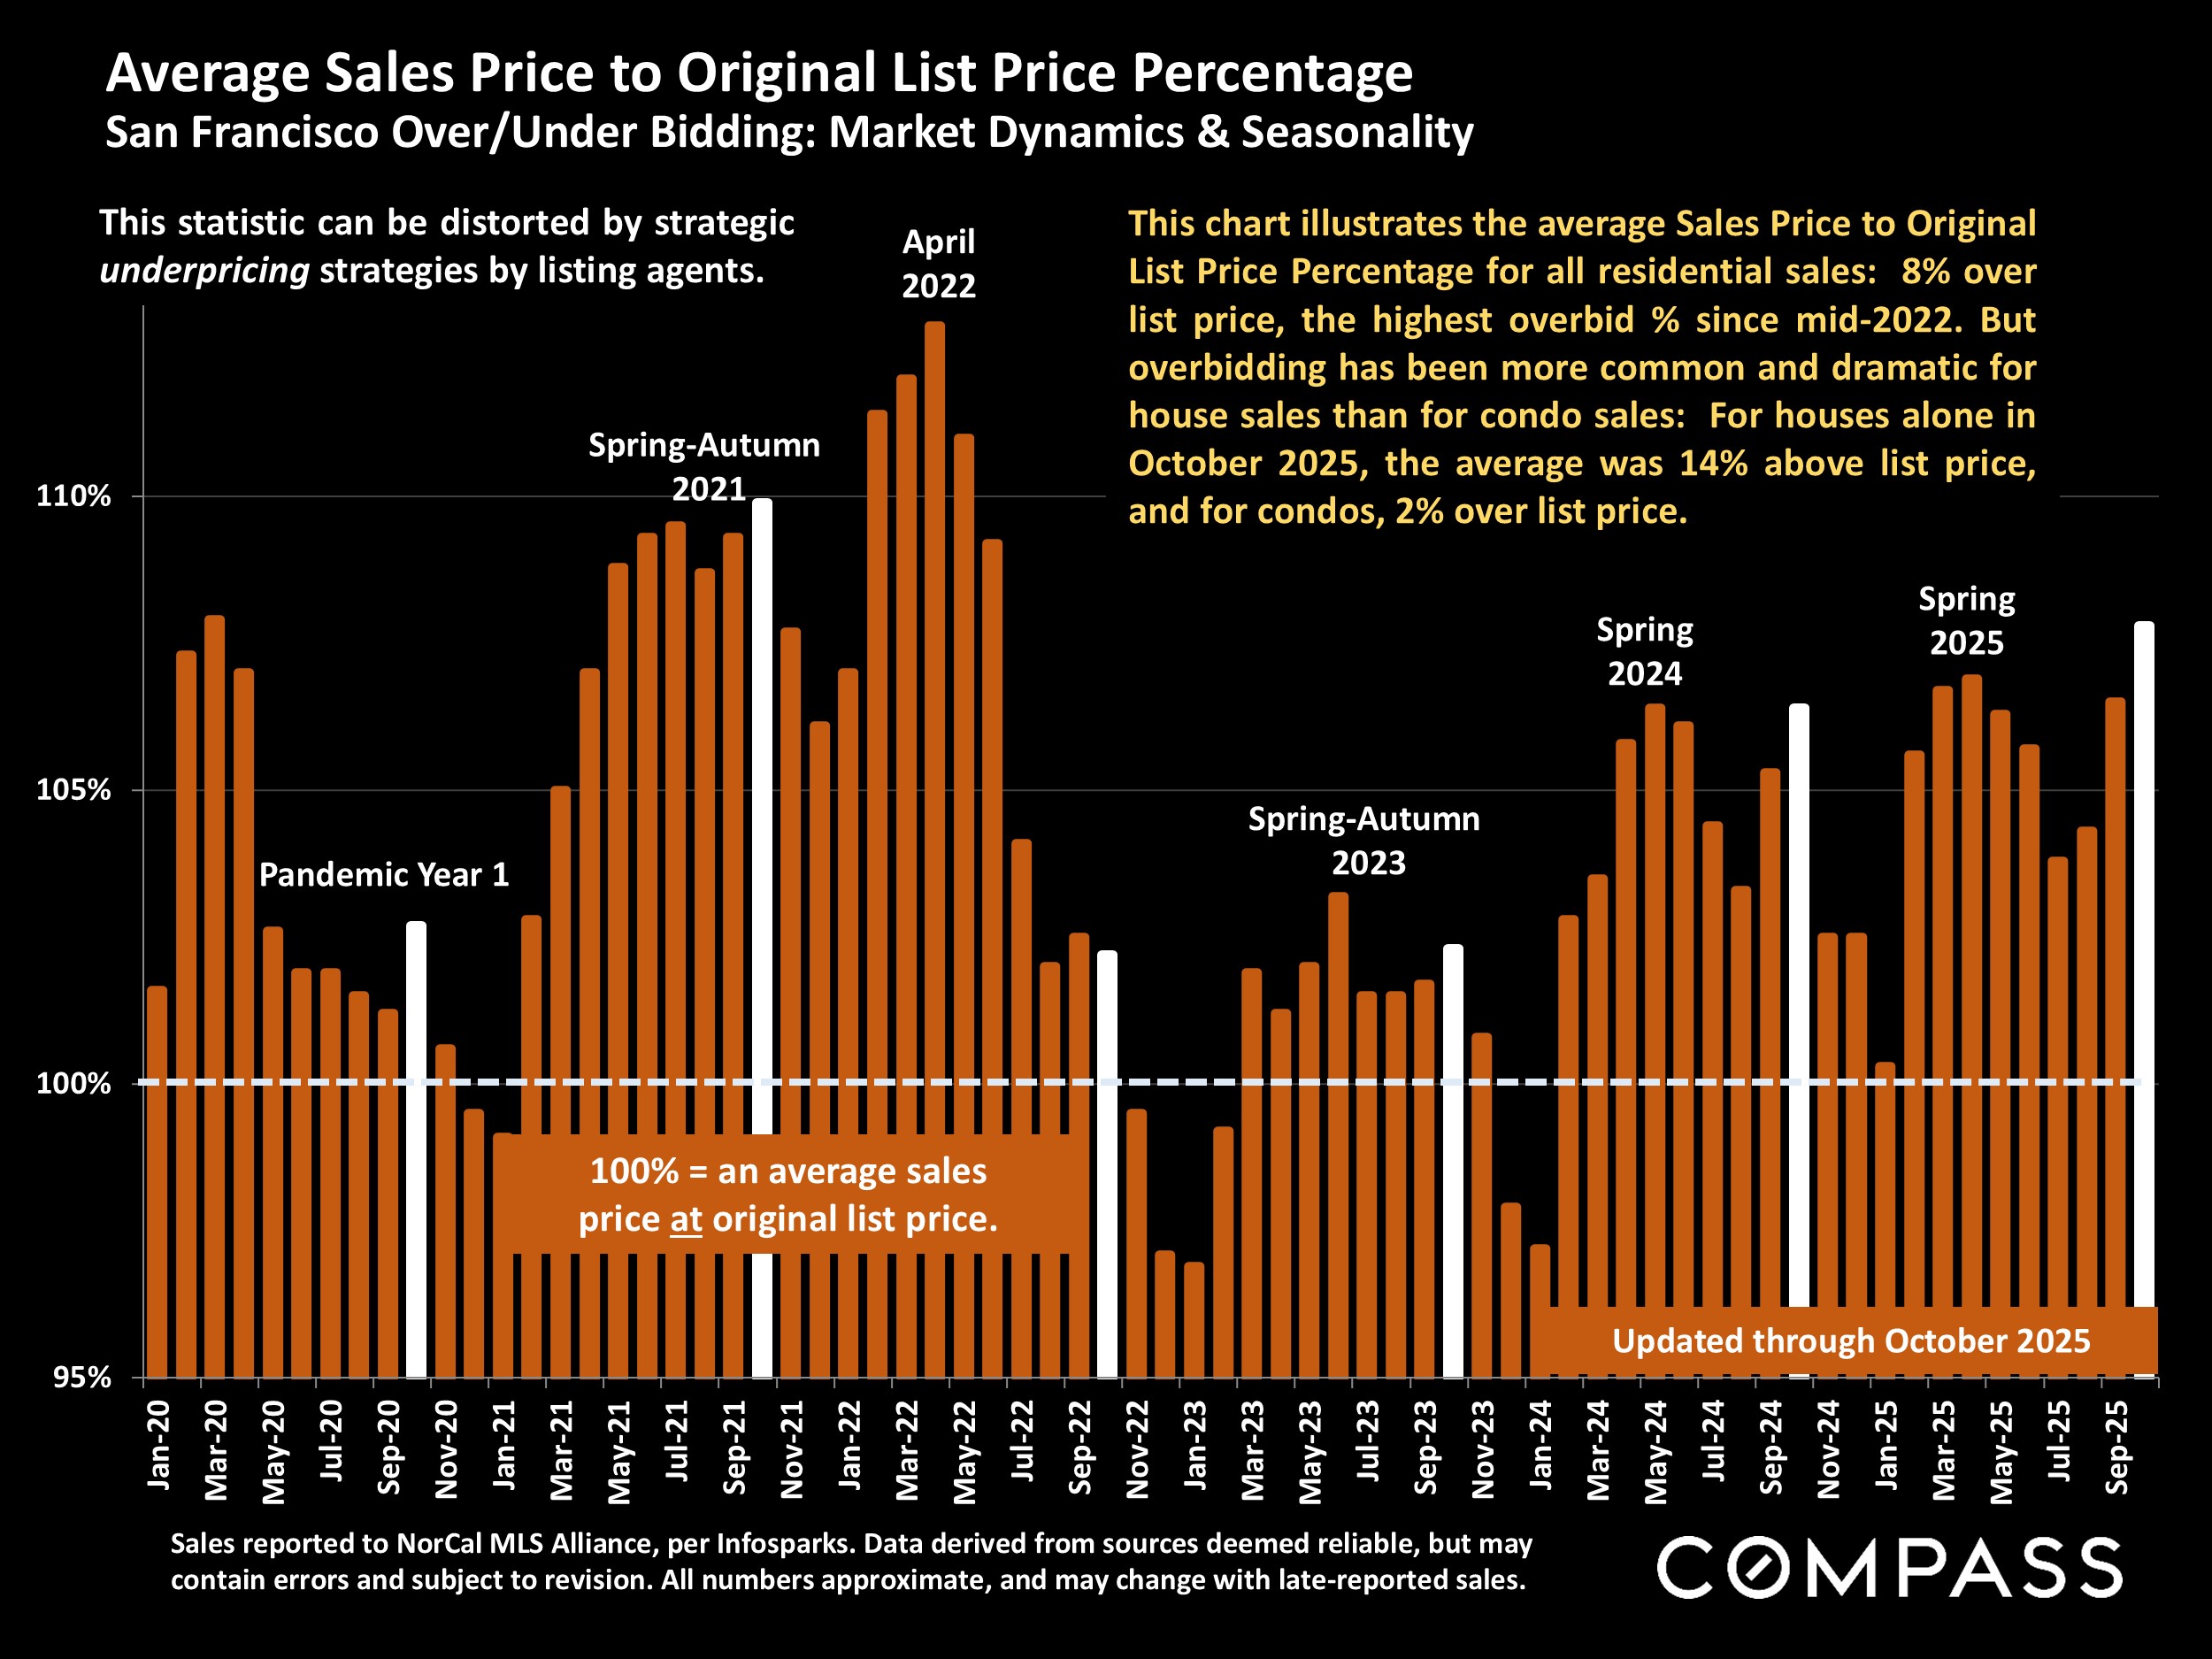
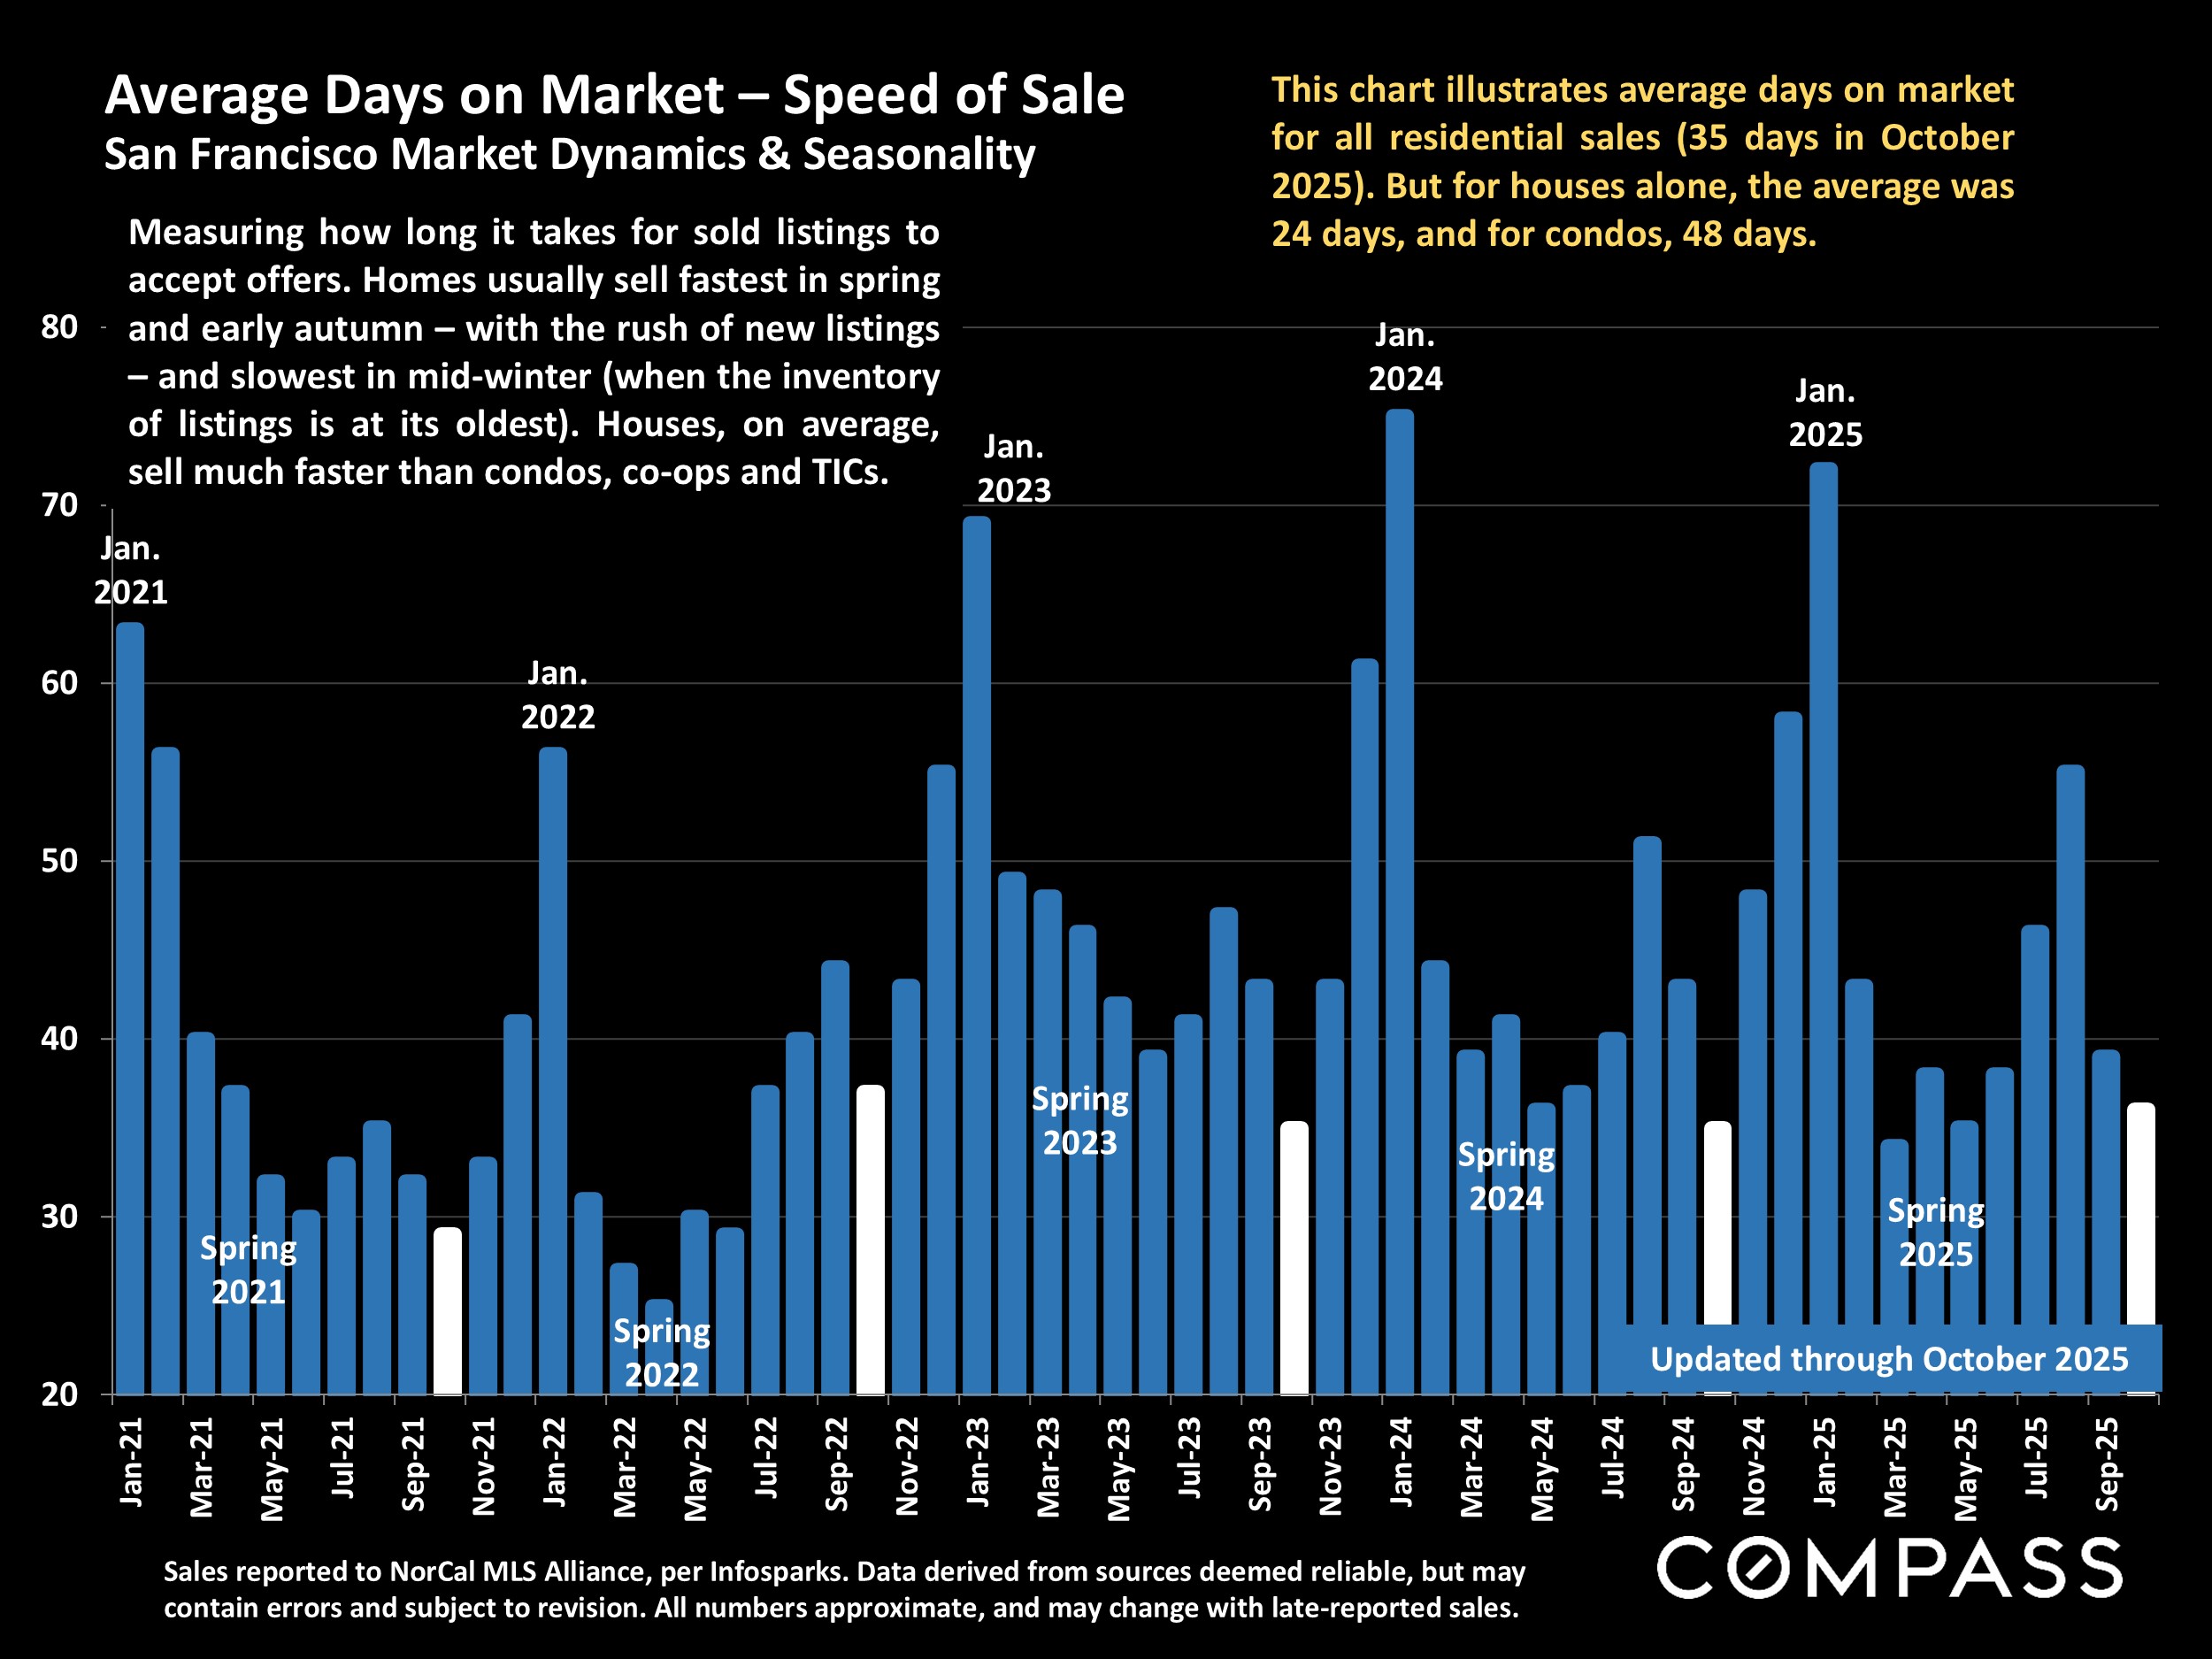
The San Francisco real estate market continues to rapidly accelerate due to the Al startup boom: October's sales hit the highest count since May 2022, while luxury home sales were the best in 4 years. The number of price reductions plummeted 46% on a year-over-year basis, while the pending ratio - a standard measure of market heat - hit its highest monthly reading since the peak of the pandemic boom. 80% of house sales and 44% of condo sales sold for over the list price. Virtually all the market indicators point to a dramatic increase in buyer demand competing for a declining number of listings.

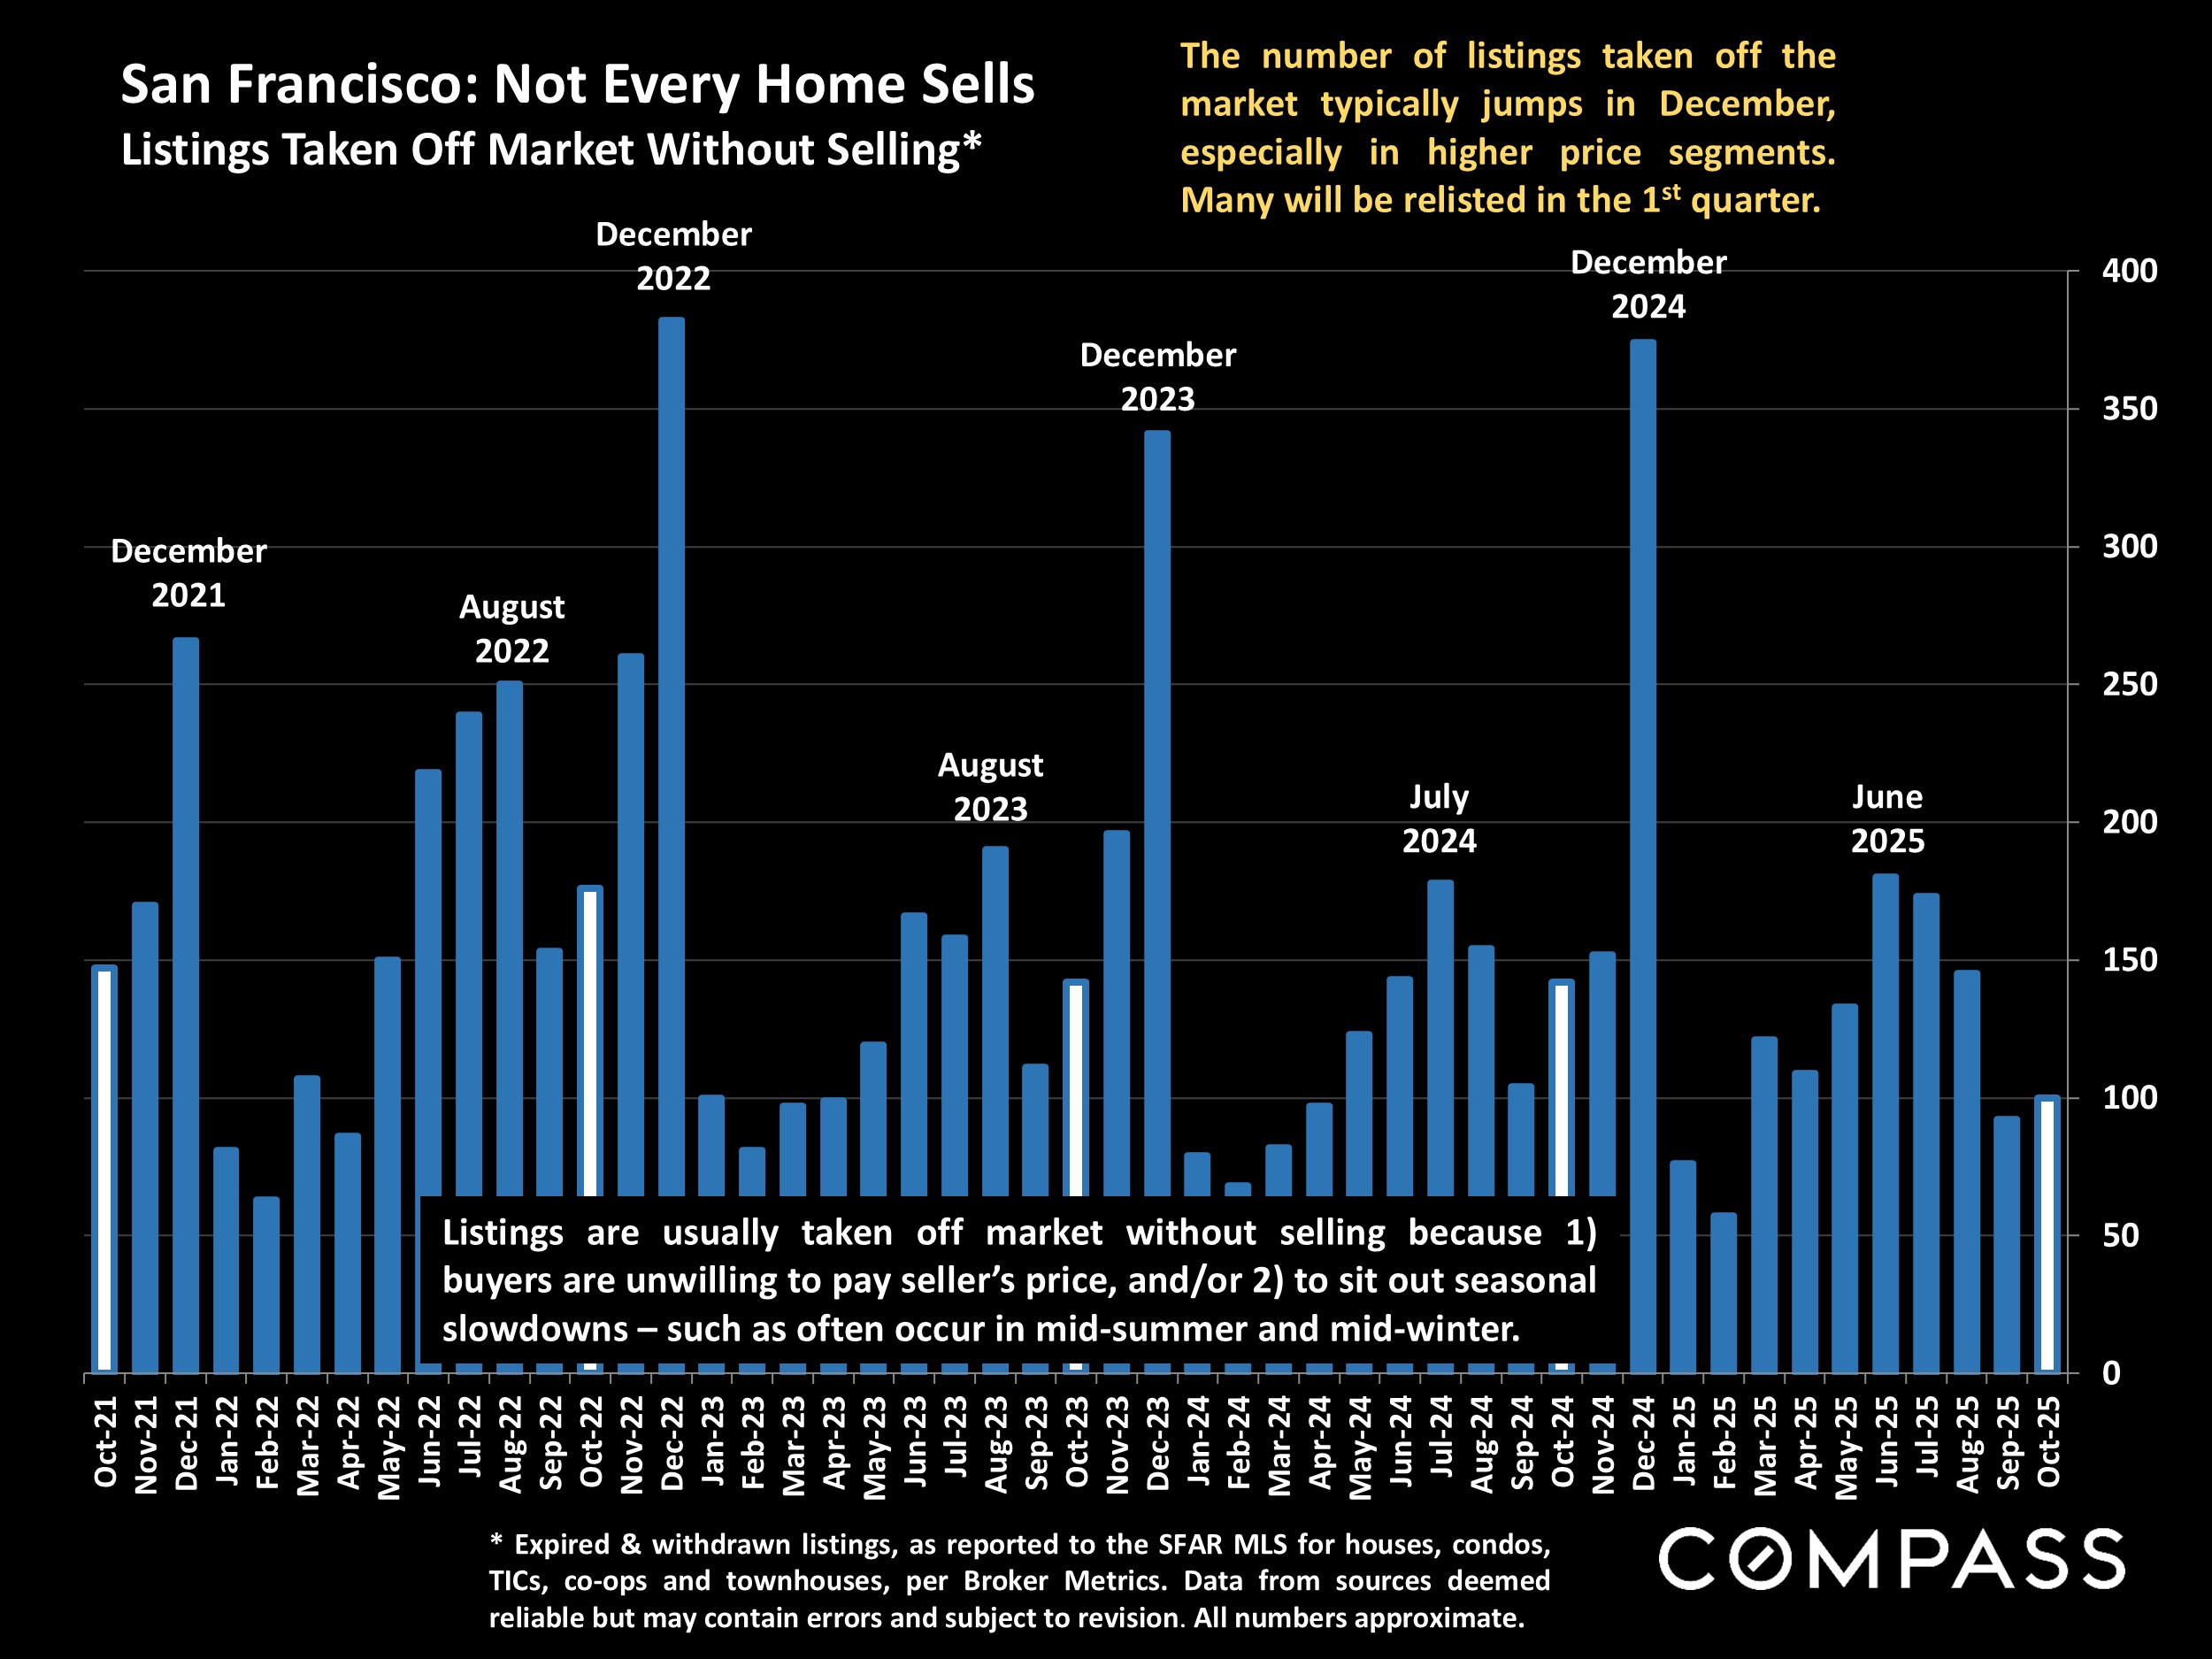
The market typically slows from mid-November to mid-January, though it's possible that this year will buck that trend. In any case, listing and sales activity continue in every month of the year - however, mid-winter is usually the period when buyers can negotiate most aggressively on unsold homes listed earlier in the year.

San Francisco HOUSE Price Trends since 1990 Monthly Median House Sales Prices, 3-Month RollingSan Francisco CONDO Price Trends since 2005 Median Condo Sales Price, 3-Month RollingSan Francisco Value Trends since 2005 3-Month-Rolling, Median Dollar per Square Foot Values*San Francisco CONDO Prices: Downtown vs. Non-Downtown 12-Month-Rolling, Median 2-Bedroom Condo Sales Prices since 2005*People Moving Within & Into San Francisco County Per U.S. Census, 5-Year ACS Data, Single Year Estimates*San Francisco Residential Market Comparative Market Dynamics by Price Segment/Property TypeNew Listings Coming on Market San Francisco Market Dynamics & Seasonality*San Francisco Homes Market Active & Coming-Soon Listings on 15t of Month*Pending Ratio San Francisco Market Dynamics & Seasonality*Listings Accepting Offers (Going into Contract) San Francisco Market Dynamics & SeasonalityMonthly Home Sales Volume* San Francisco Market Dynamics & SeasonalitySan Francisco Luxury Home Sales Sales Prices of $5,000,000+Bay Area Luxury Home Sales Volume vs. S&P 500 Index A Broad Illustration since September 2023*Bay Area House Sales, 2025 vs. 2023 Changes in Median Sales Values by Home Size*Price Reductions on Active Listings San Francisco Market Dynamics & SeasonalitySan Francisco: Not Every Home Sells Listings Taken Off Market Without Selling*Overbidding List Prices in San Francisco Percentage of Home Sales Closing over List PriceAverage Sales Price to Original List Price Percentage San Francisco Over/Under Bidding: Market Dynamics & SeasonalityAverage Days on Market - Speed of Sale San Francisco Market Dynamics & SeasonalityPercentage of Buyers Having Difficulties Obtaining Insurance State of California, 2025 vs. 2023, by Property Location*Average Annual Home Insurance Cost for $300,000 in Coverage Comparative Costs in Selected States, per Bankrate, September 2025*Share of Sales in Which Buyers Paid All Cash National Home Sales in Selected Price Segments*Median First-Mortgage Interest Rate, Q2 of Each Year Financial Characteristics, Buyers Financing Purchase, California Real Estate Market*Years of Homeownership before Selling California Real Estate Market since 2000*Percentage of Homes Purchased by International Buyers California Real Estate Market since 2008*Mortgage Interest Rates in 2023-2025 TD 30-Year Conforming Fixed-Rate Loans, Weekly Average Readings*Bay Area Home Sales Volume vs. 30-Year Mortgage Interest Rate A General Illustration since 2016Inflation: Consumer Price Index (CPI), 2021 - 2025 YTD* Year-over-Year Percentage Change, by MonthFederal Funds Interest Rate since 1981 & Economic Interventions by Federal Reserve Bank*Nasdaq Composite Index Since January 1995Economic Policy Uncertainty Index* By Month since January 2000

Want to learn more about Bay Area market trends?

Let’s connect! With relationships and networks across the city, there are a variety of ways I can help you make informed real estate decisions. Call, email, or text – I’m here to help.


Contact