
May 12, 2025
SF: May 2025 Market Stats
By Compass
Economic Volatility Injects Uncertainty into Spring Market, But San Francisco's House Market Remains Surprisingly Strong
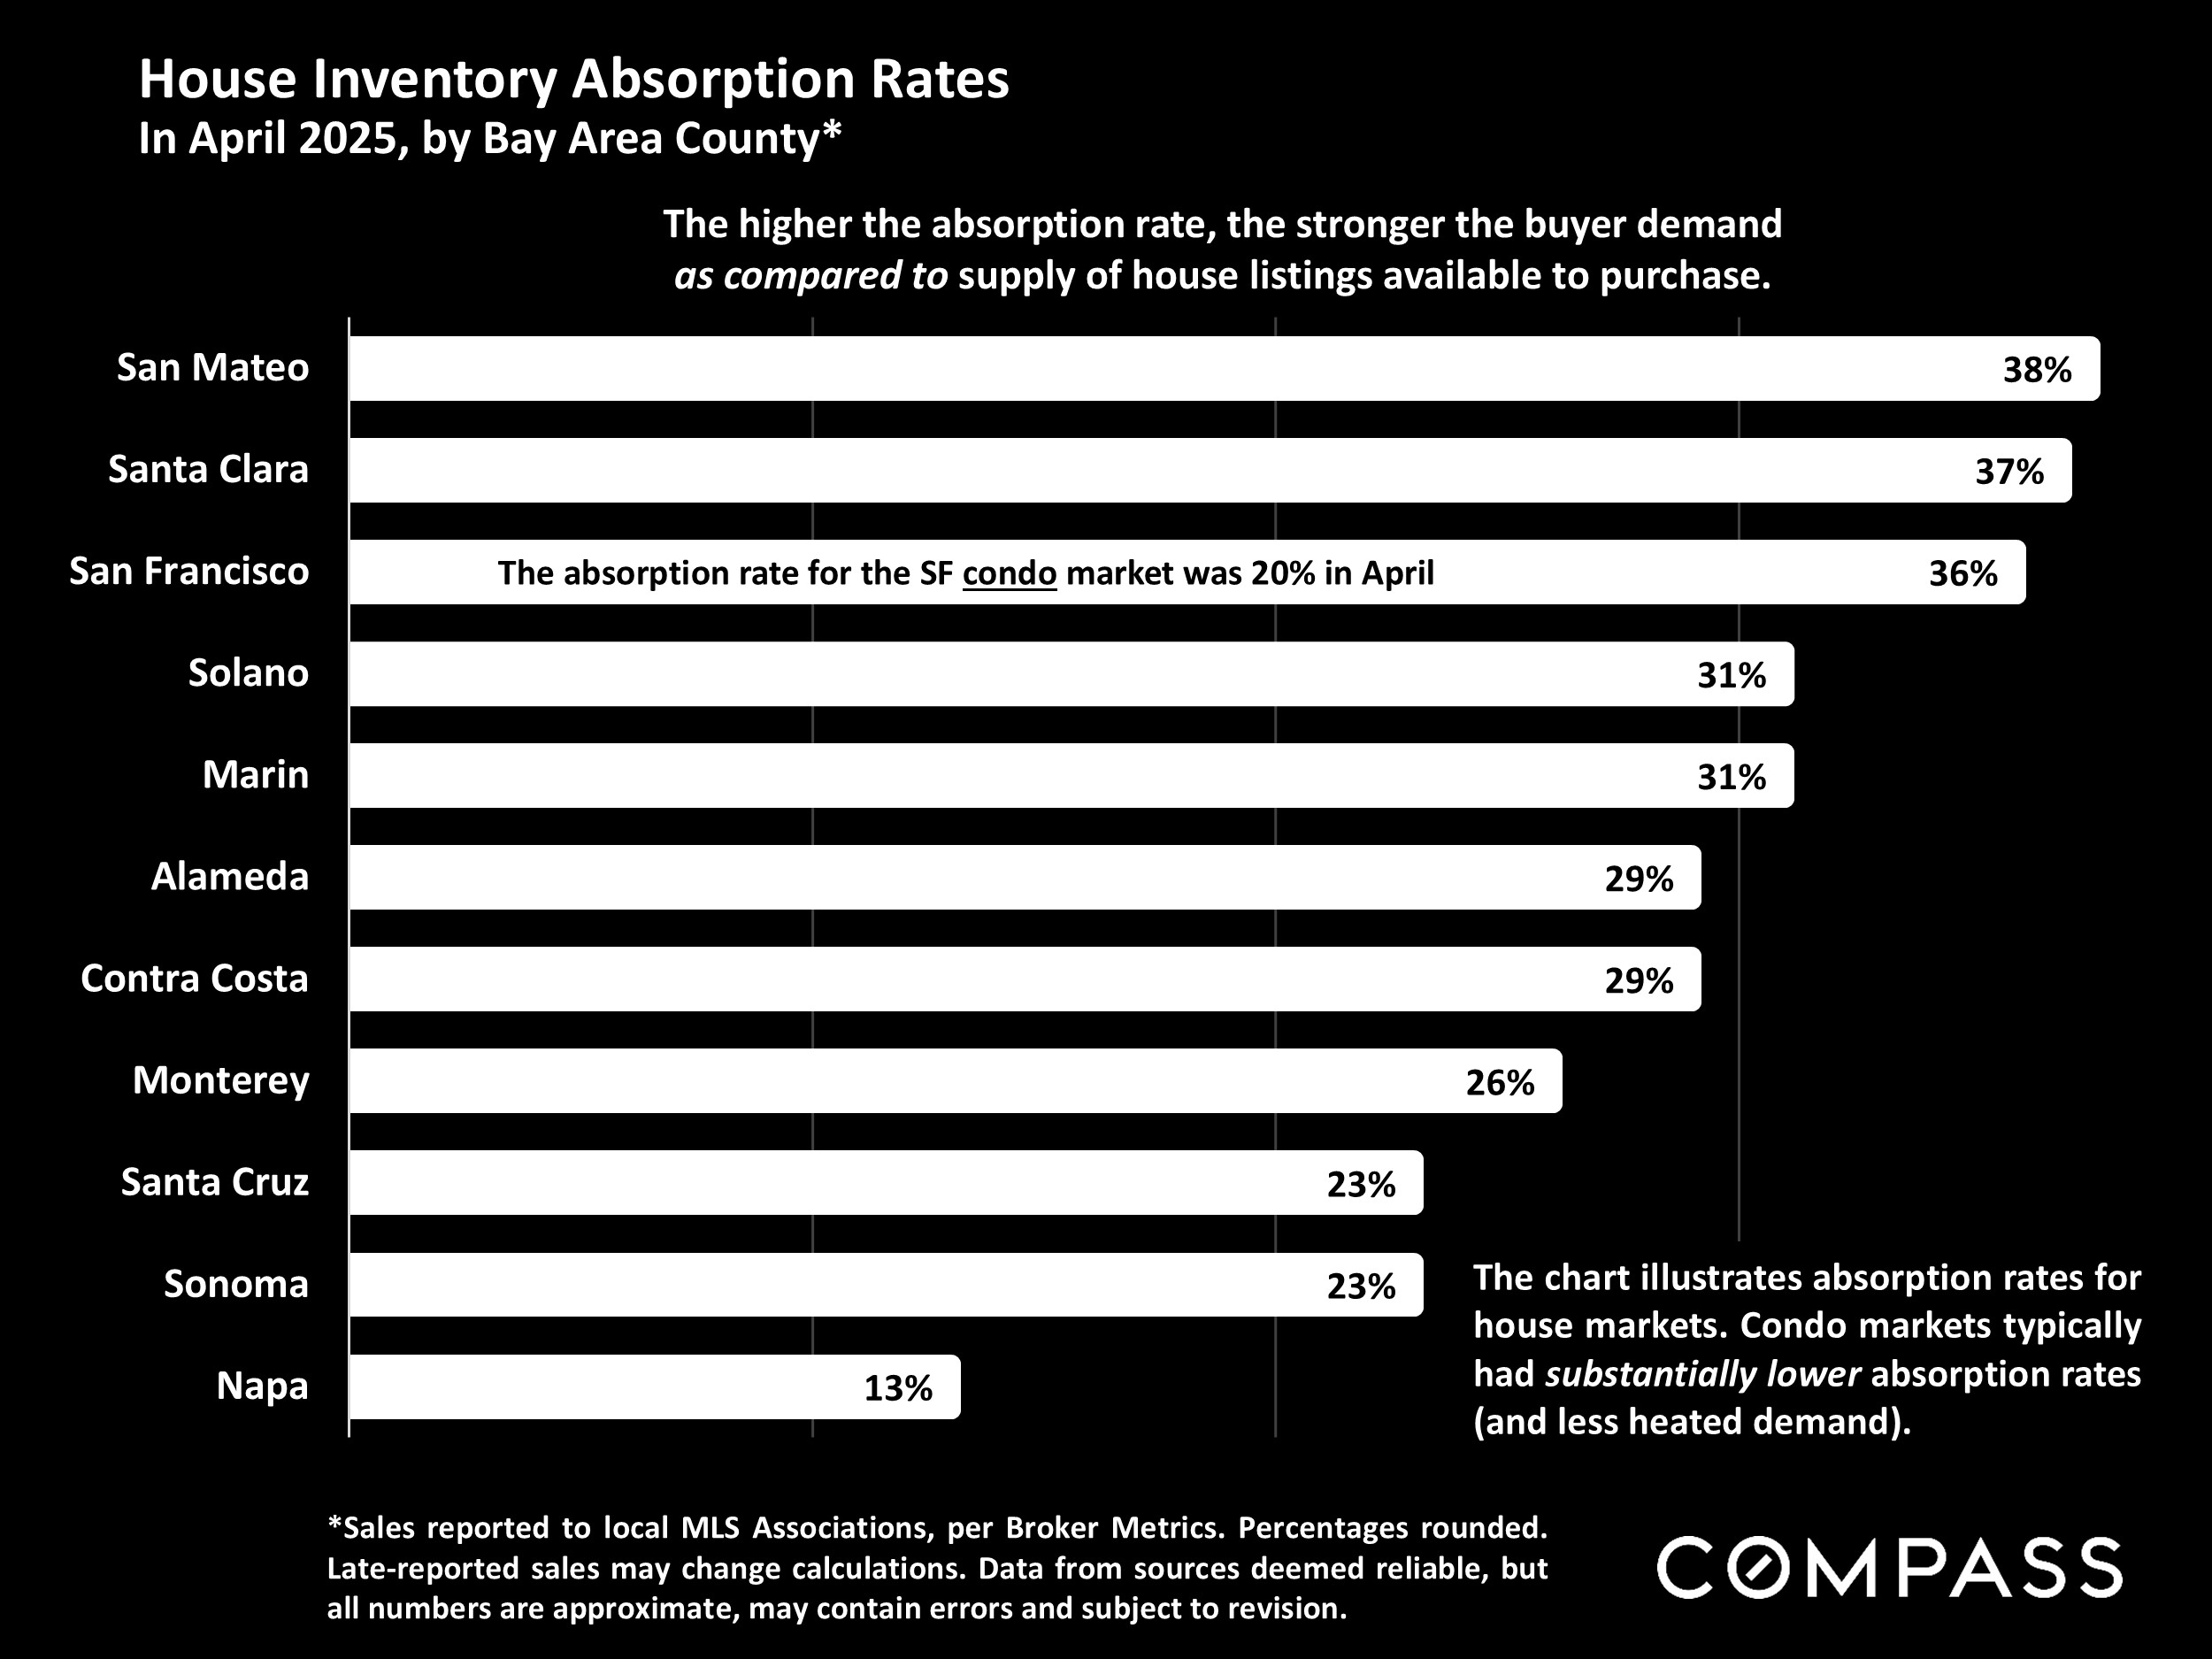
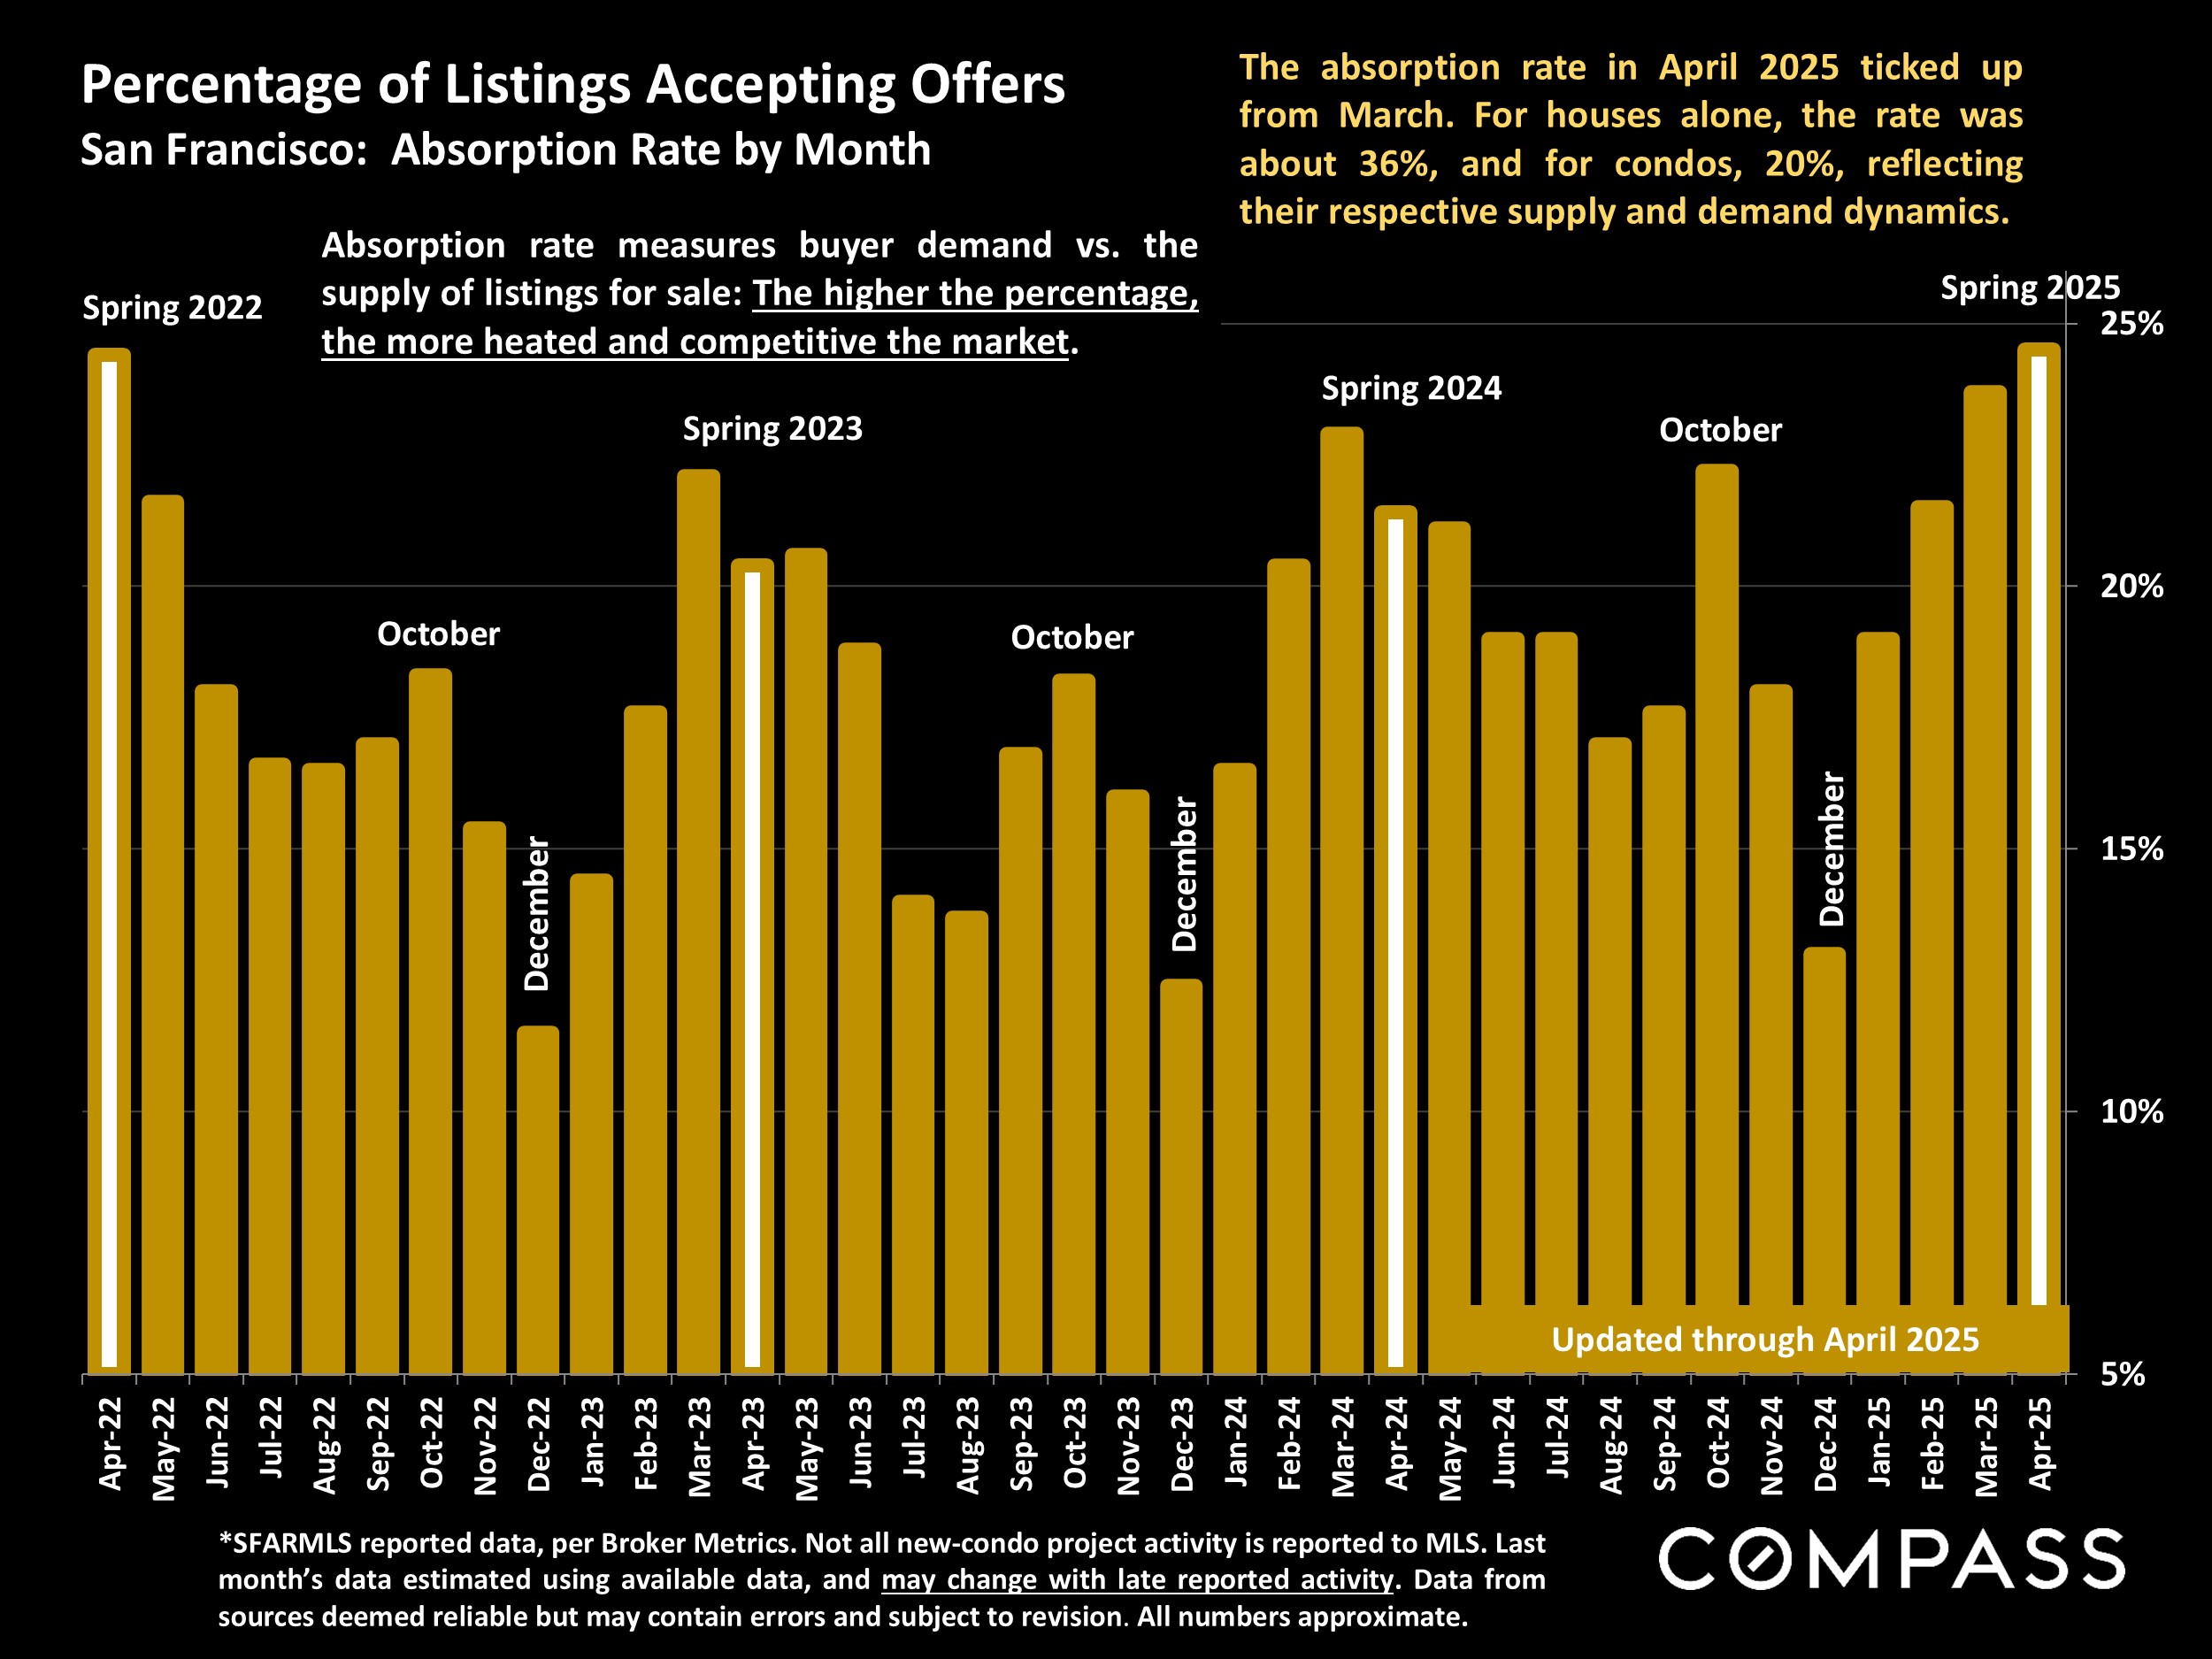
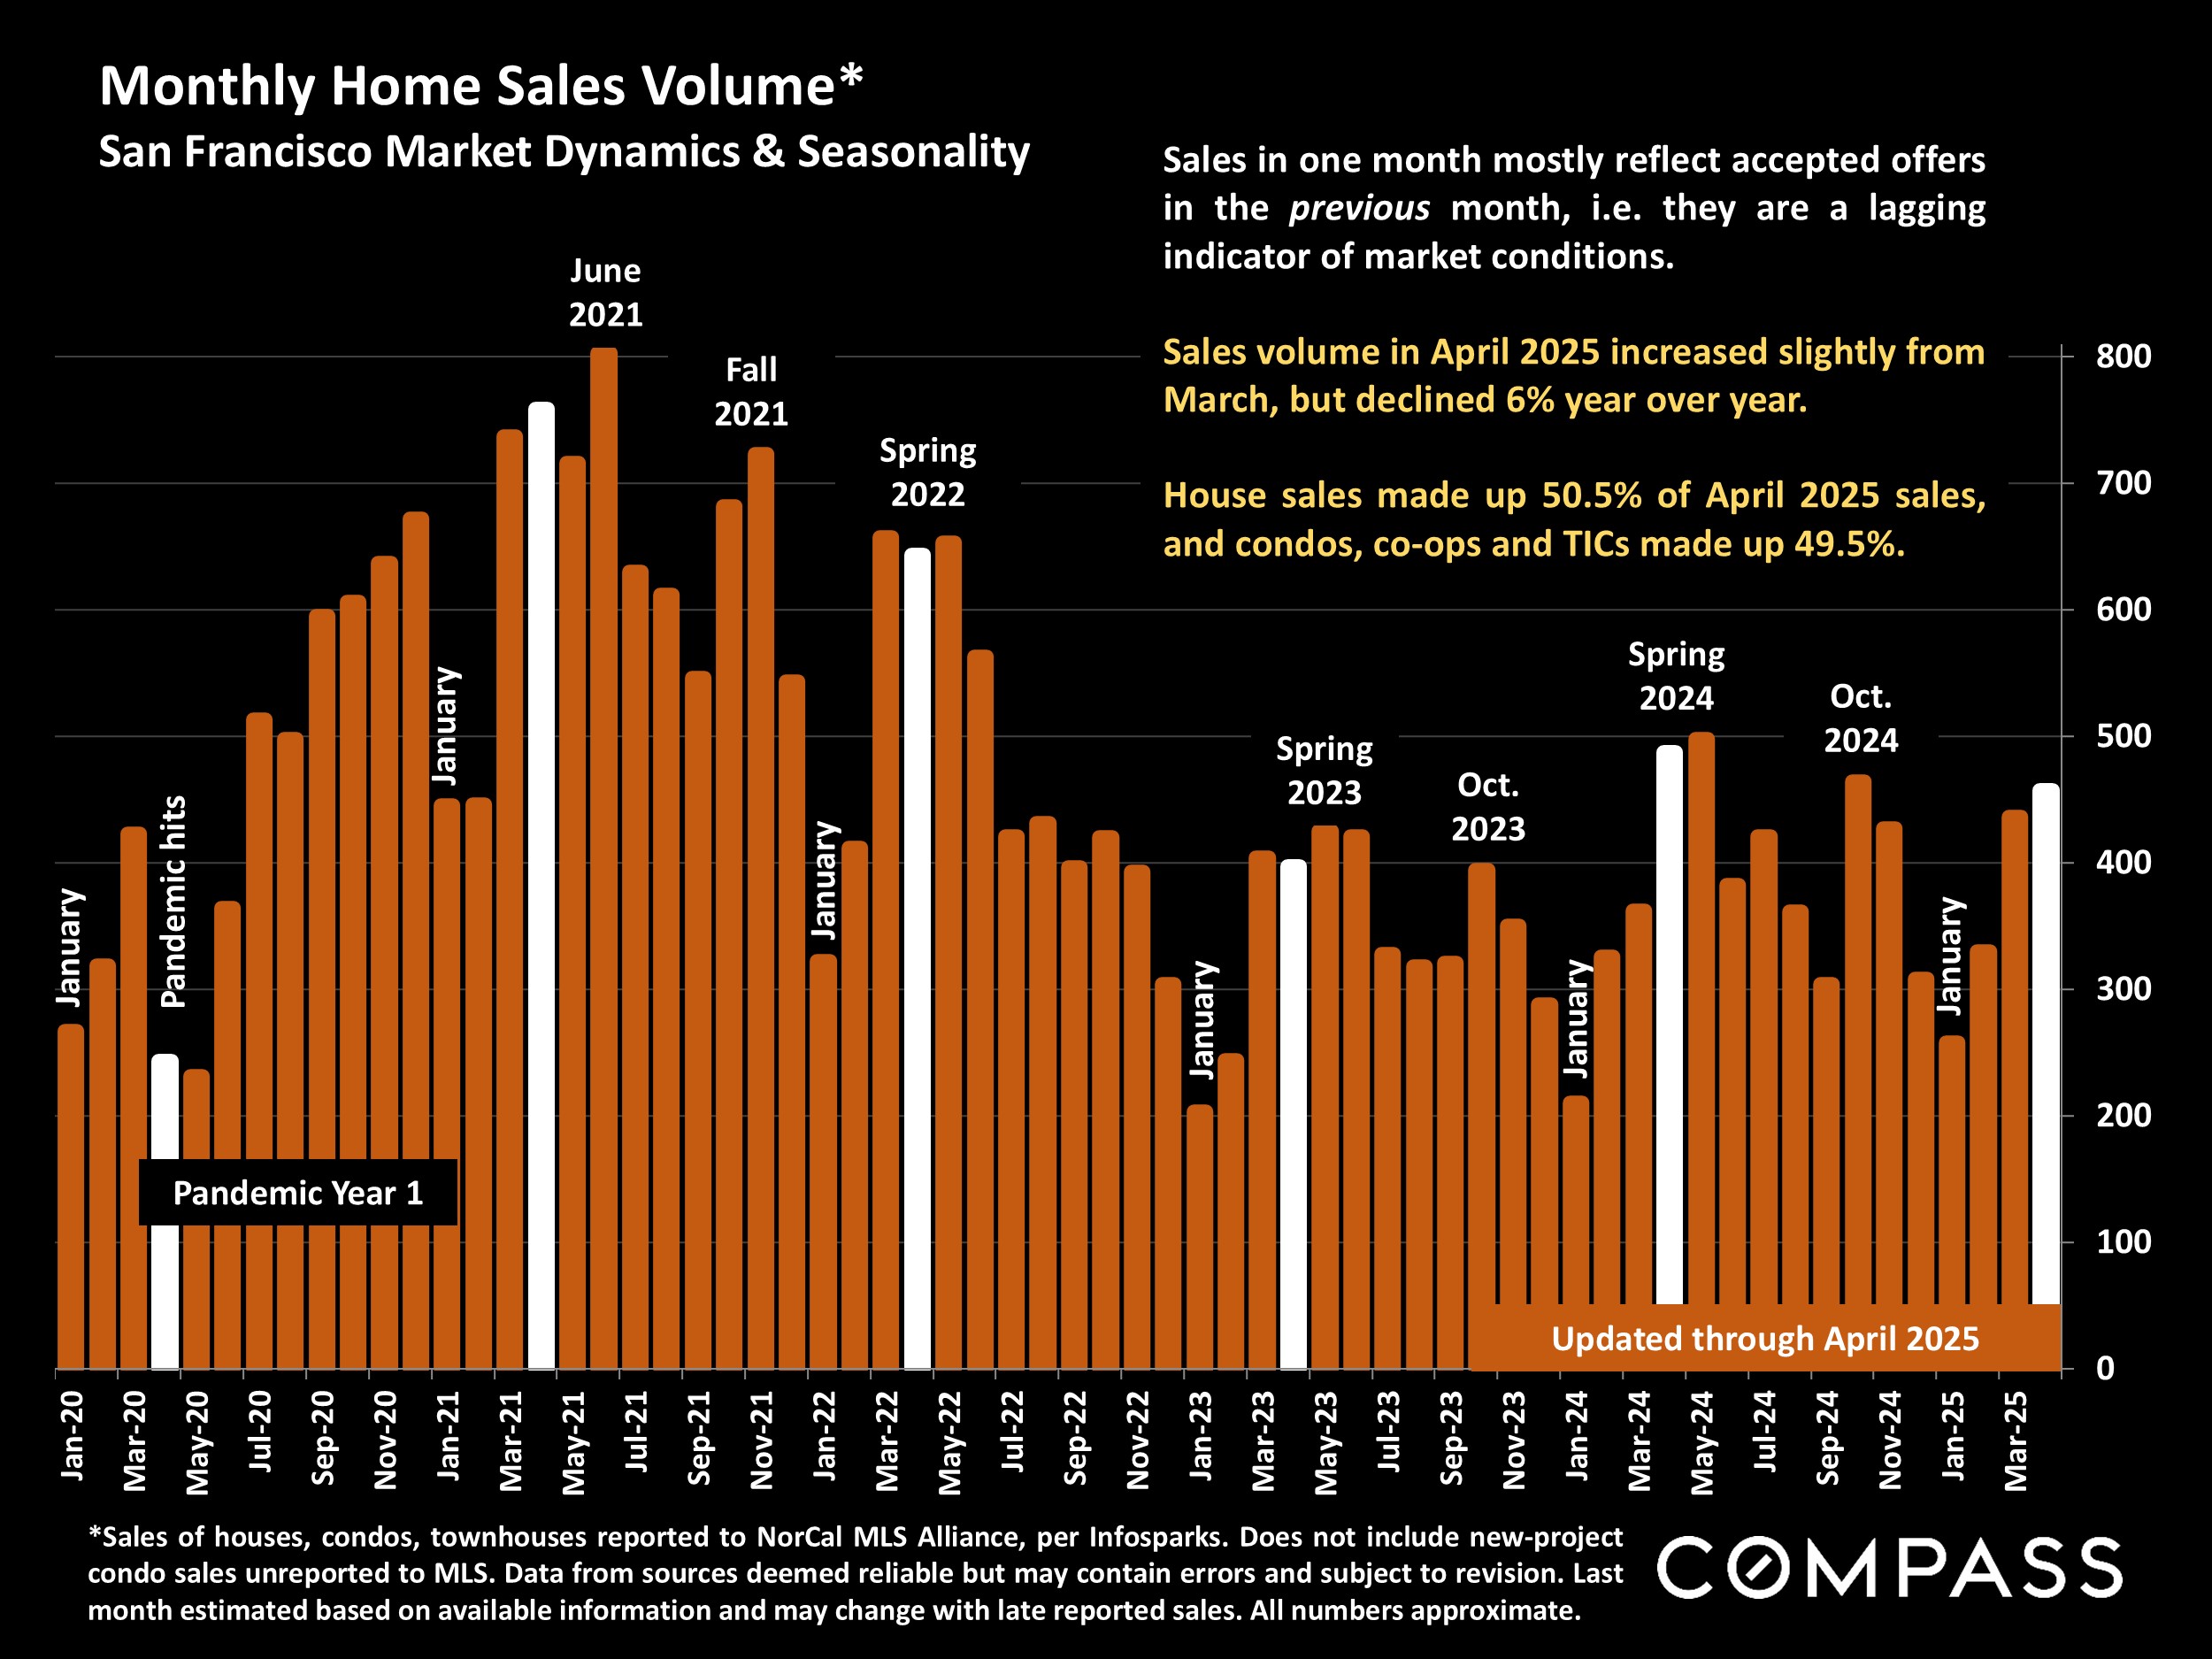
While most of the Bay Area saw significant shifts to more uncertain and uneven markets in April, the SF house market remained characterized by robust demand, though its condo market remained much softer. However, there were indications of increased hesitancy among some buyers as they tried to come to terms with new economic uncertainties, both personal and macroeconomic.
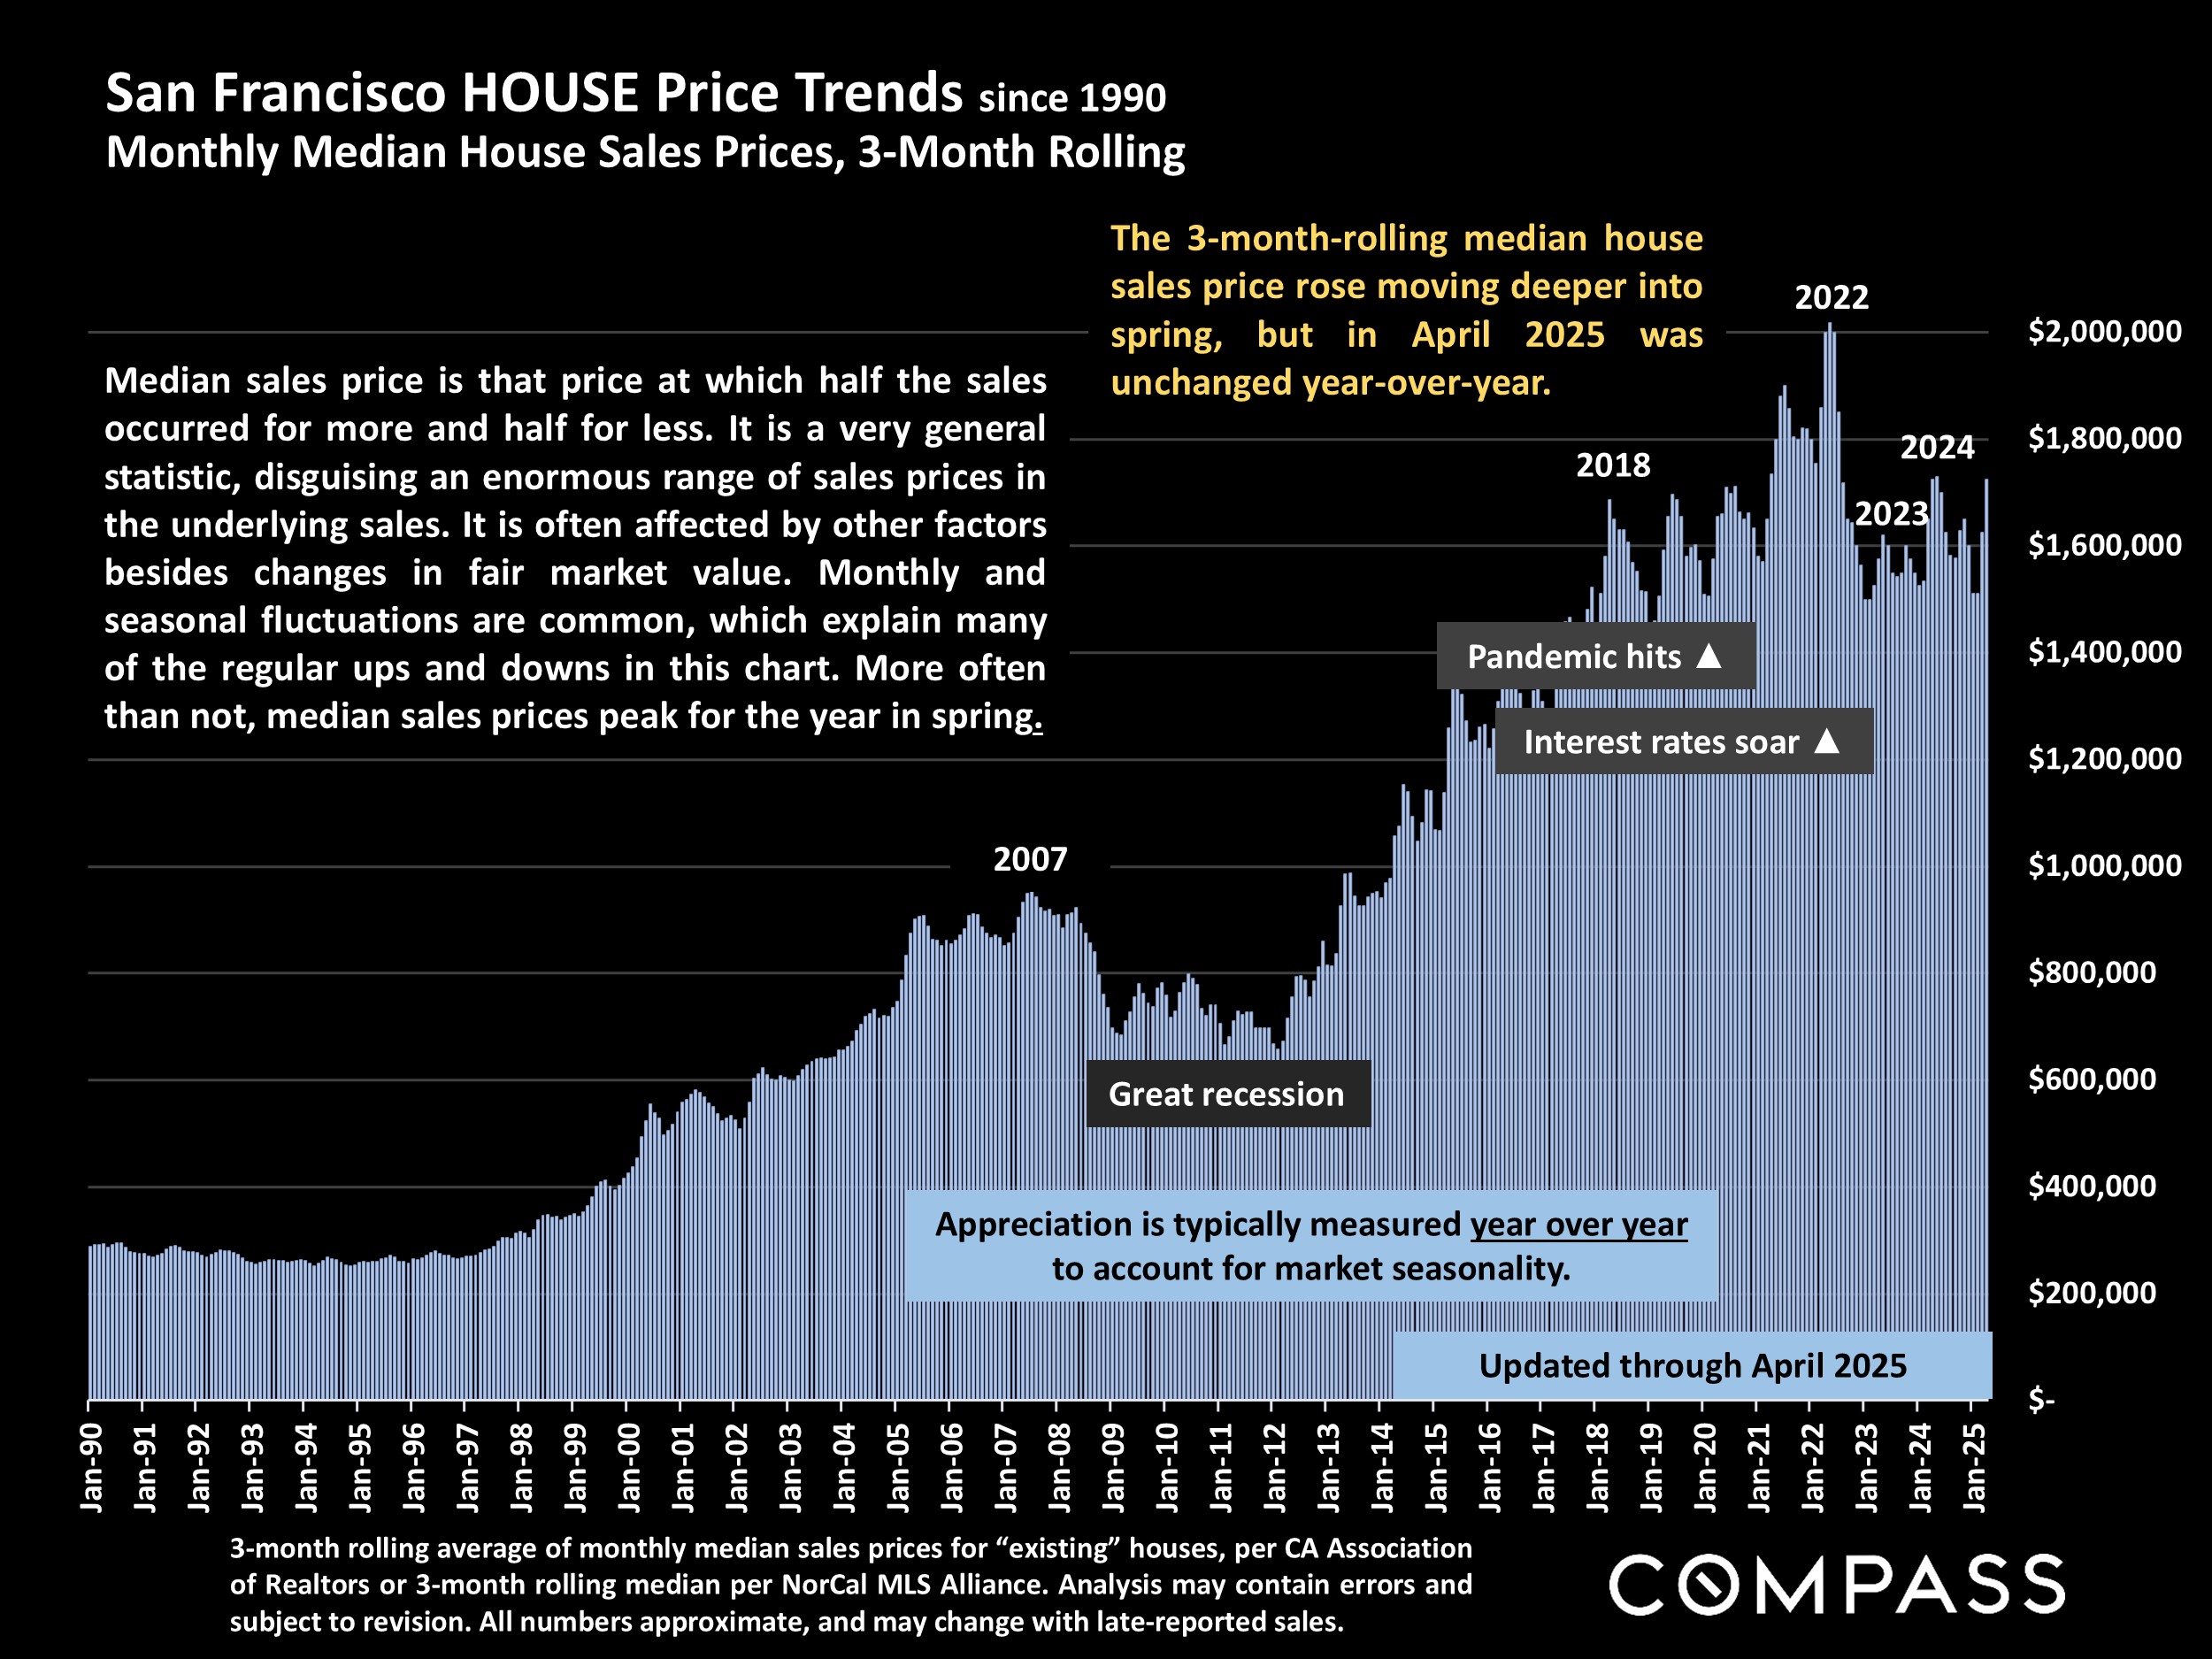
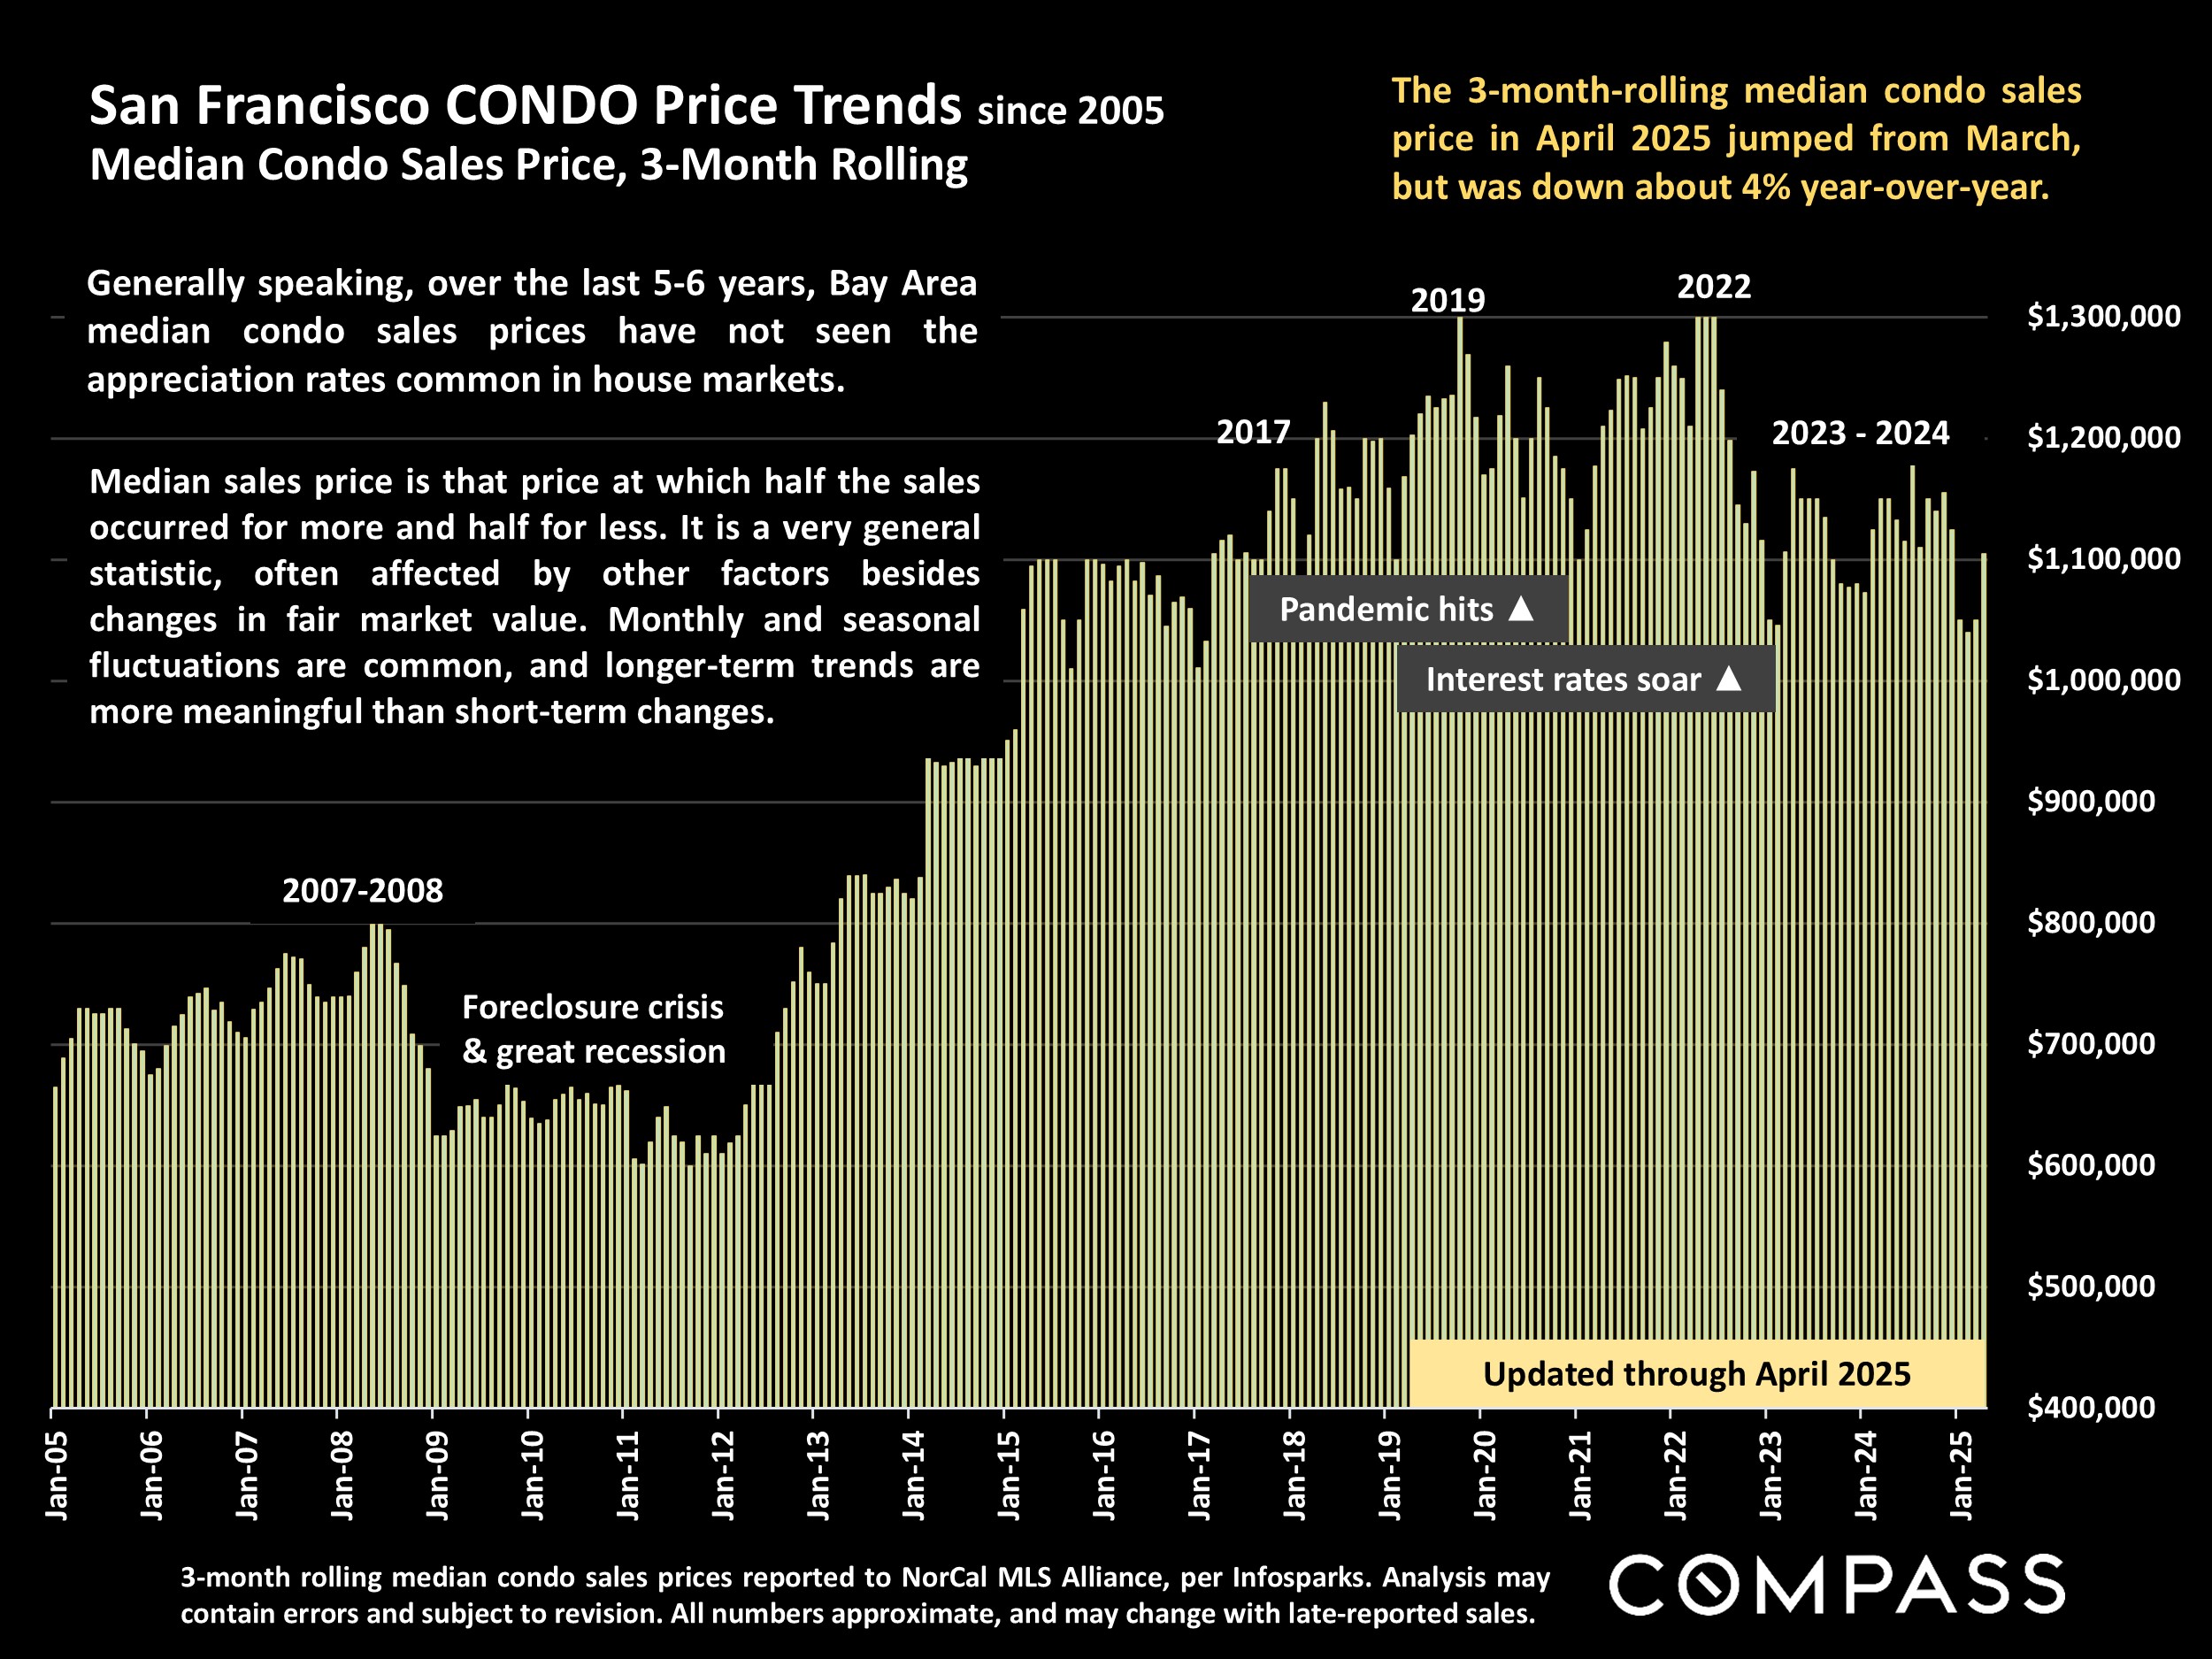
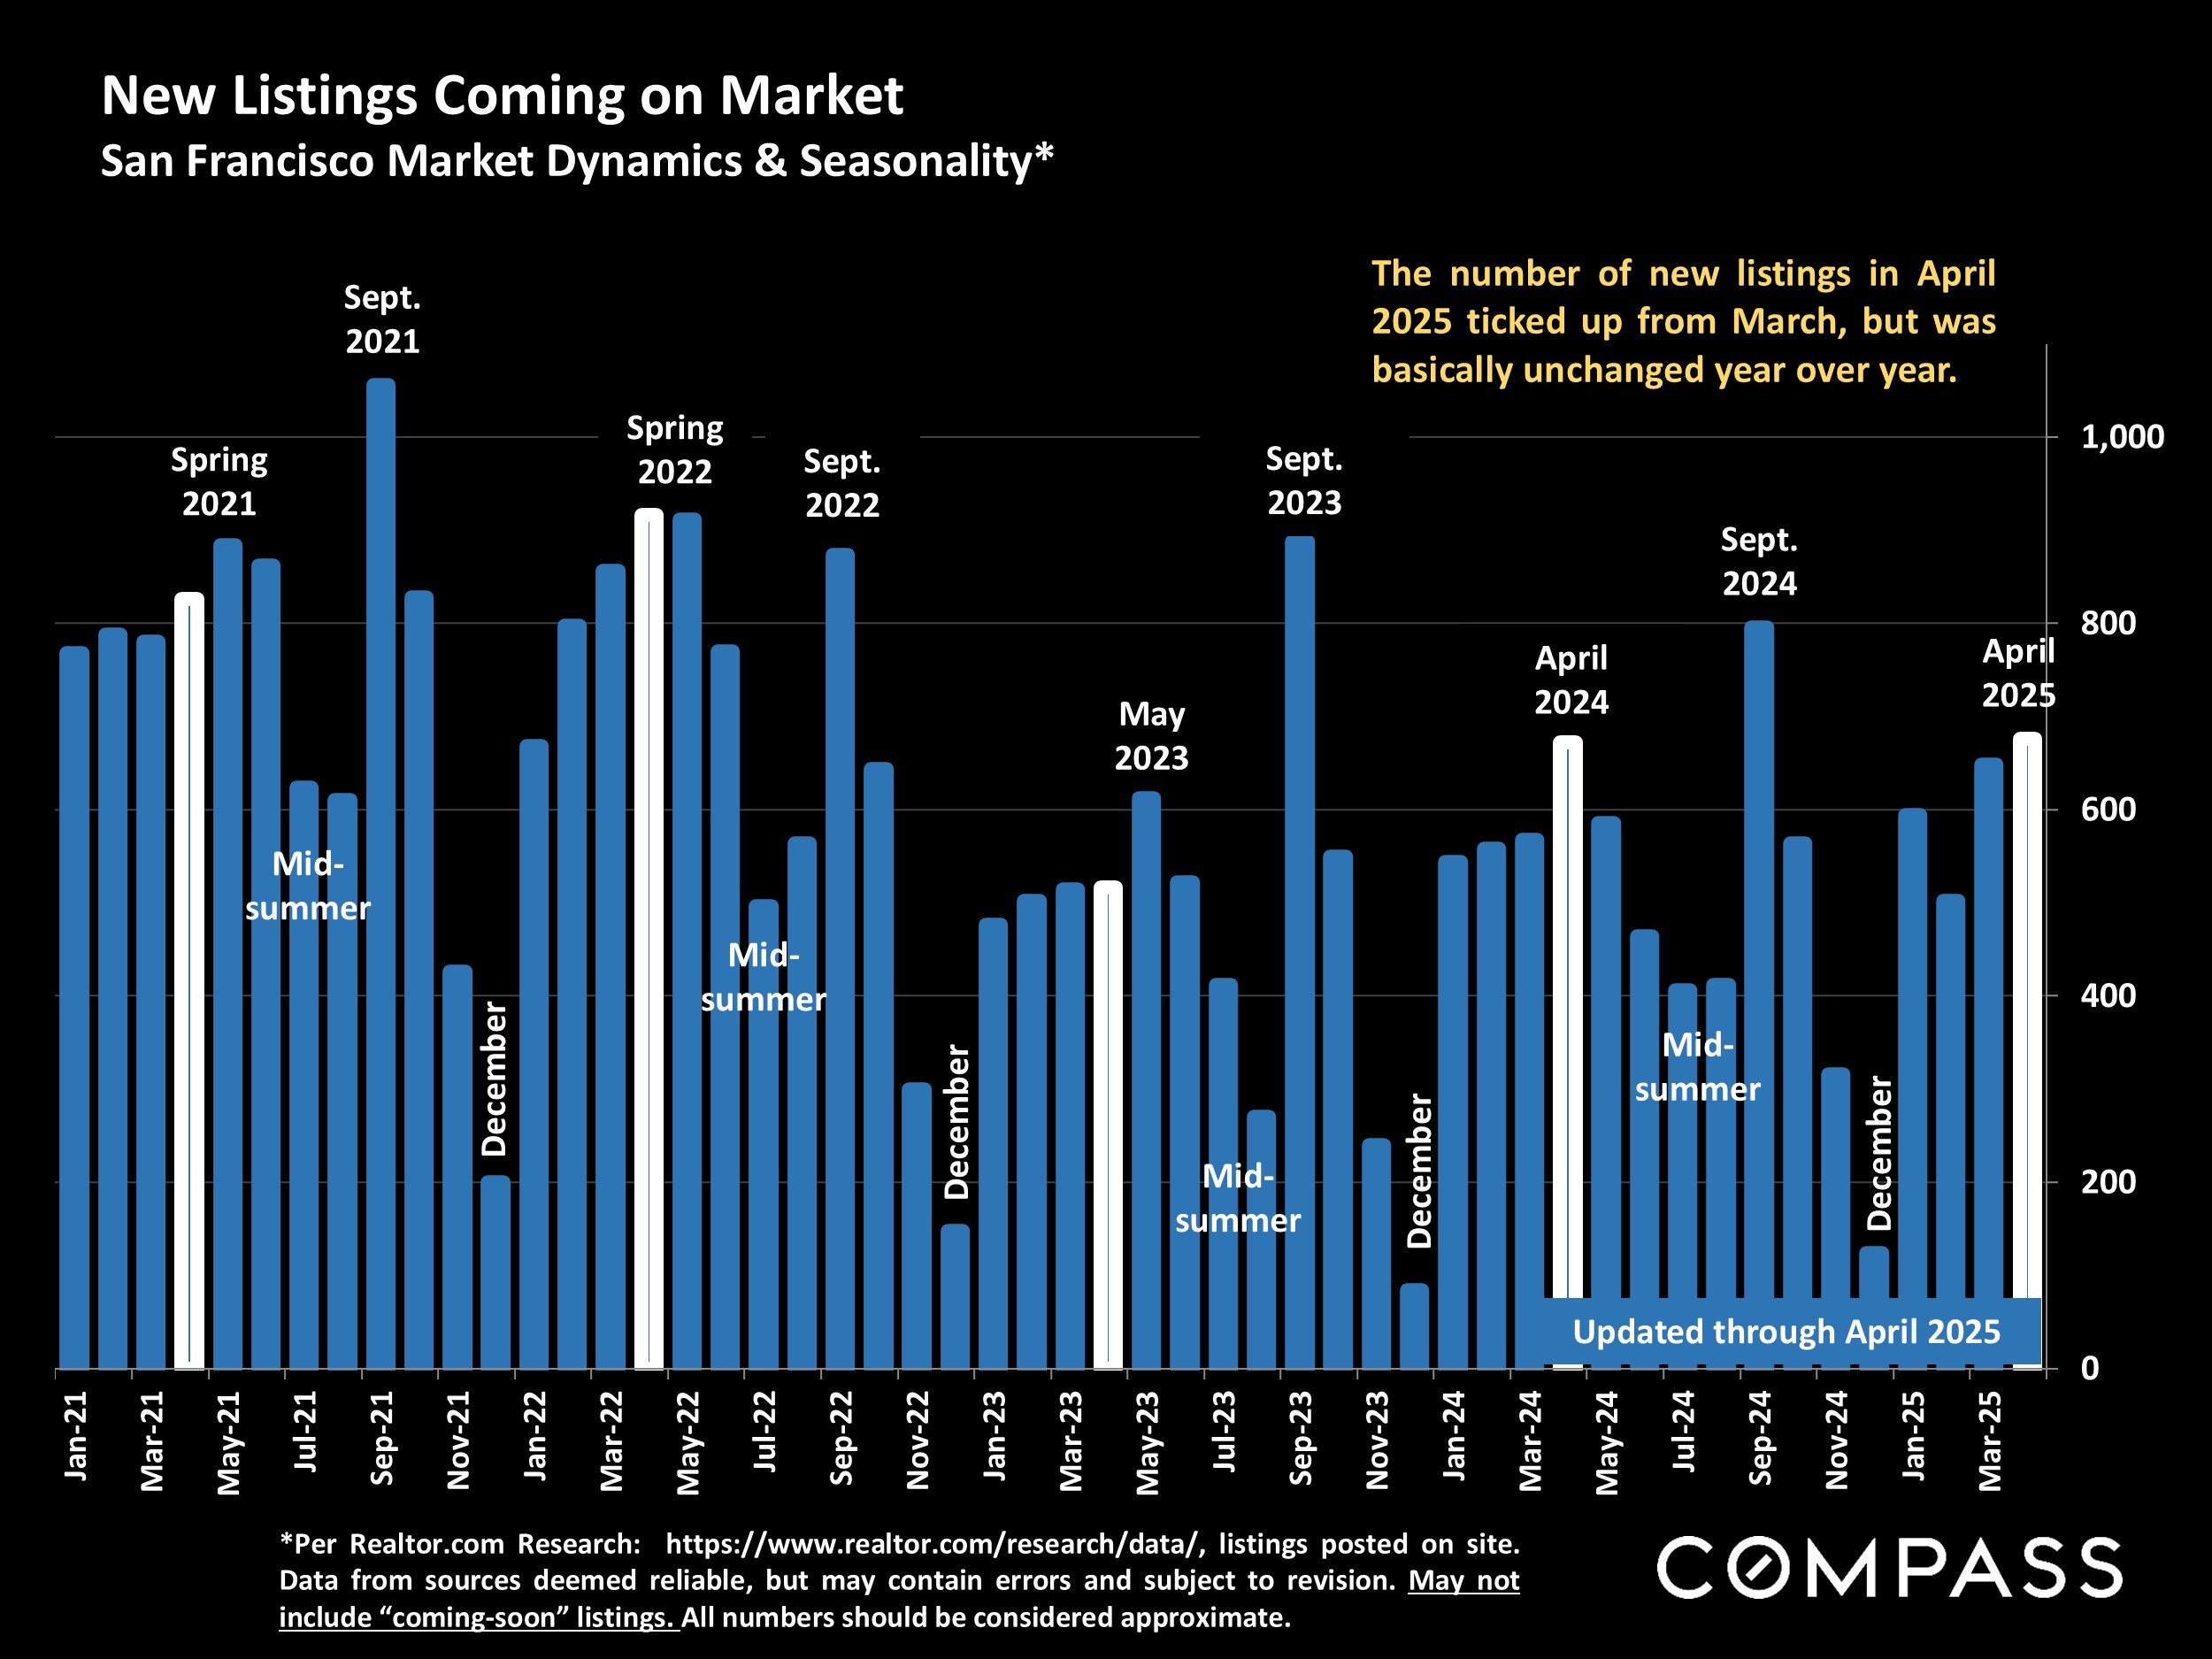
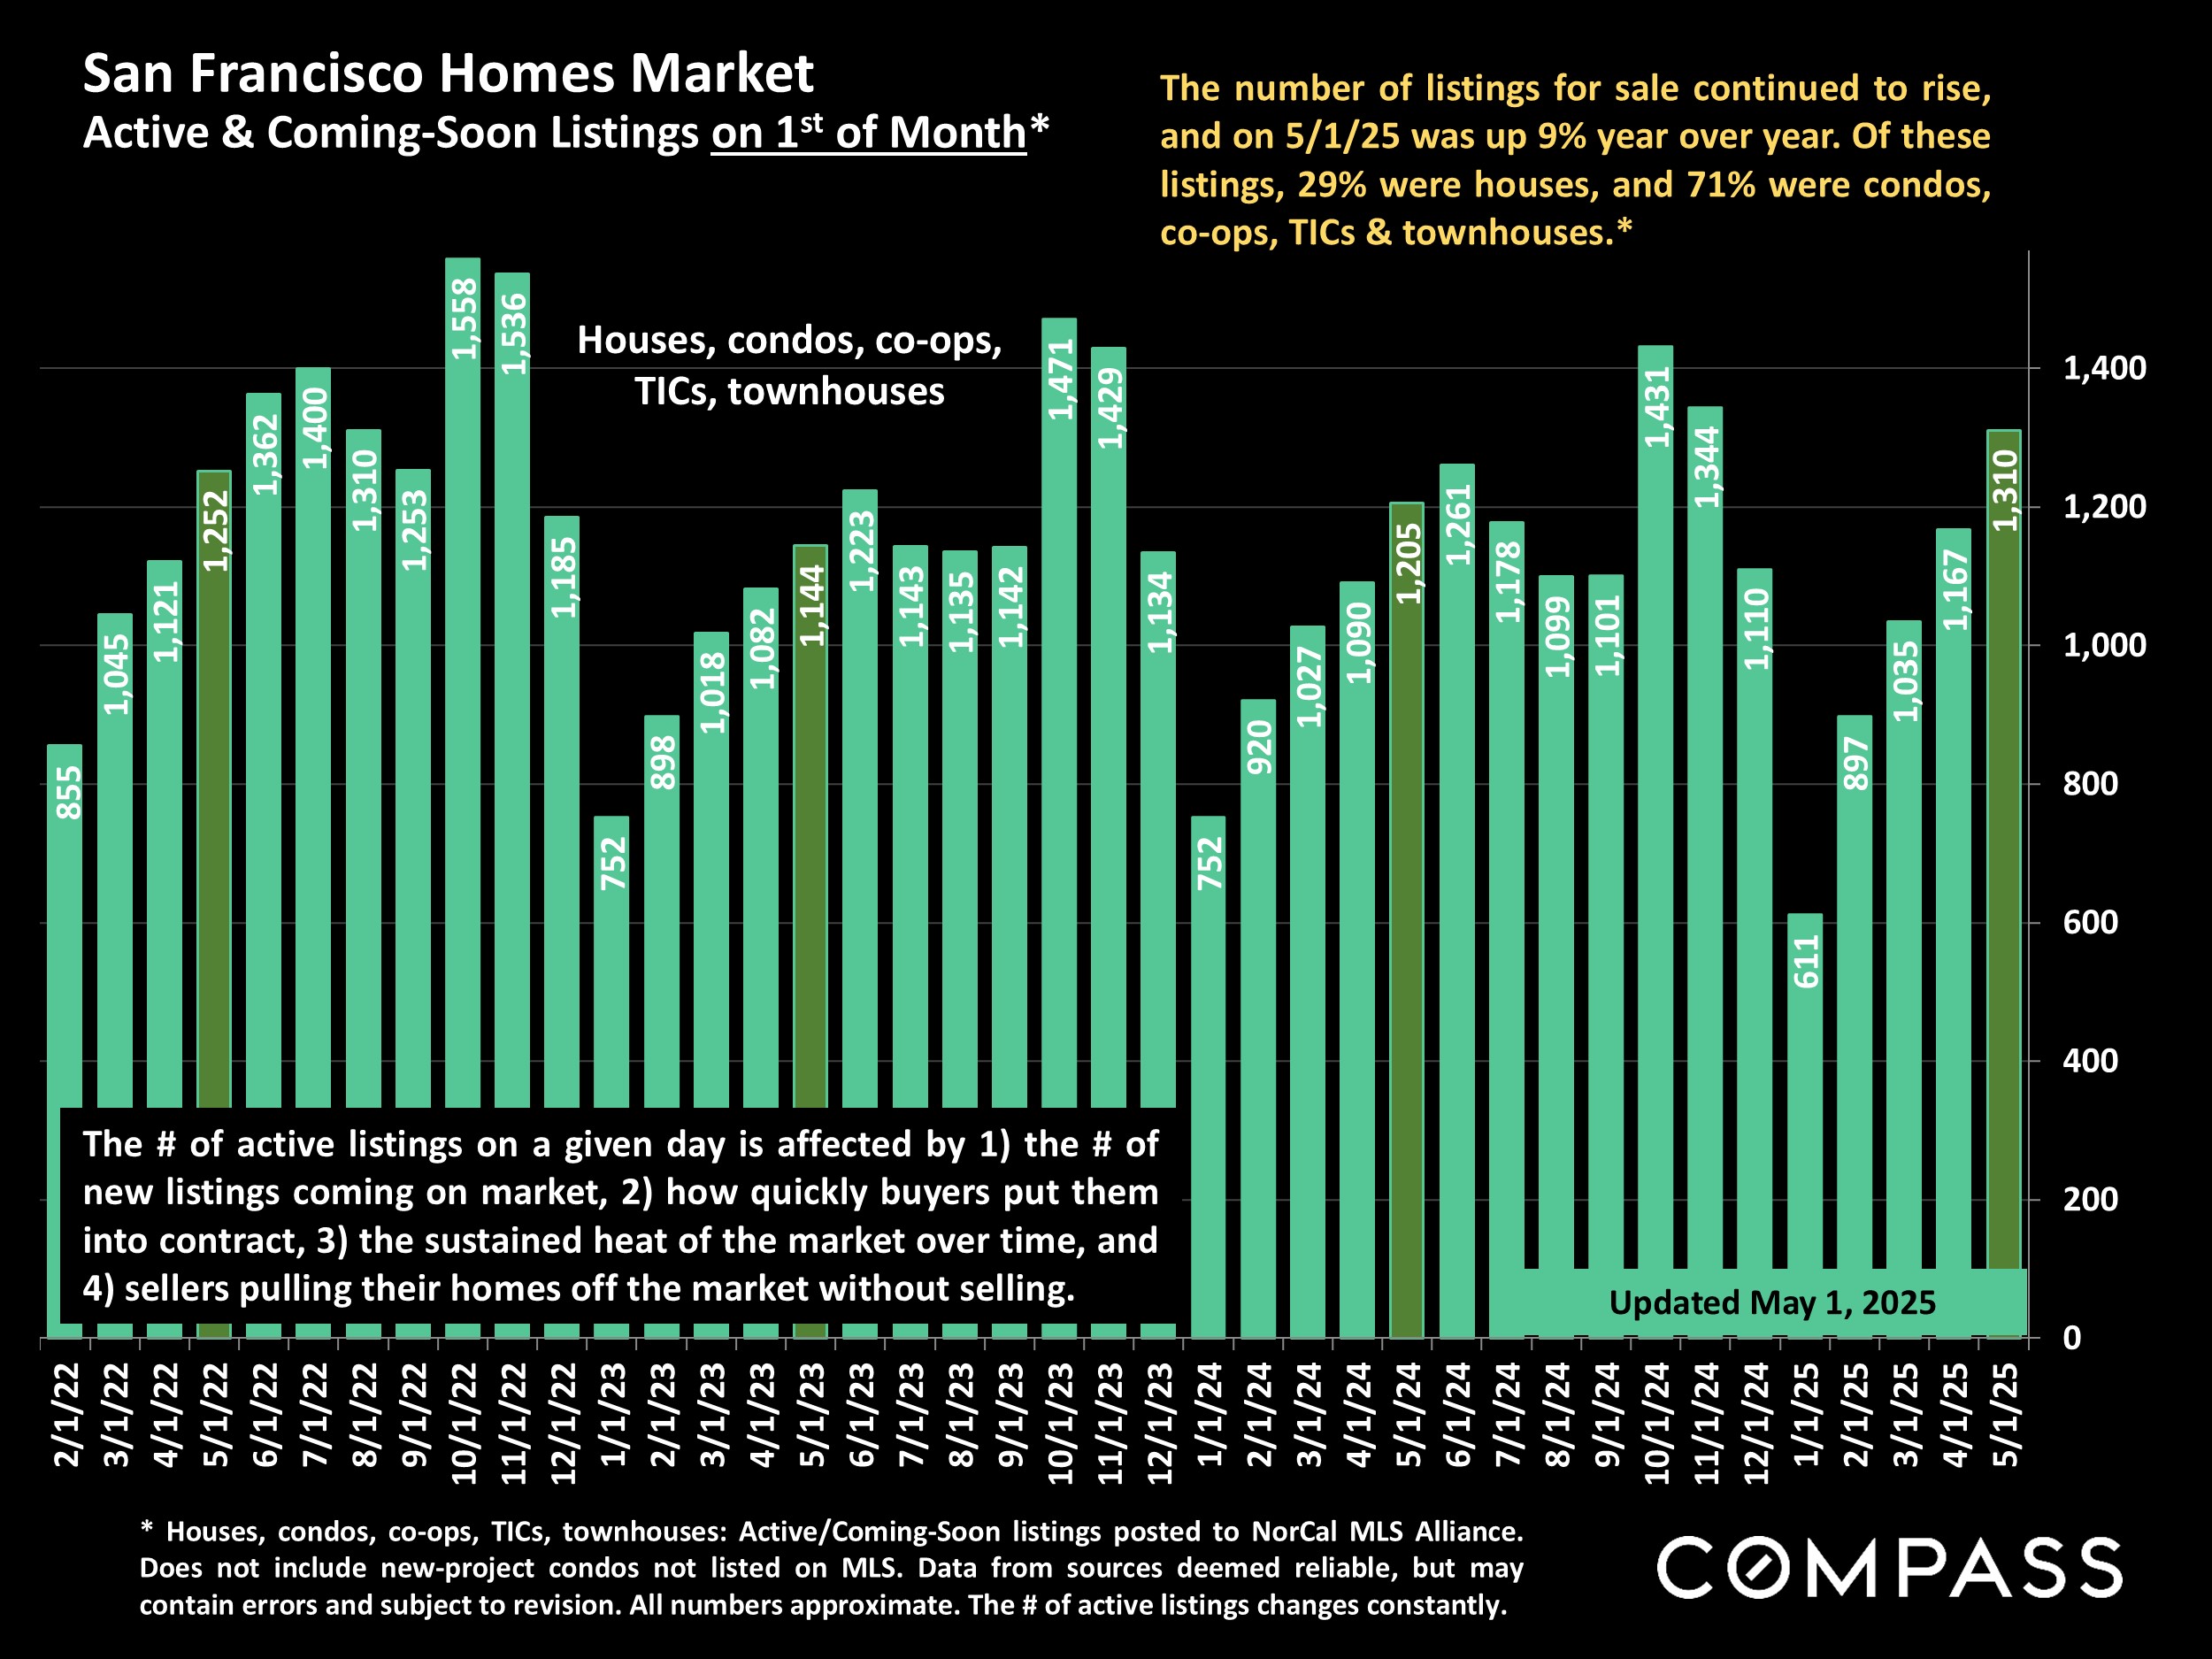
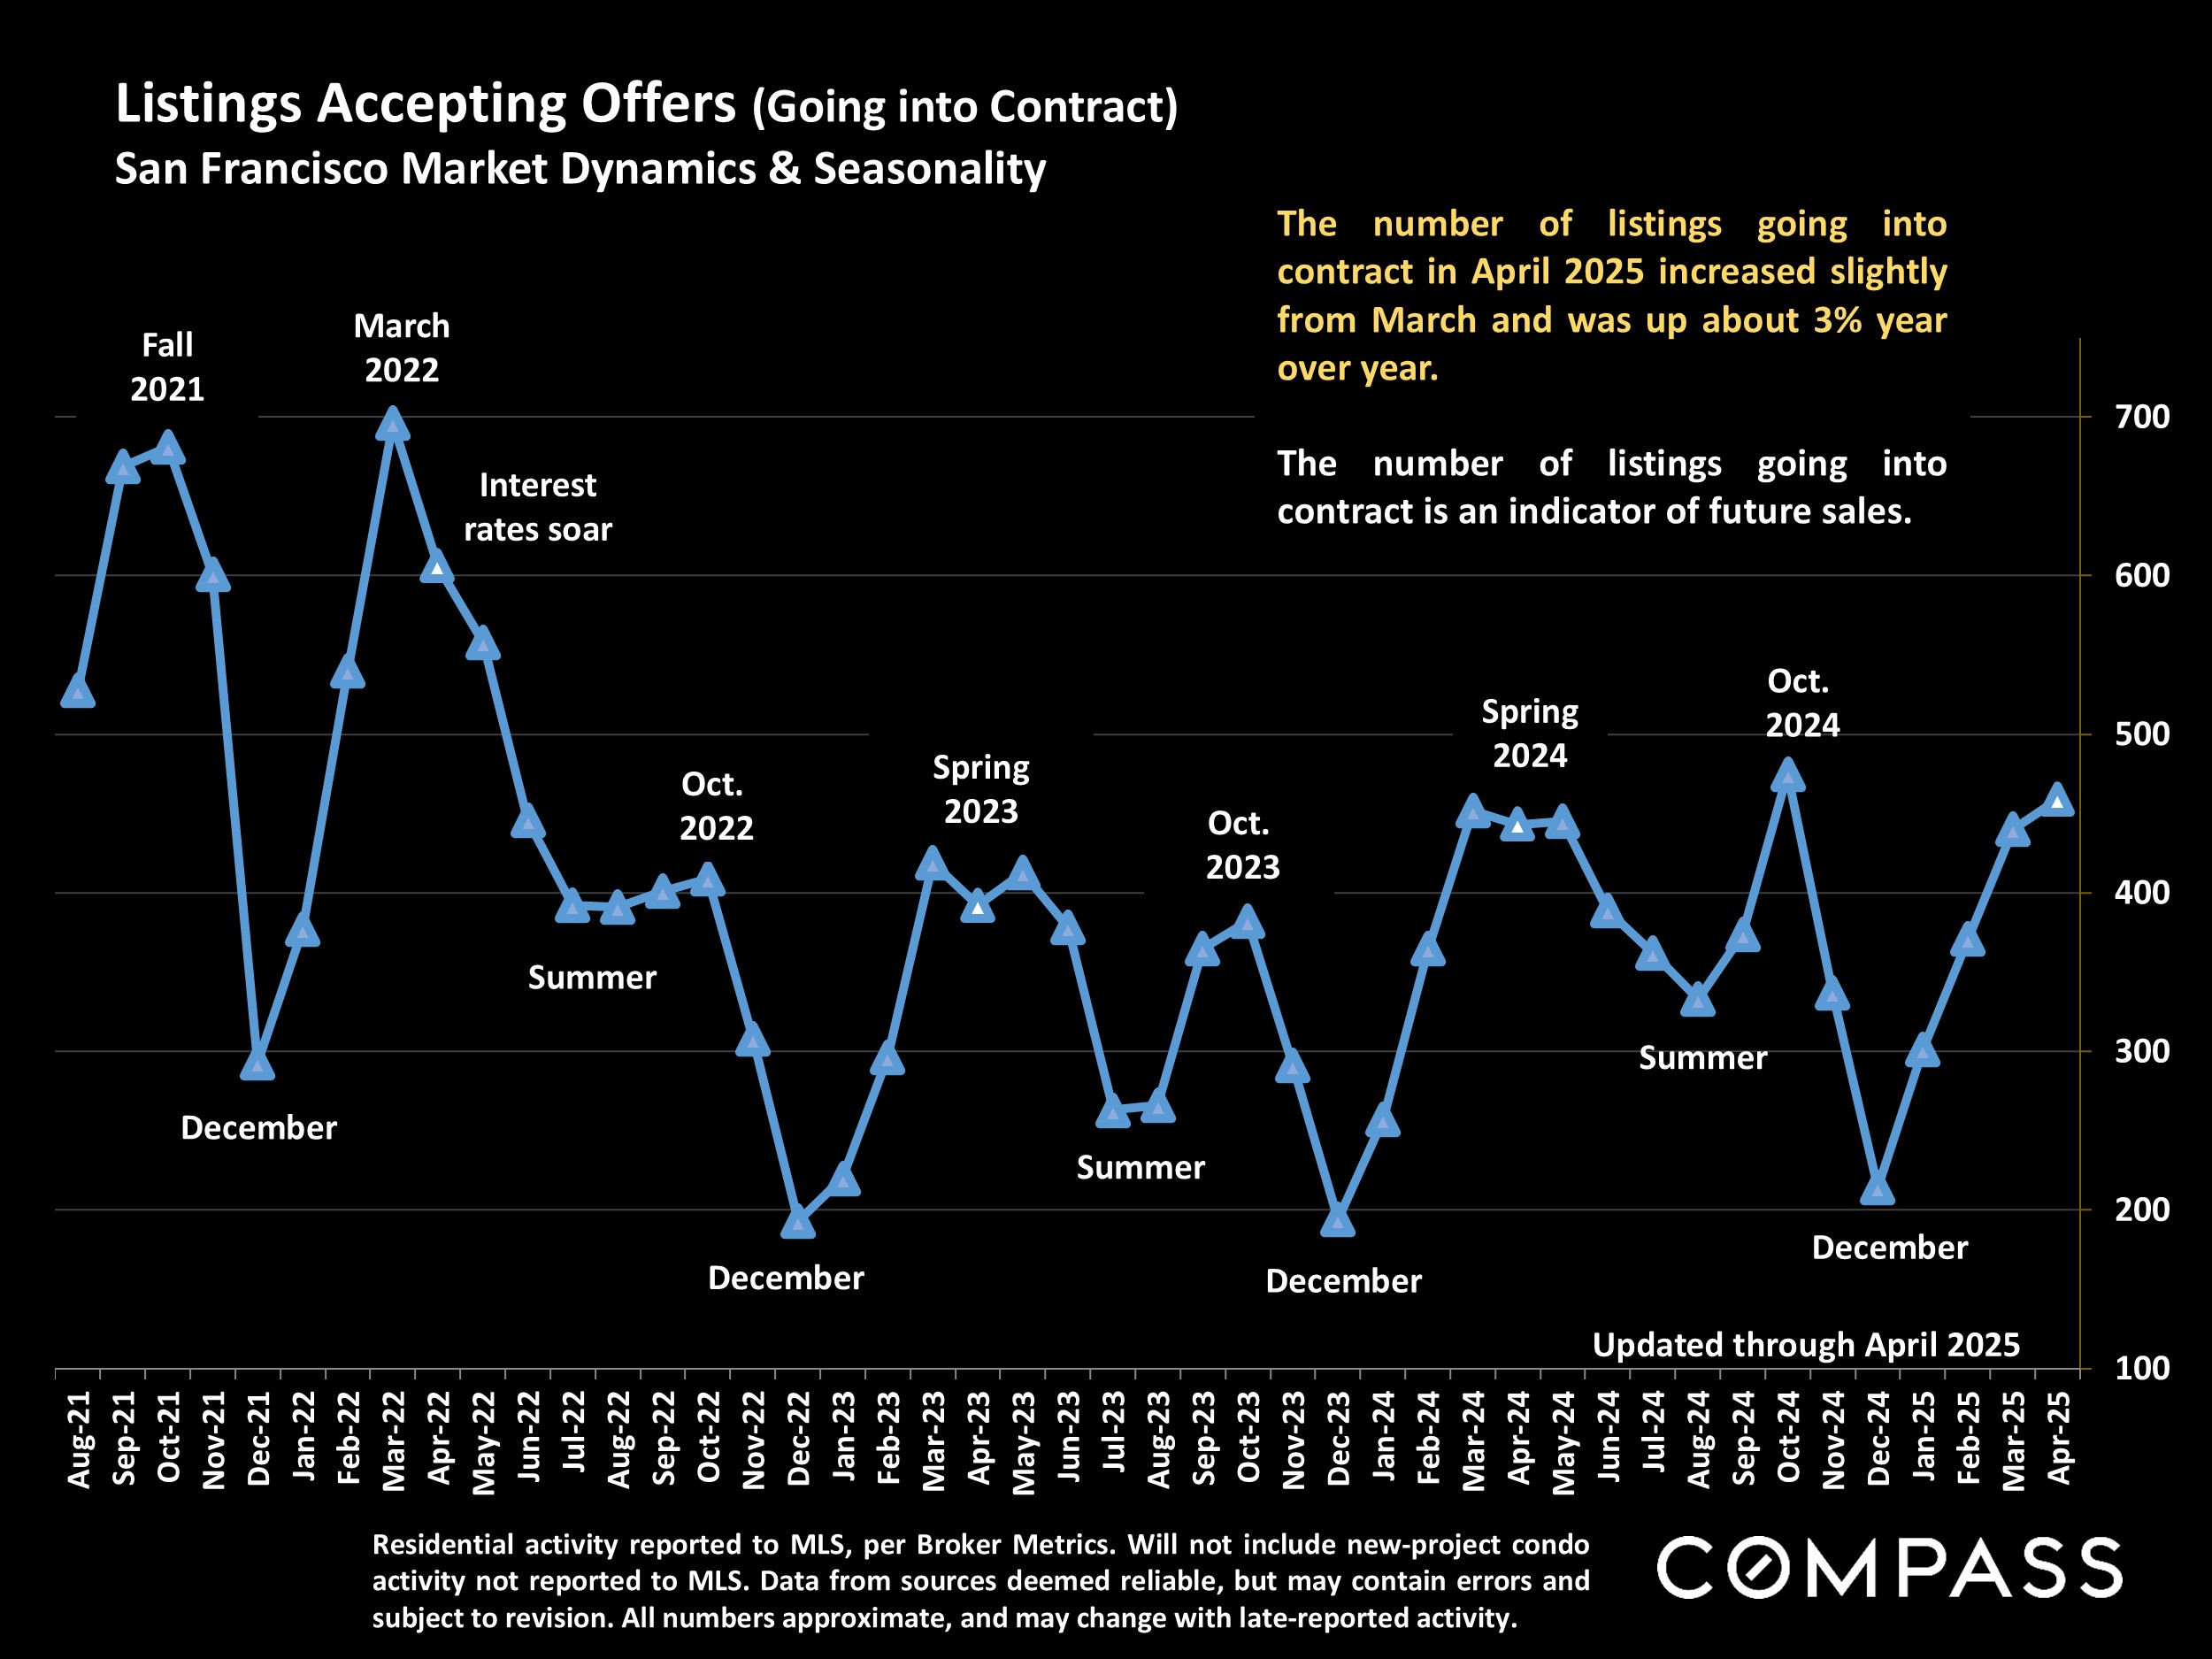
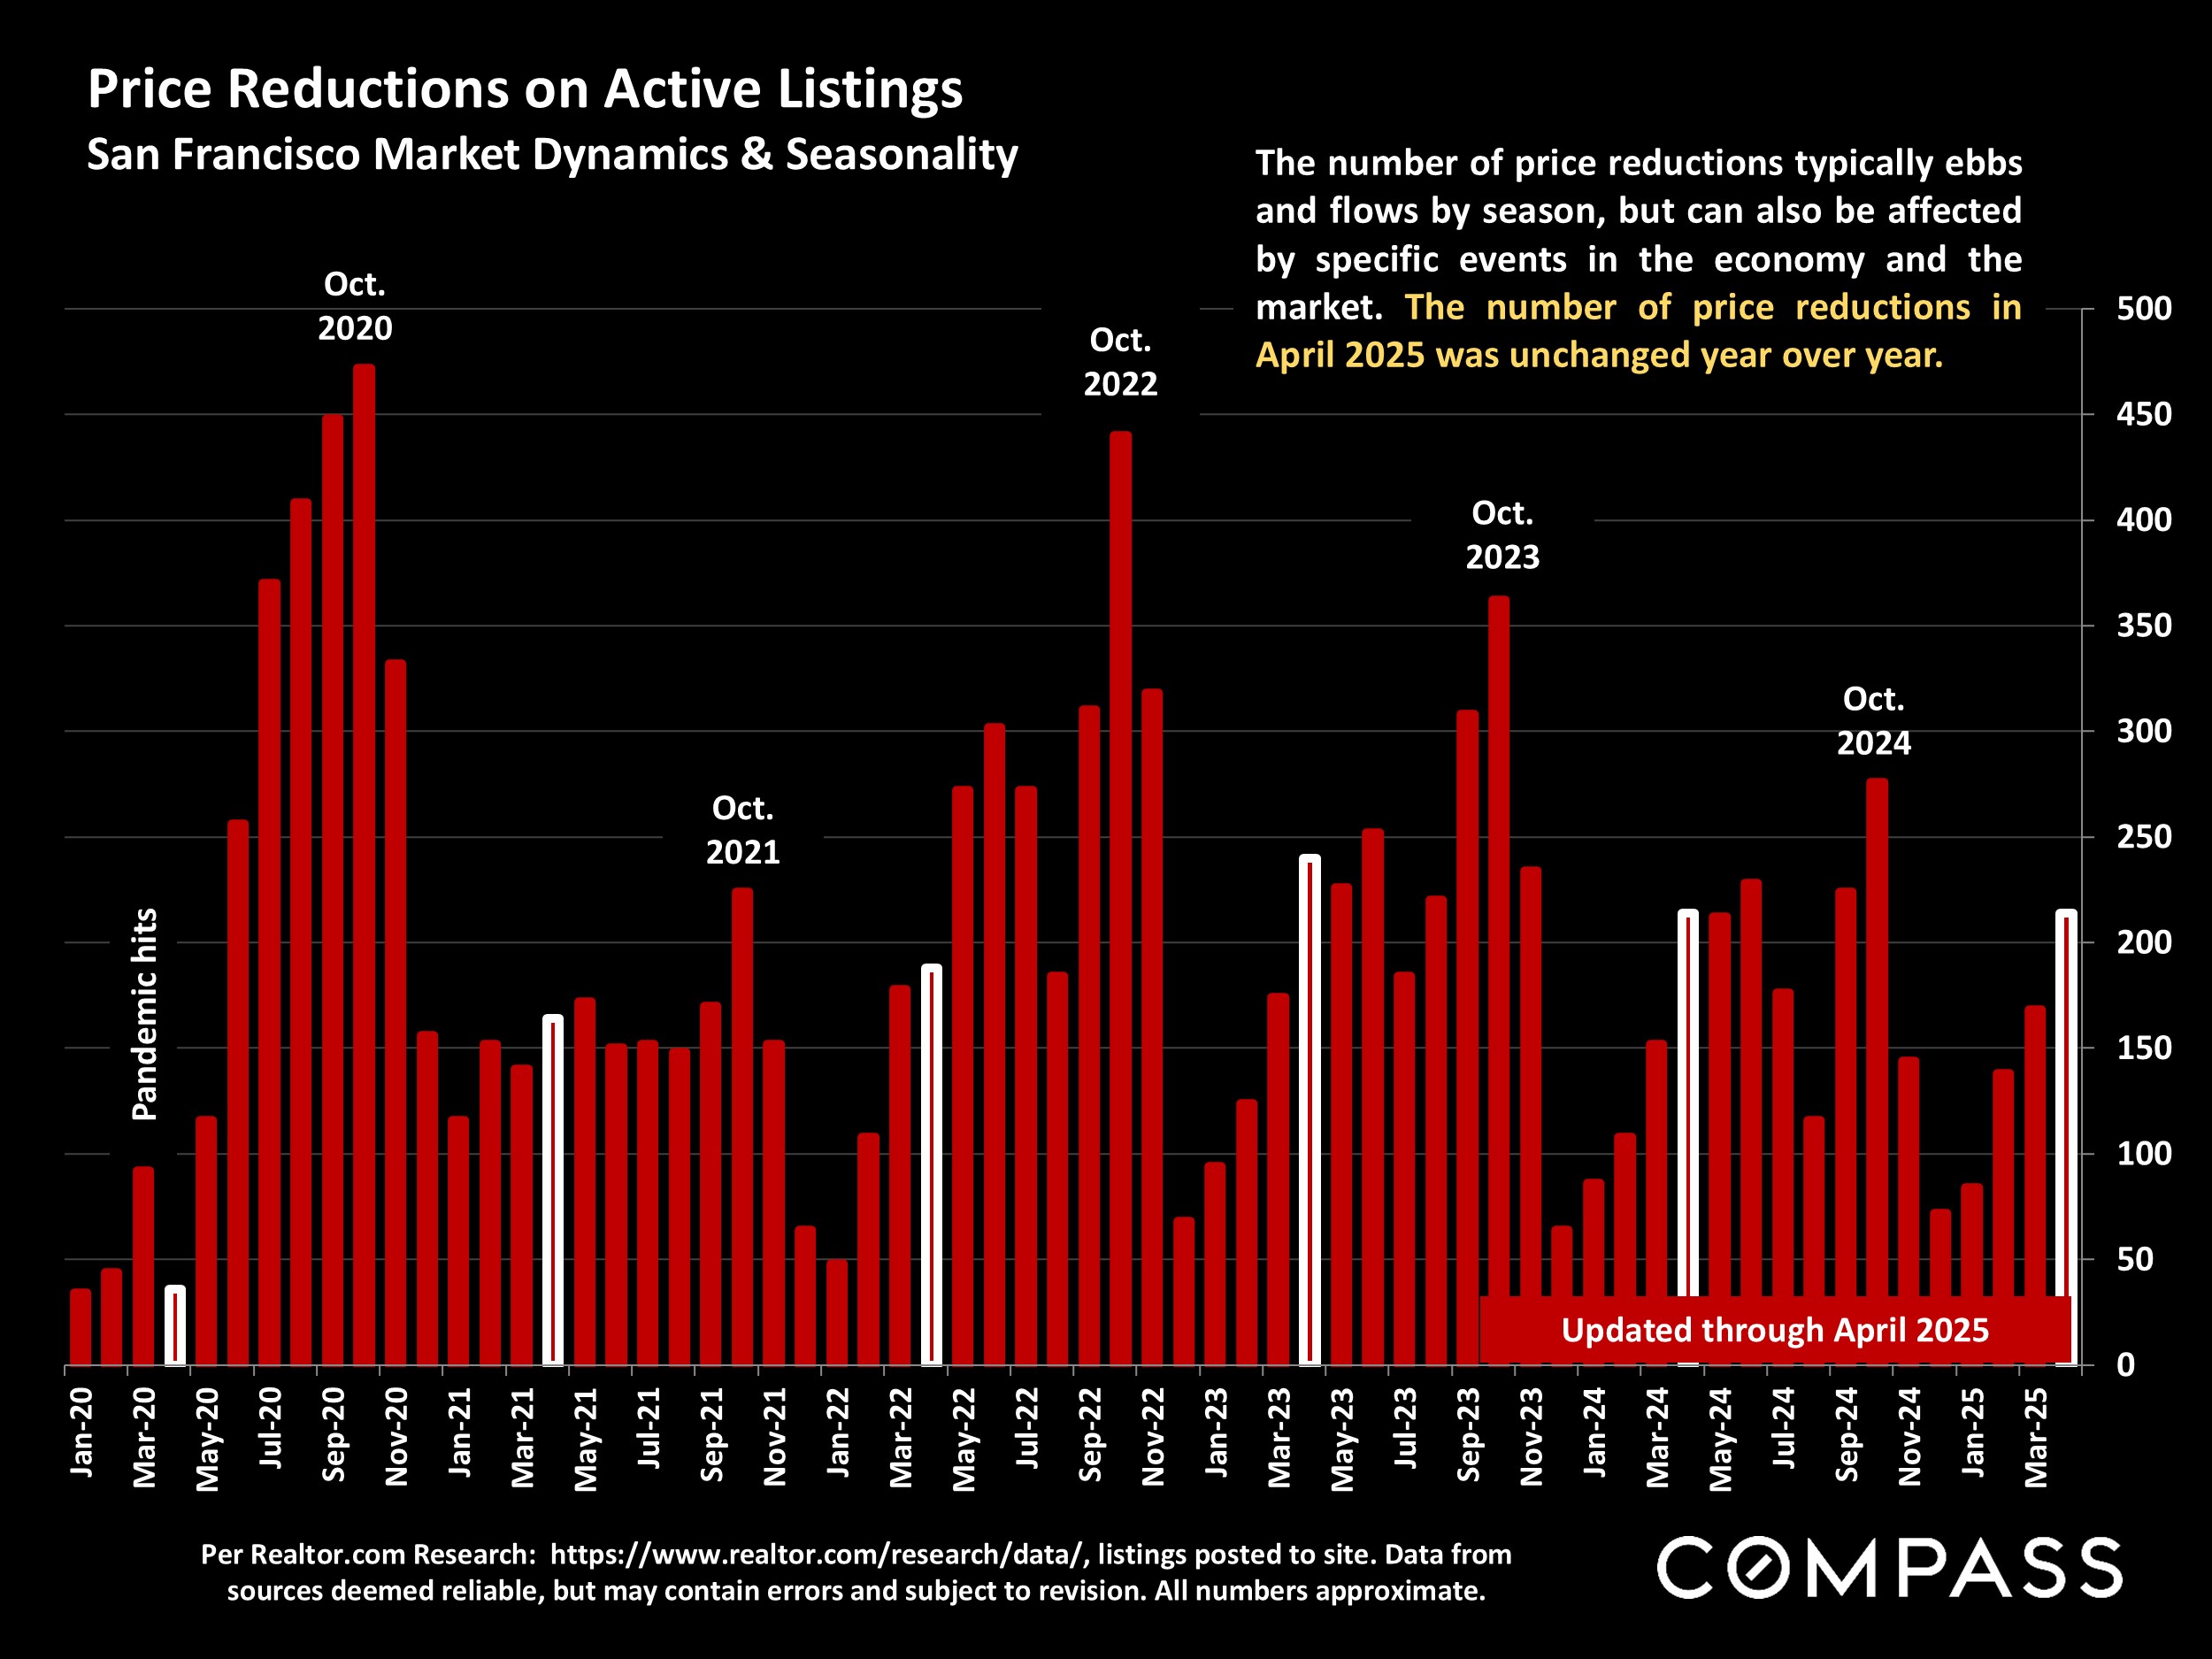
Year over year, the supply of homes for sale rose about 9%, a far smaller increase than in other local markets, some of which saw jumps of 70% or more. The number of listings going into contract in April ticked up slightly, though the number of closed sales fell. The quantity of price reductions, which soared in most Bay Area Counties, remained flat from last year. The 3-month-rolling SF median house sales price was unchanged from April 2024, while the median condo sales price declined.
The homes seeing the highest demand, and most likely to sell quickly with multiple offers, are houses in absolute move-in condition, often professionally staged, aggressively priced, and in prime locations.
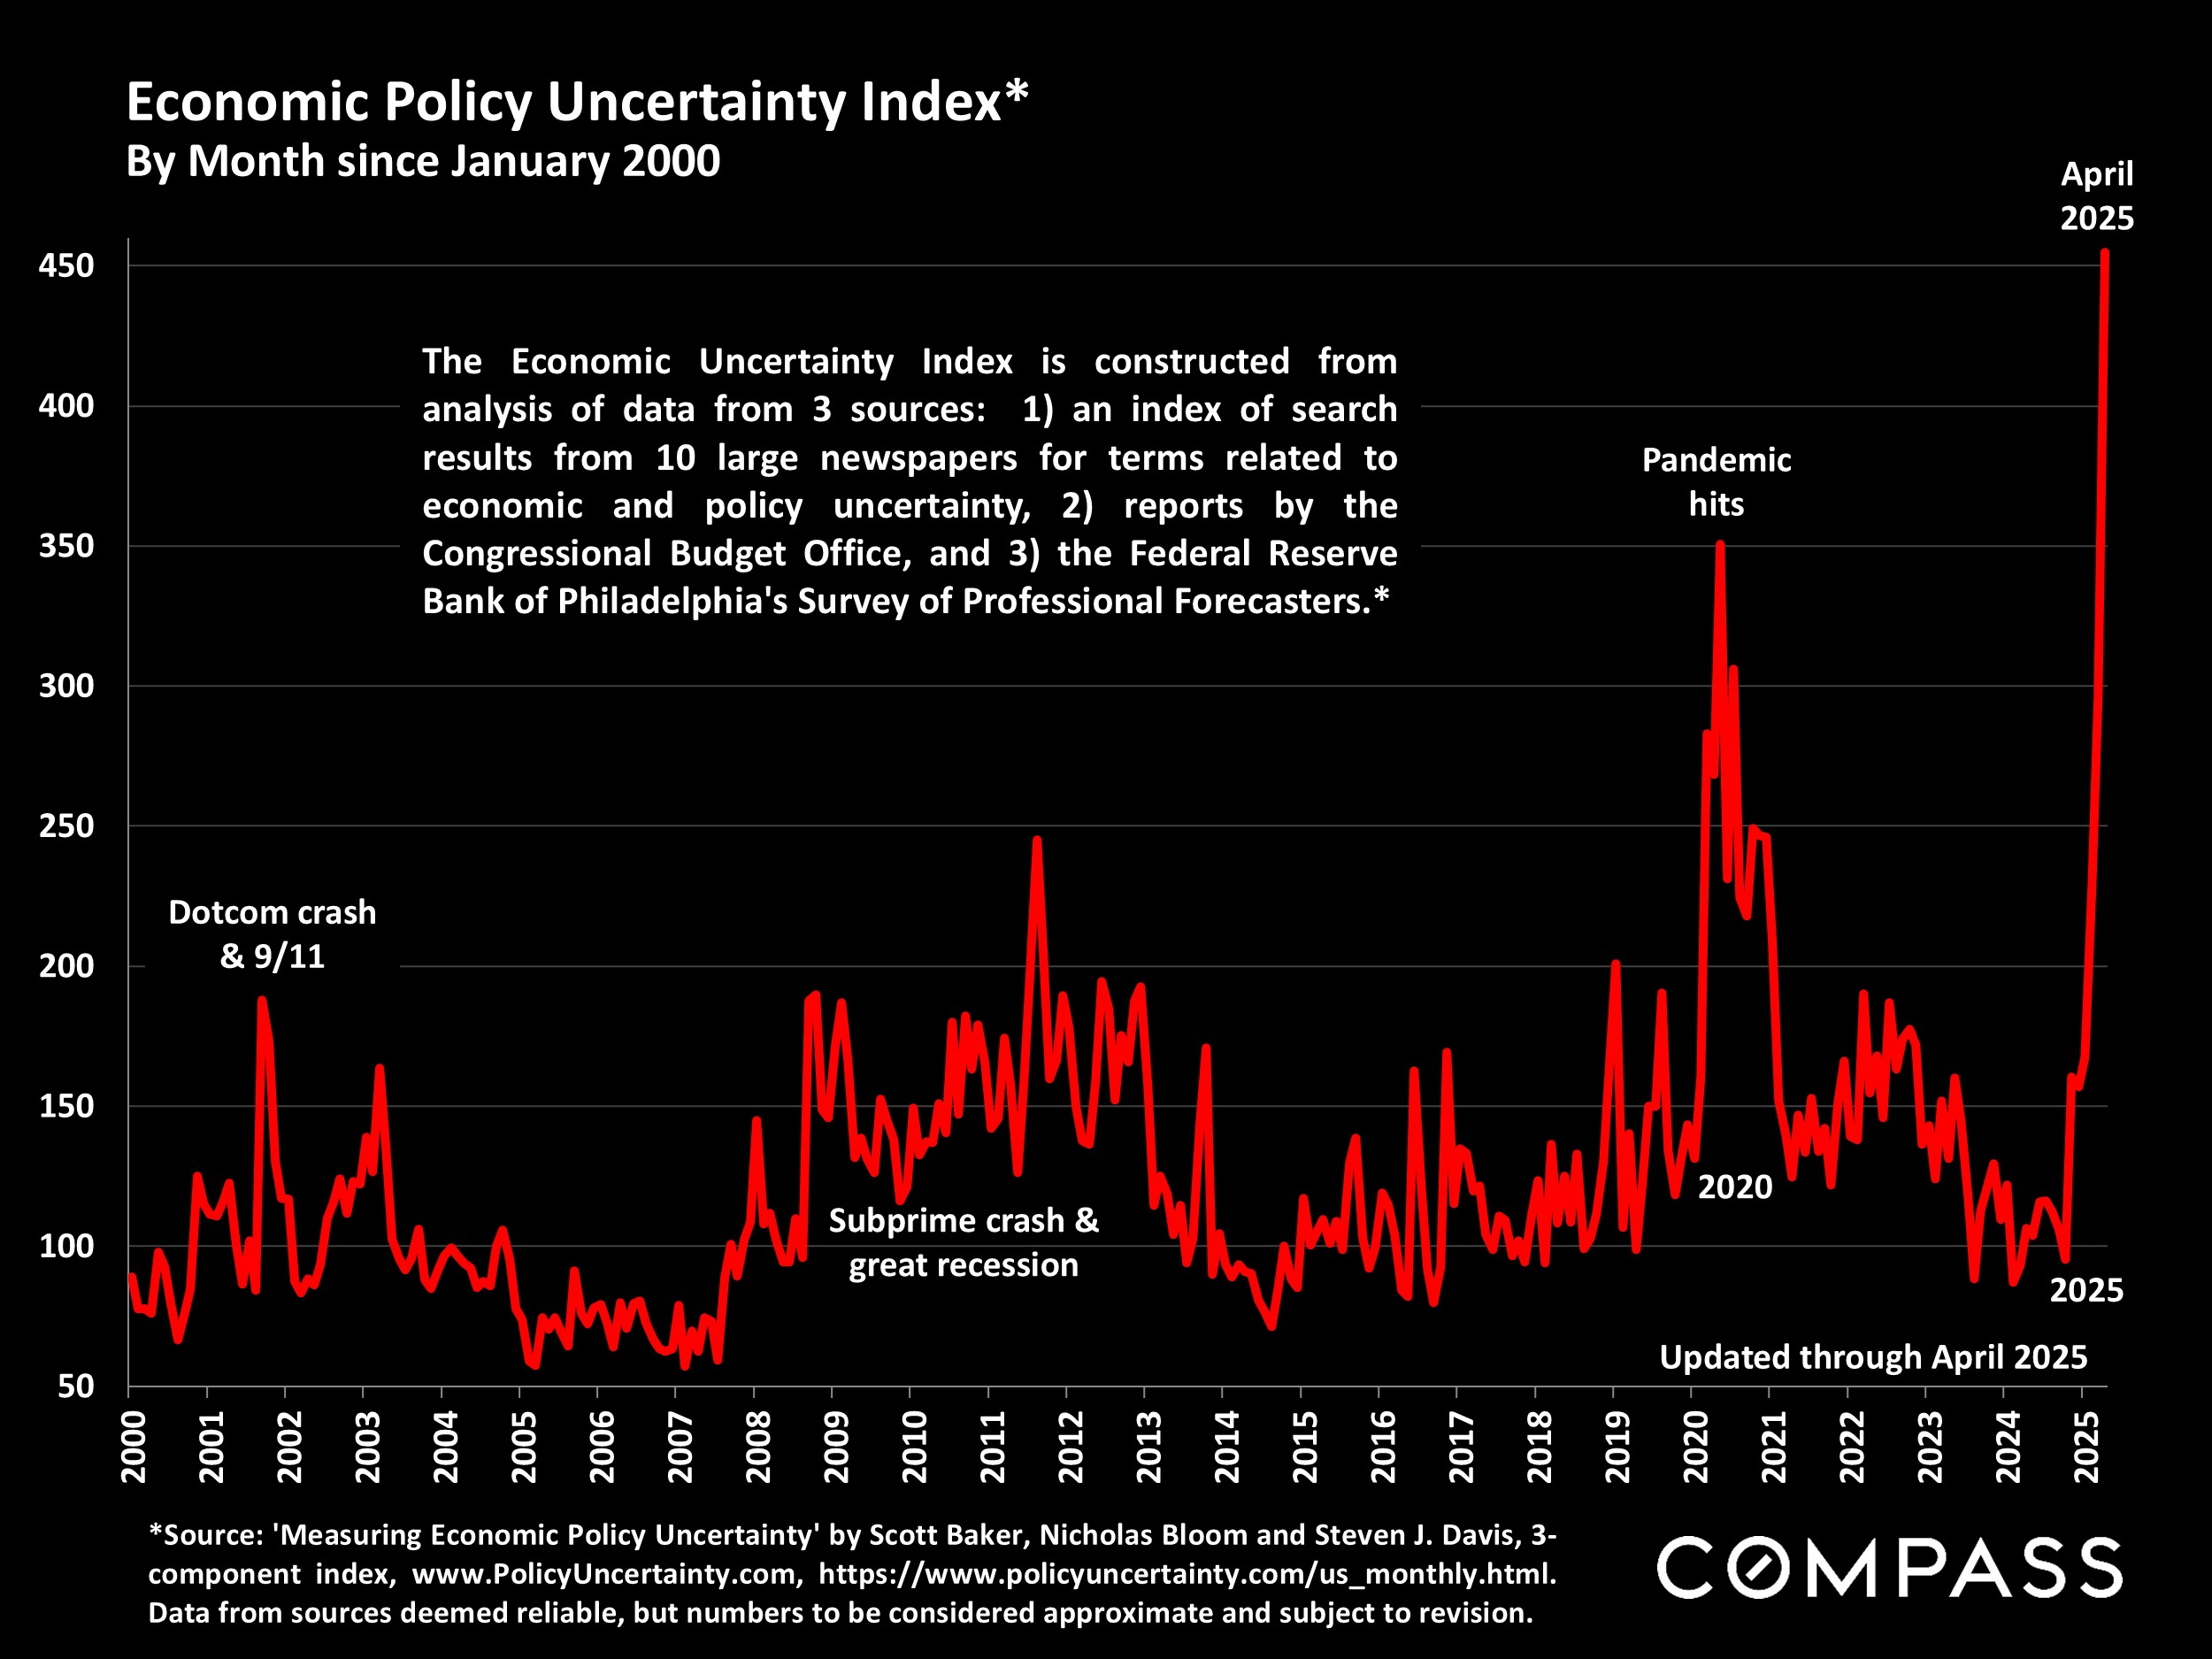
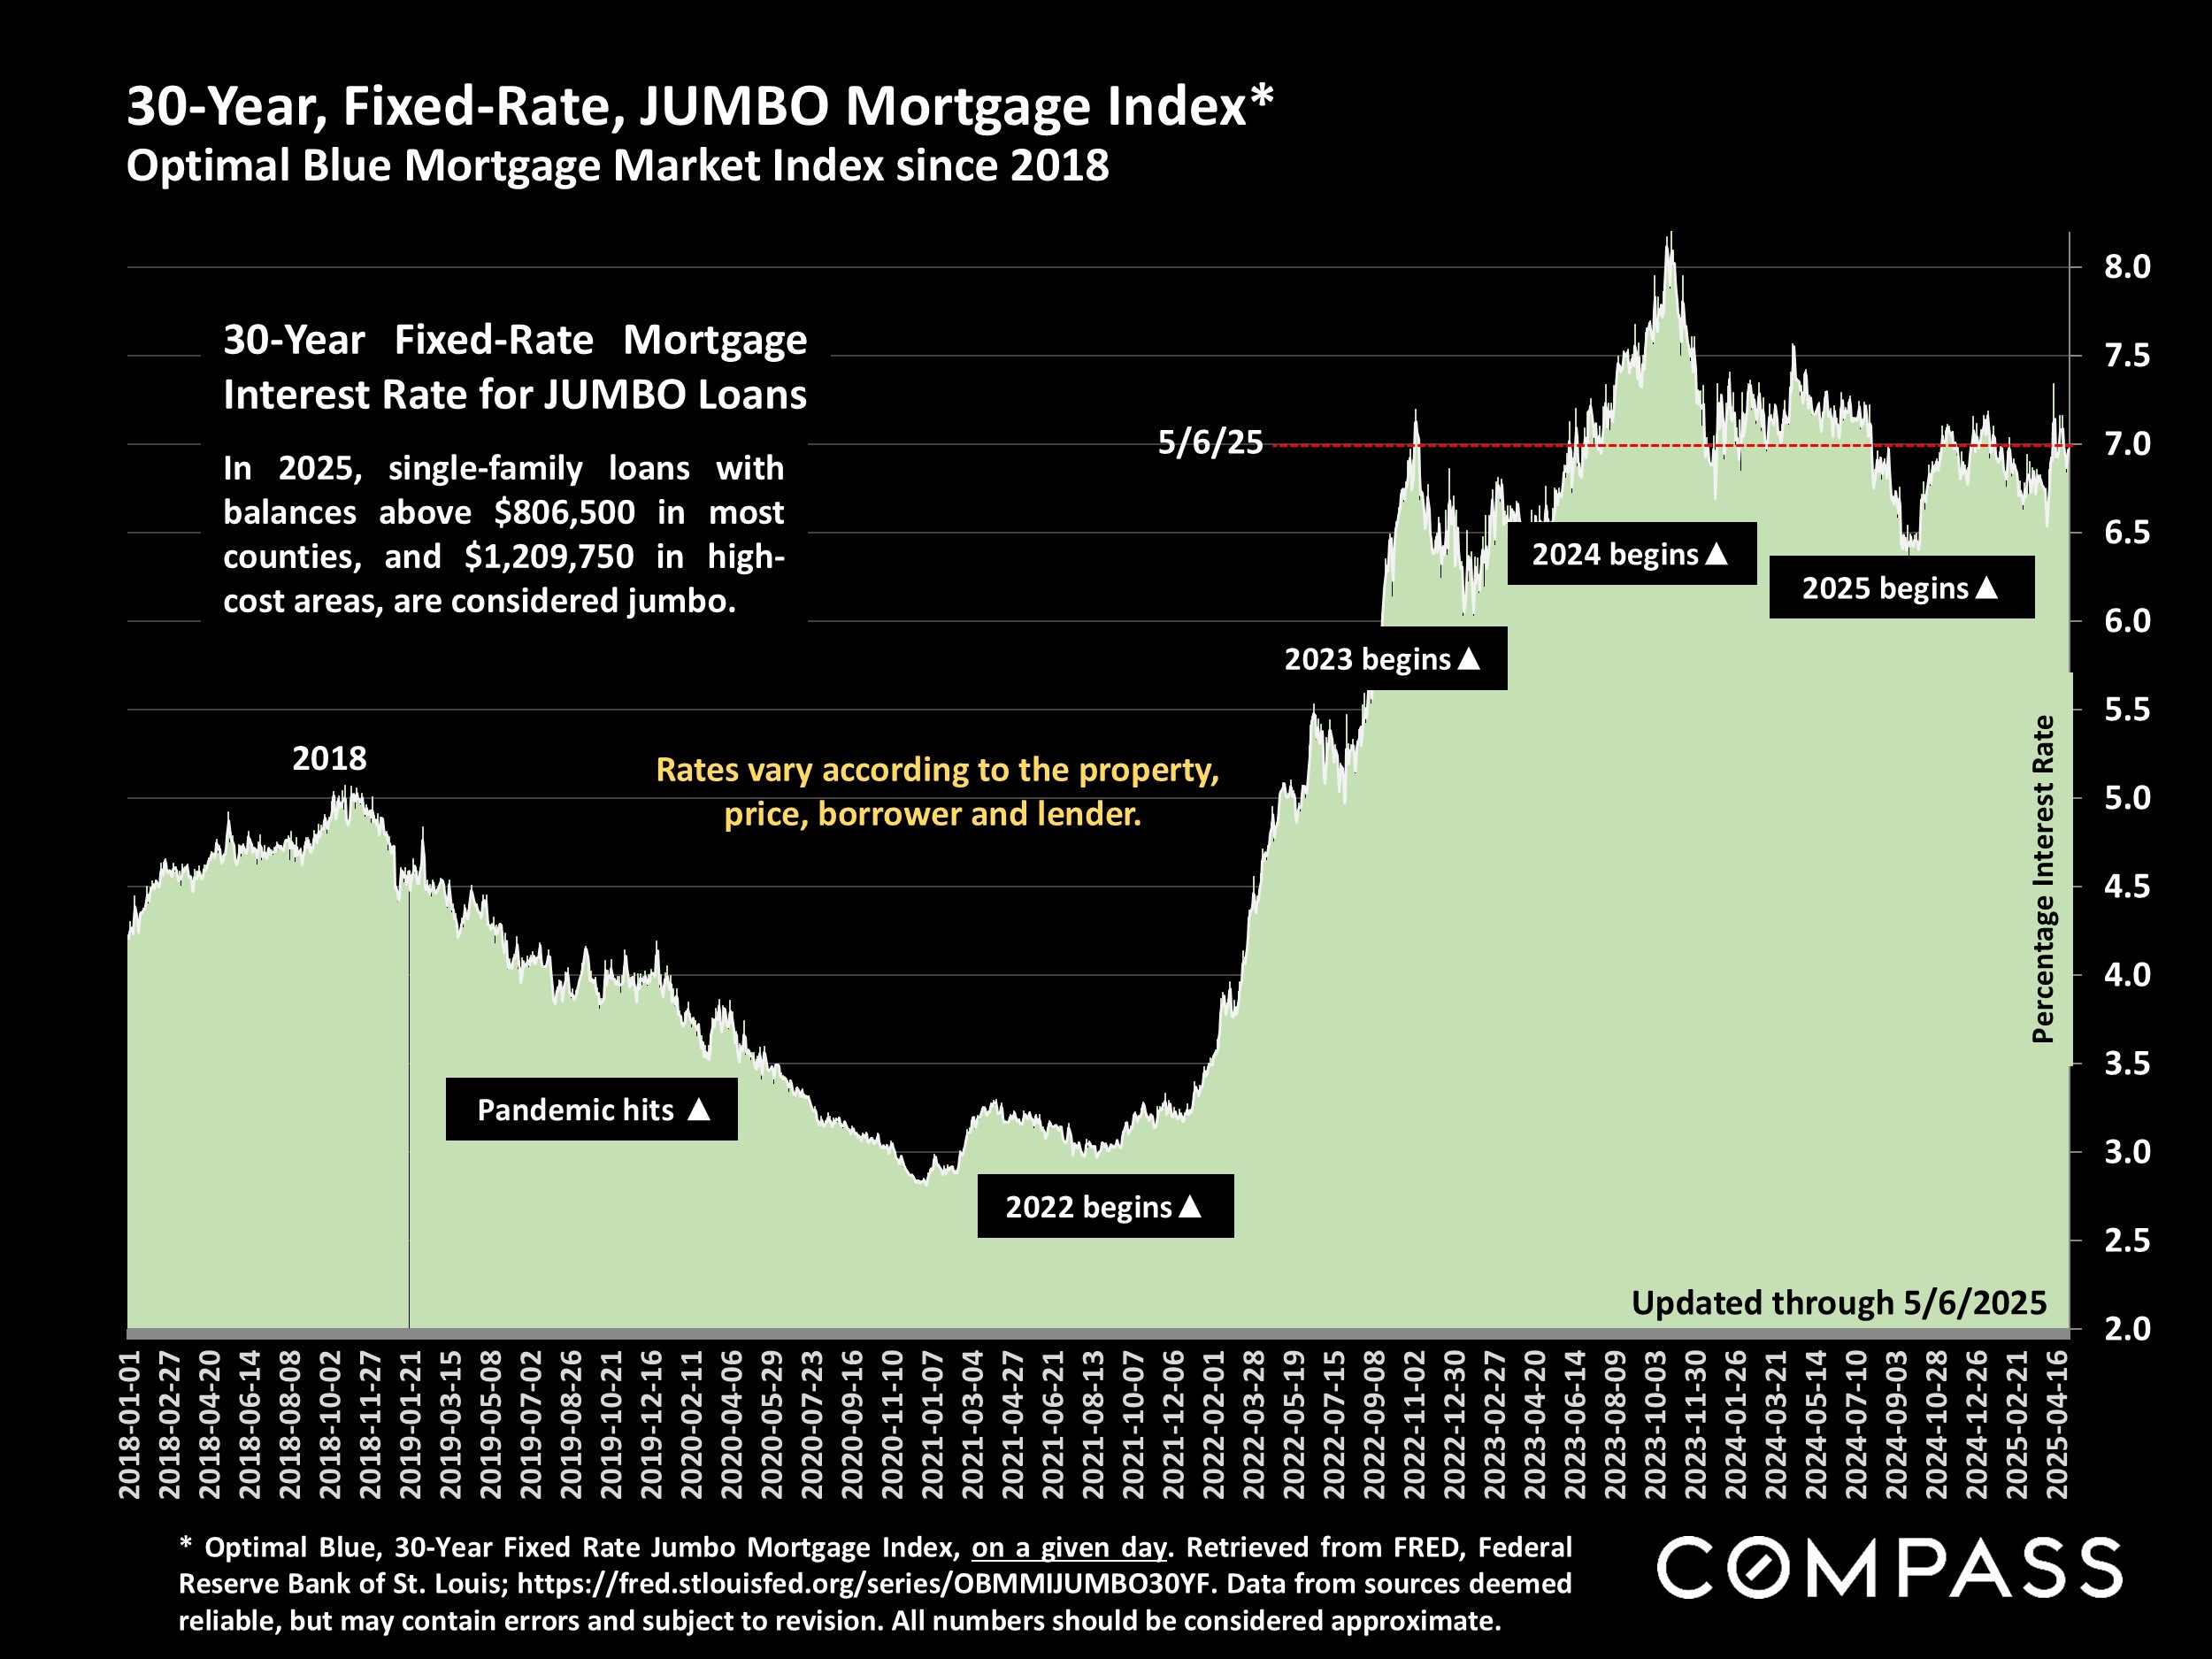
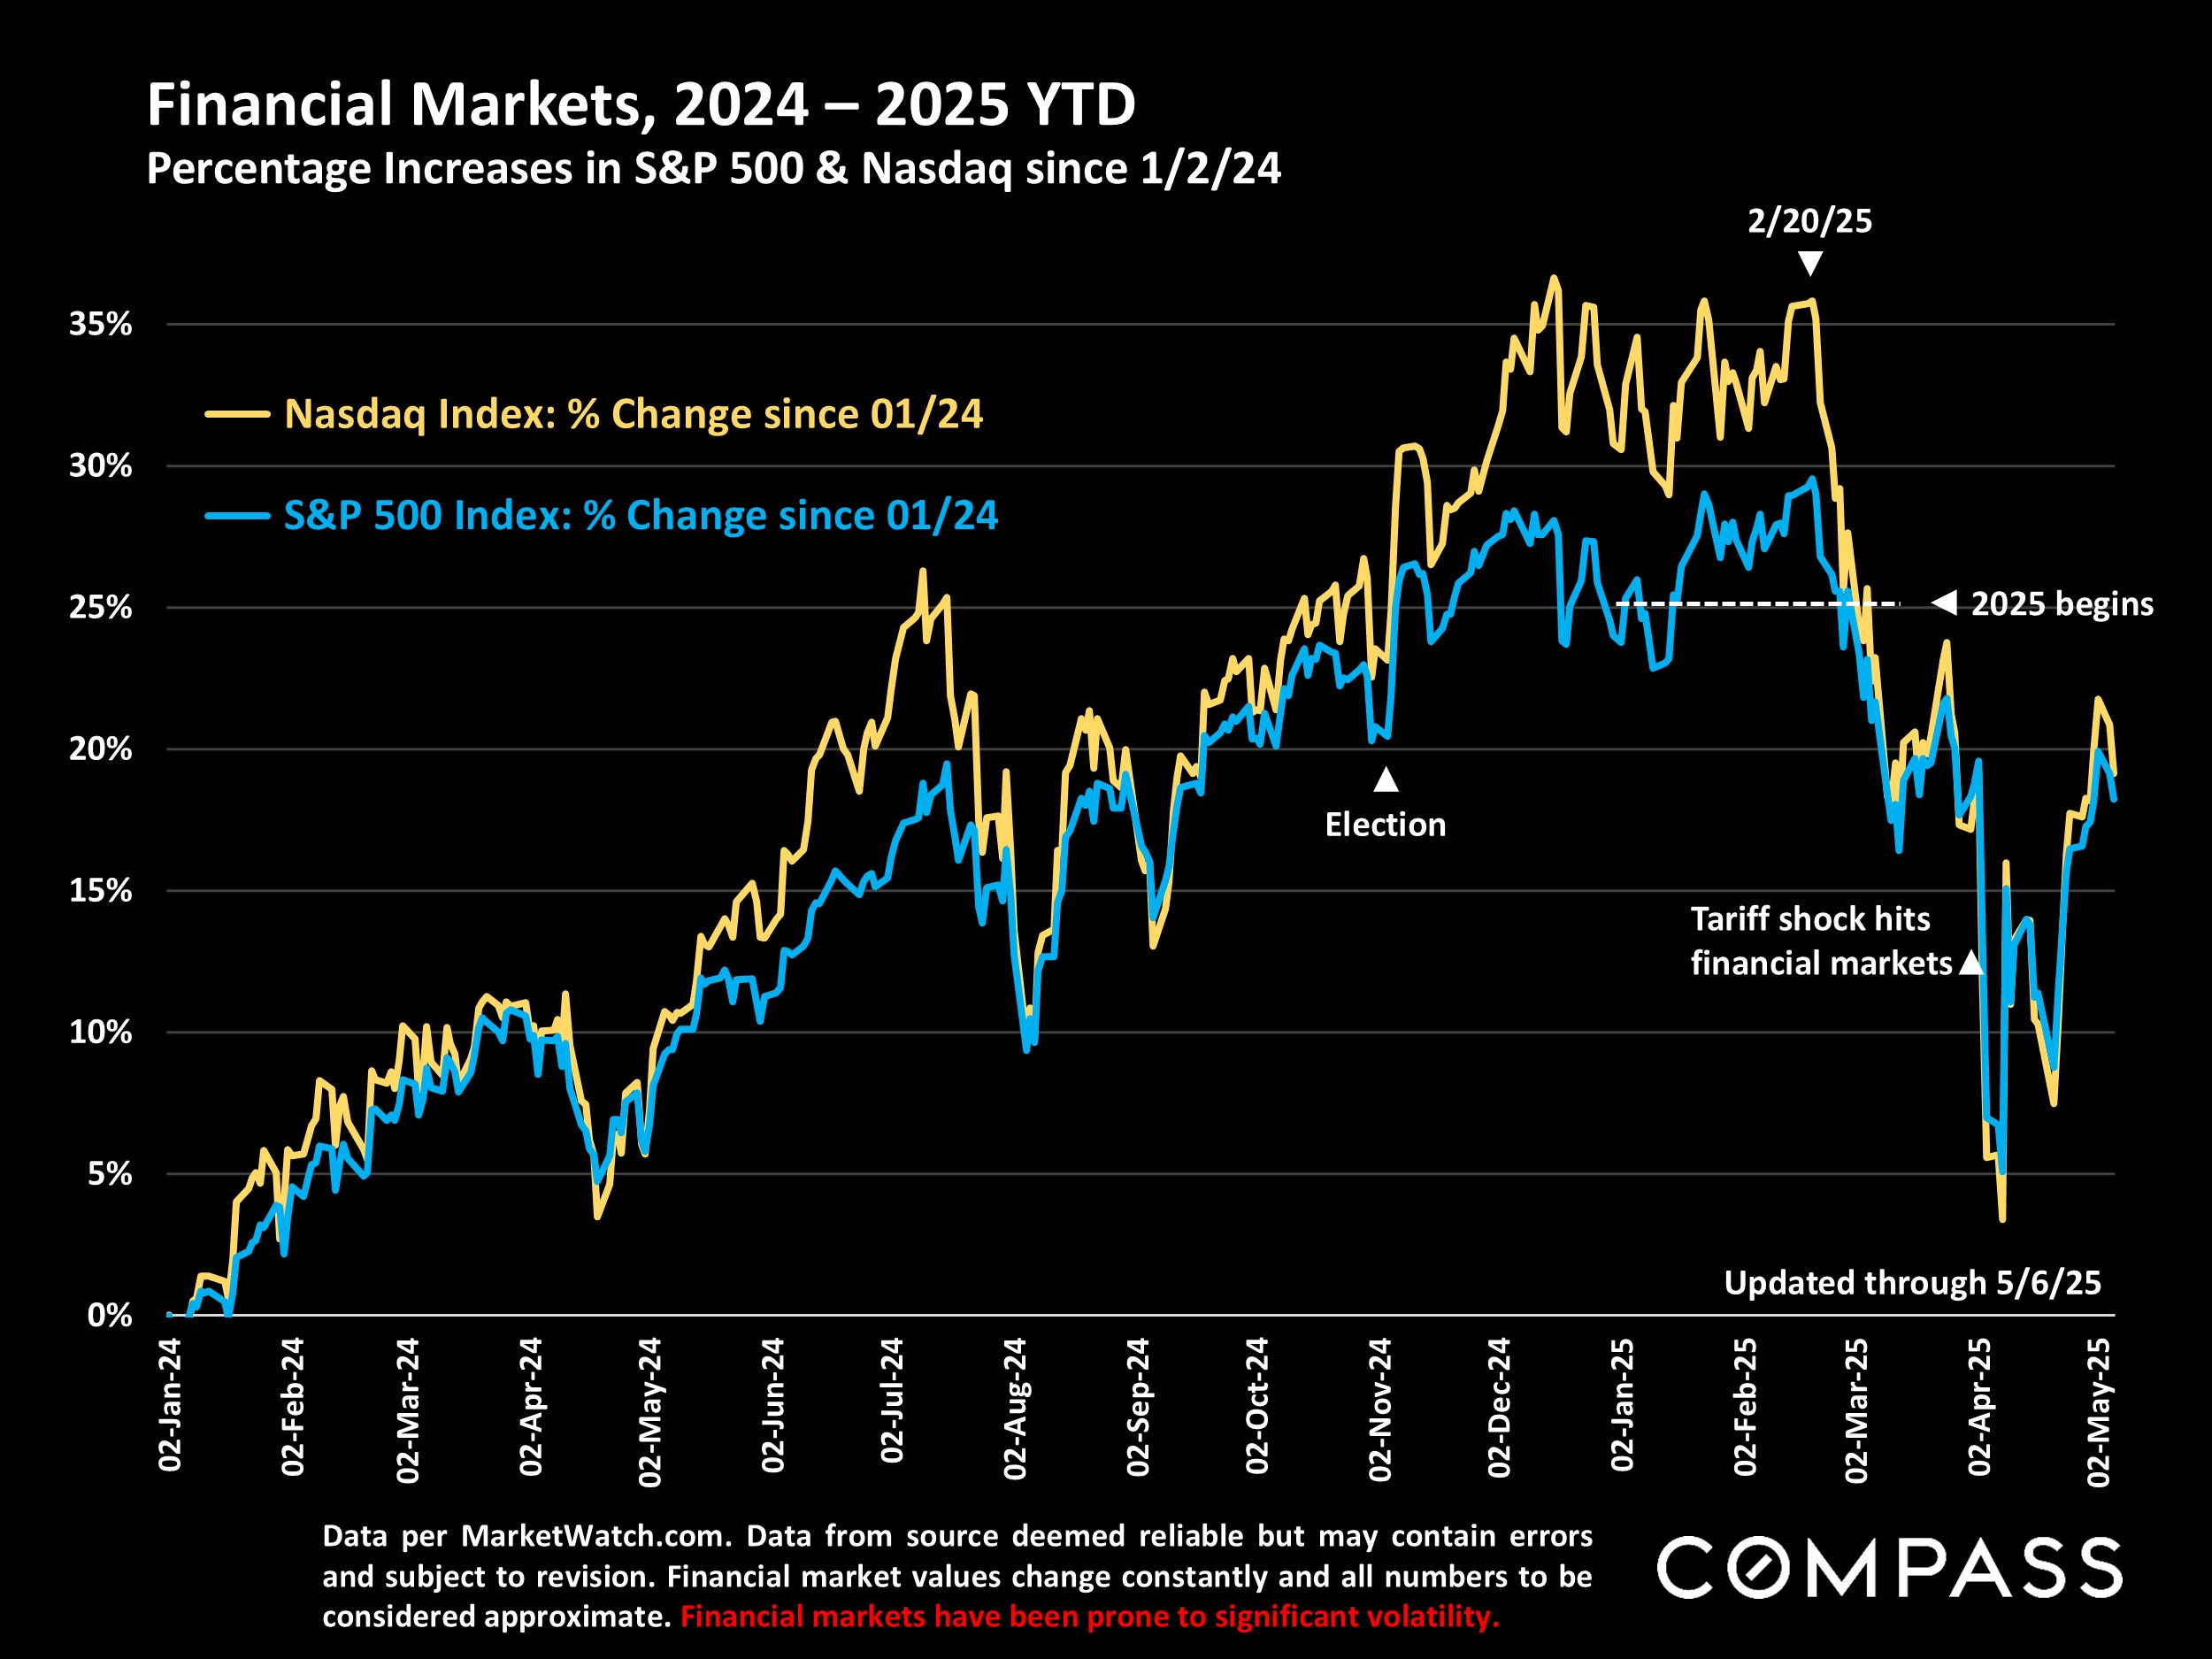
As of early May, the Fed kept its benchmark rate unchanged, mortgage rates continued to hover near 7%, but stock markets substantially recovered from early-April plunges. Consumer confidence saw precipitous declines last month amid the enormous political/economic volatility. Specific San Francisco market data follows in this report but note that April sales statistics reflect many transactions that went into contract before the severe financial market conditions, which began early in the month. May sales data may better reflect April market conditions.


Want to learn more about Bay Area market trends?
Let’s connect! With relationships and networks across the city, there are a variety of ways I can help you make informed real estate decisions. Call, email, or text – I’m here to help.
Contact