
March 10, 2023
SF: March 2023 Market Stats
By Compass
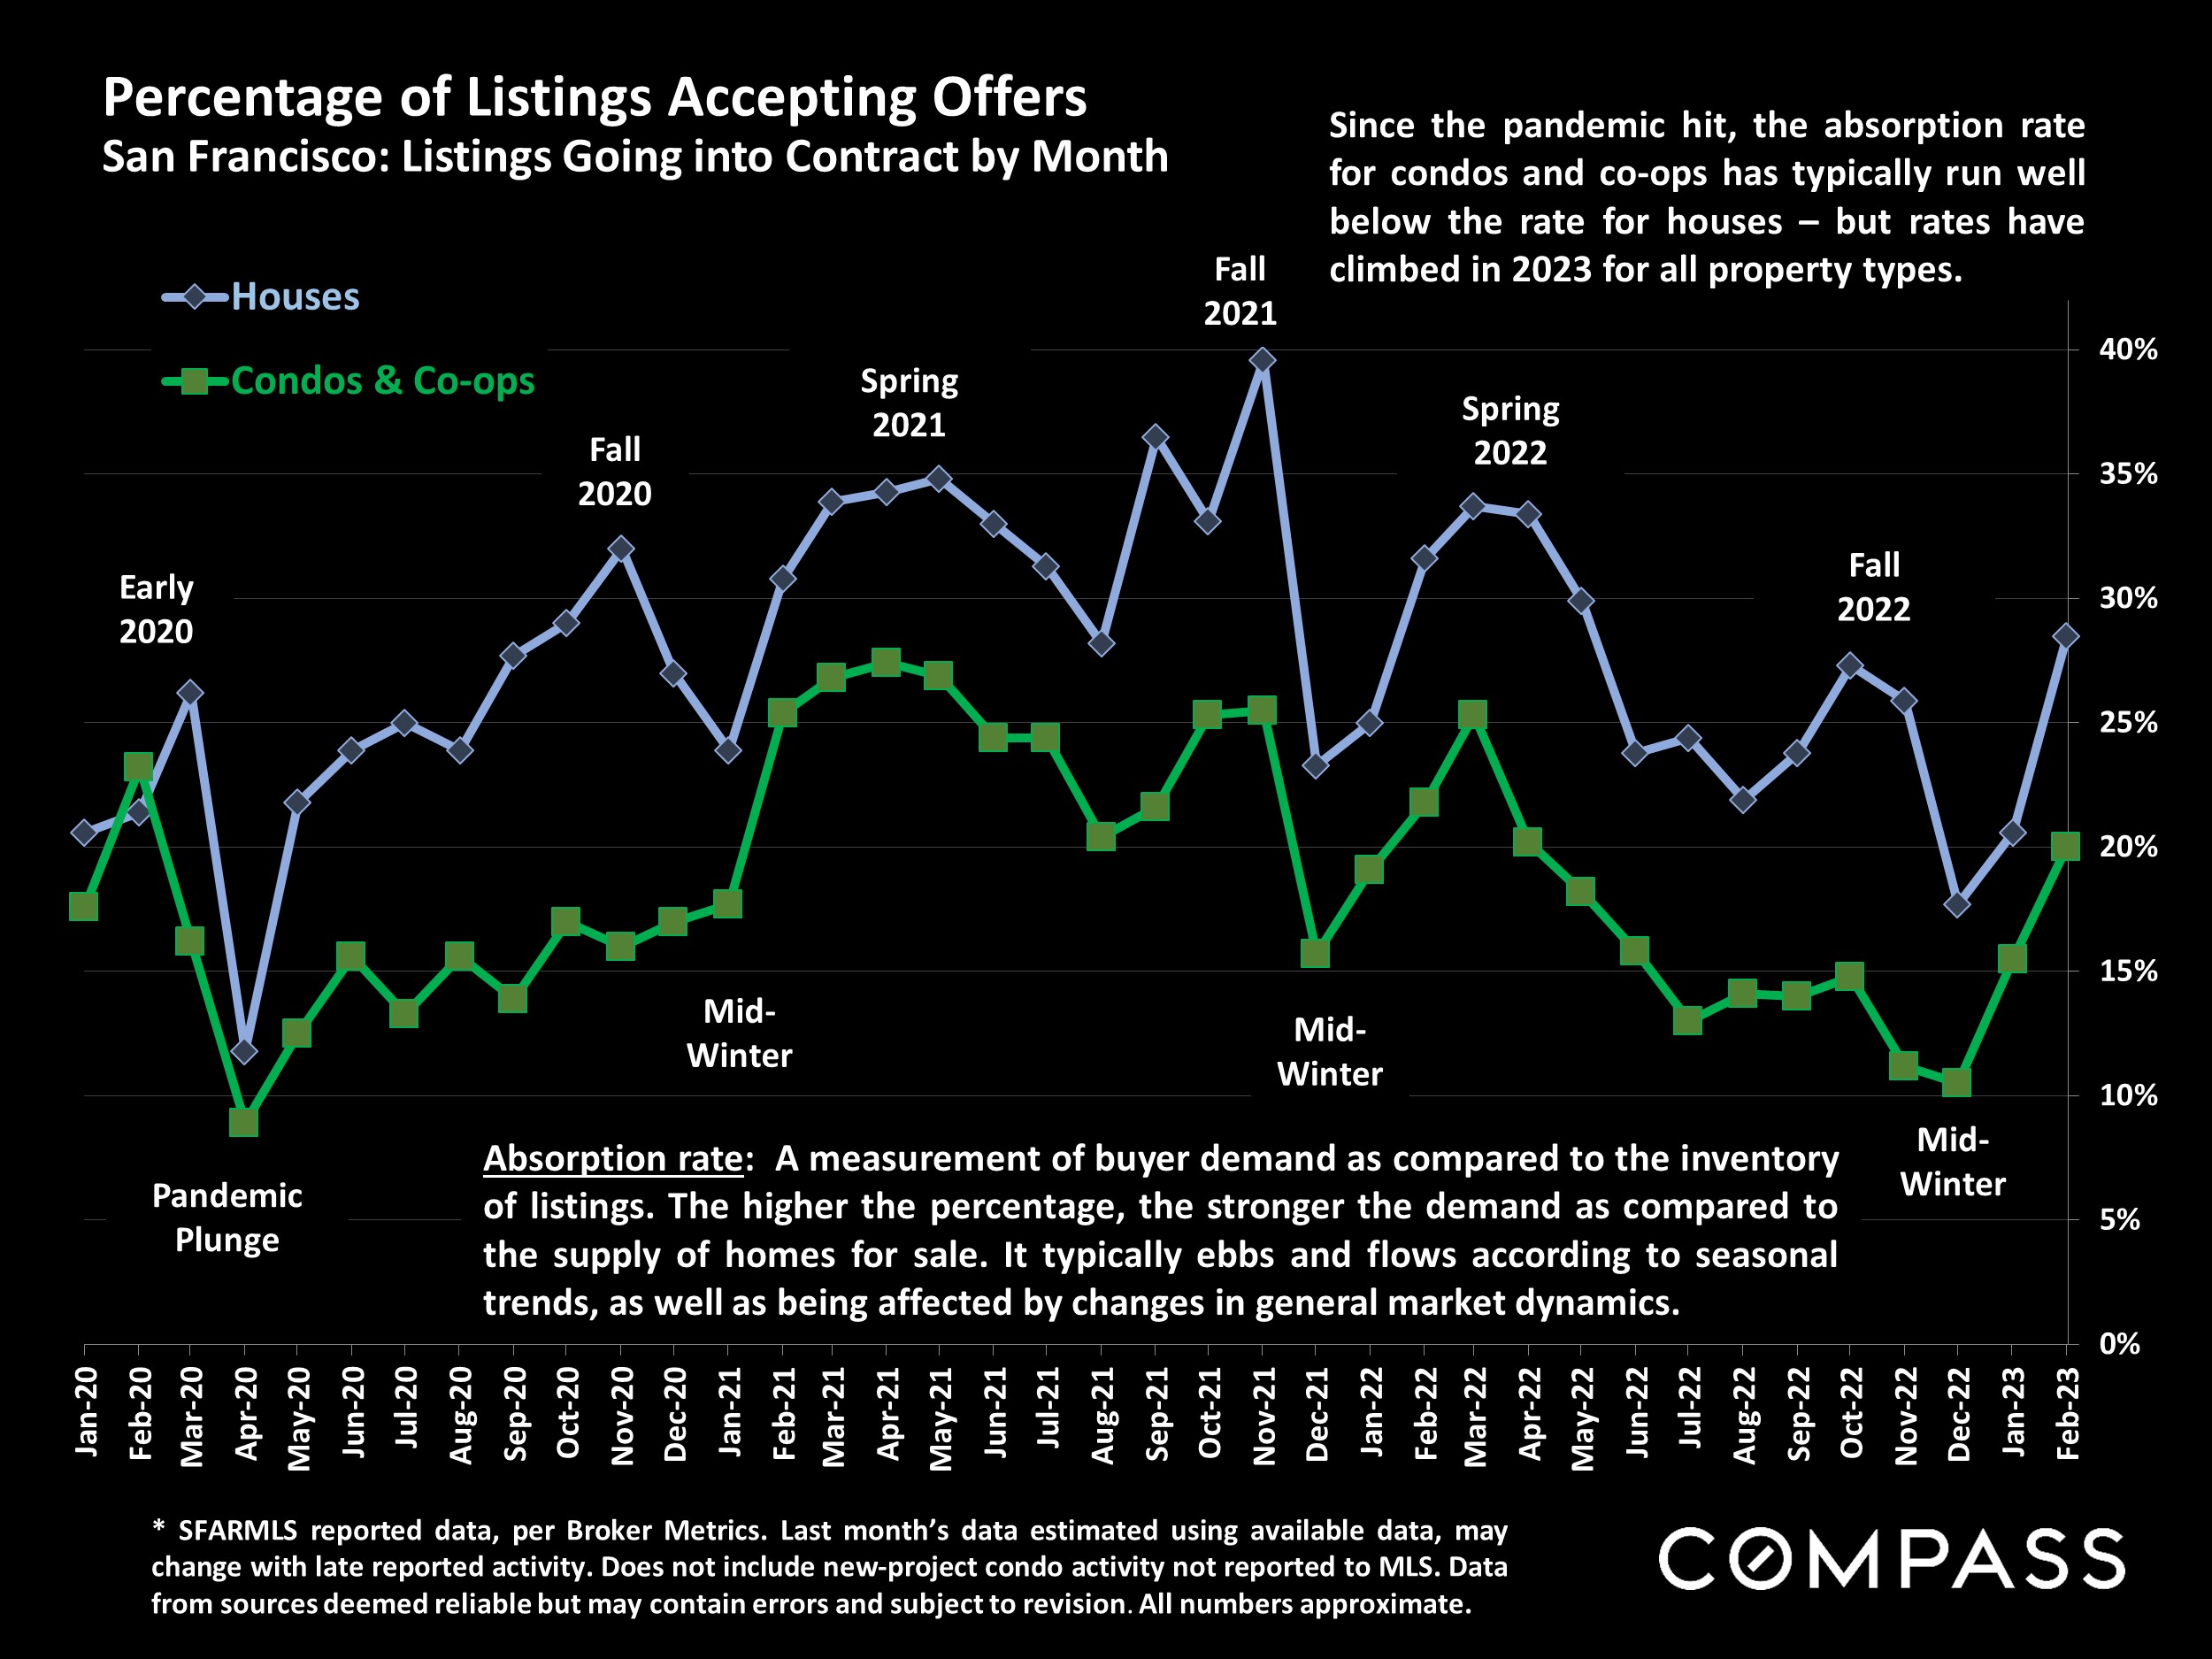
After the acute decline in market activity occurring in the and half of 2022, buyer demand rebounded dramatically and most market indicators turned positive in early 2023: Open house traffic, number of offers, and overbidding and absorption rates all saw improvement.
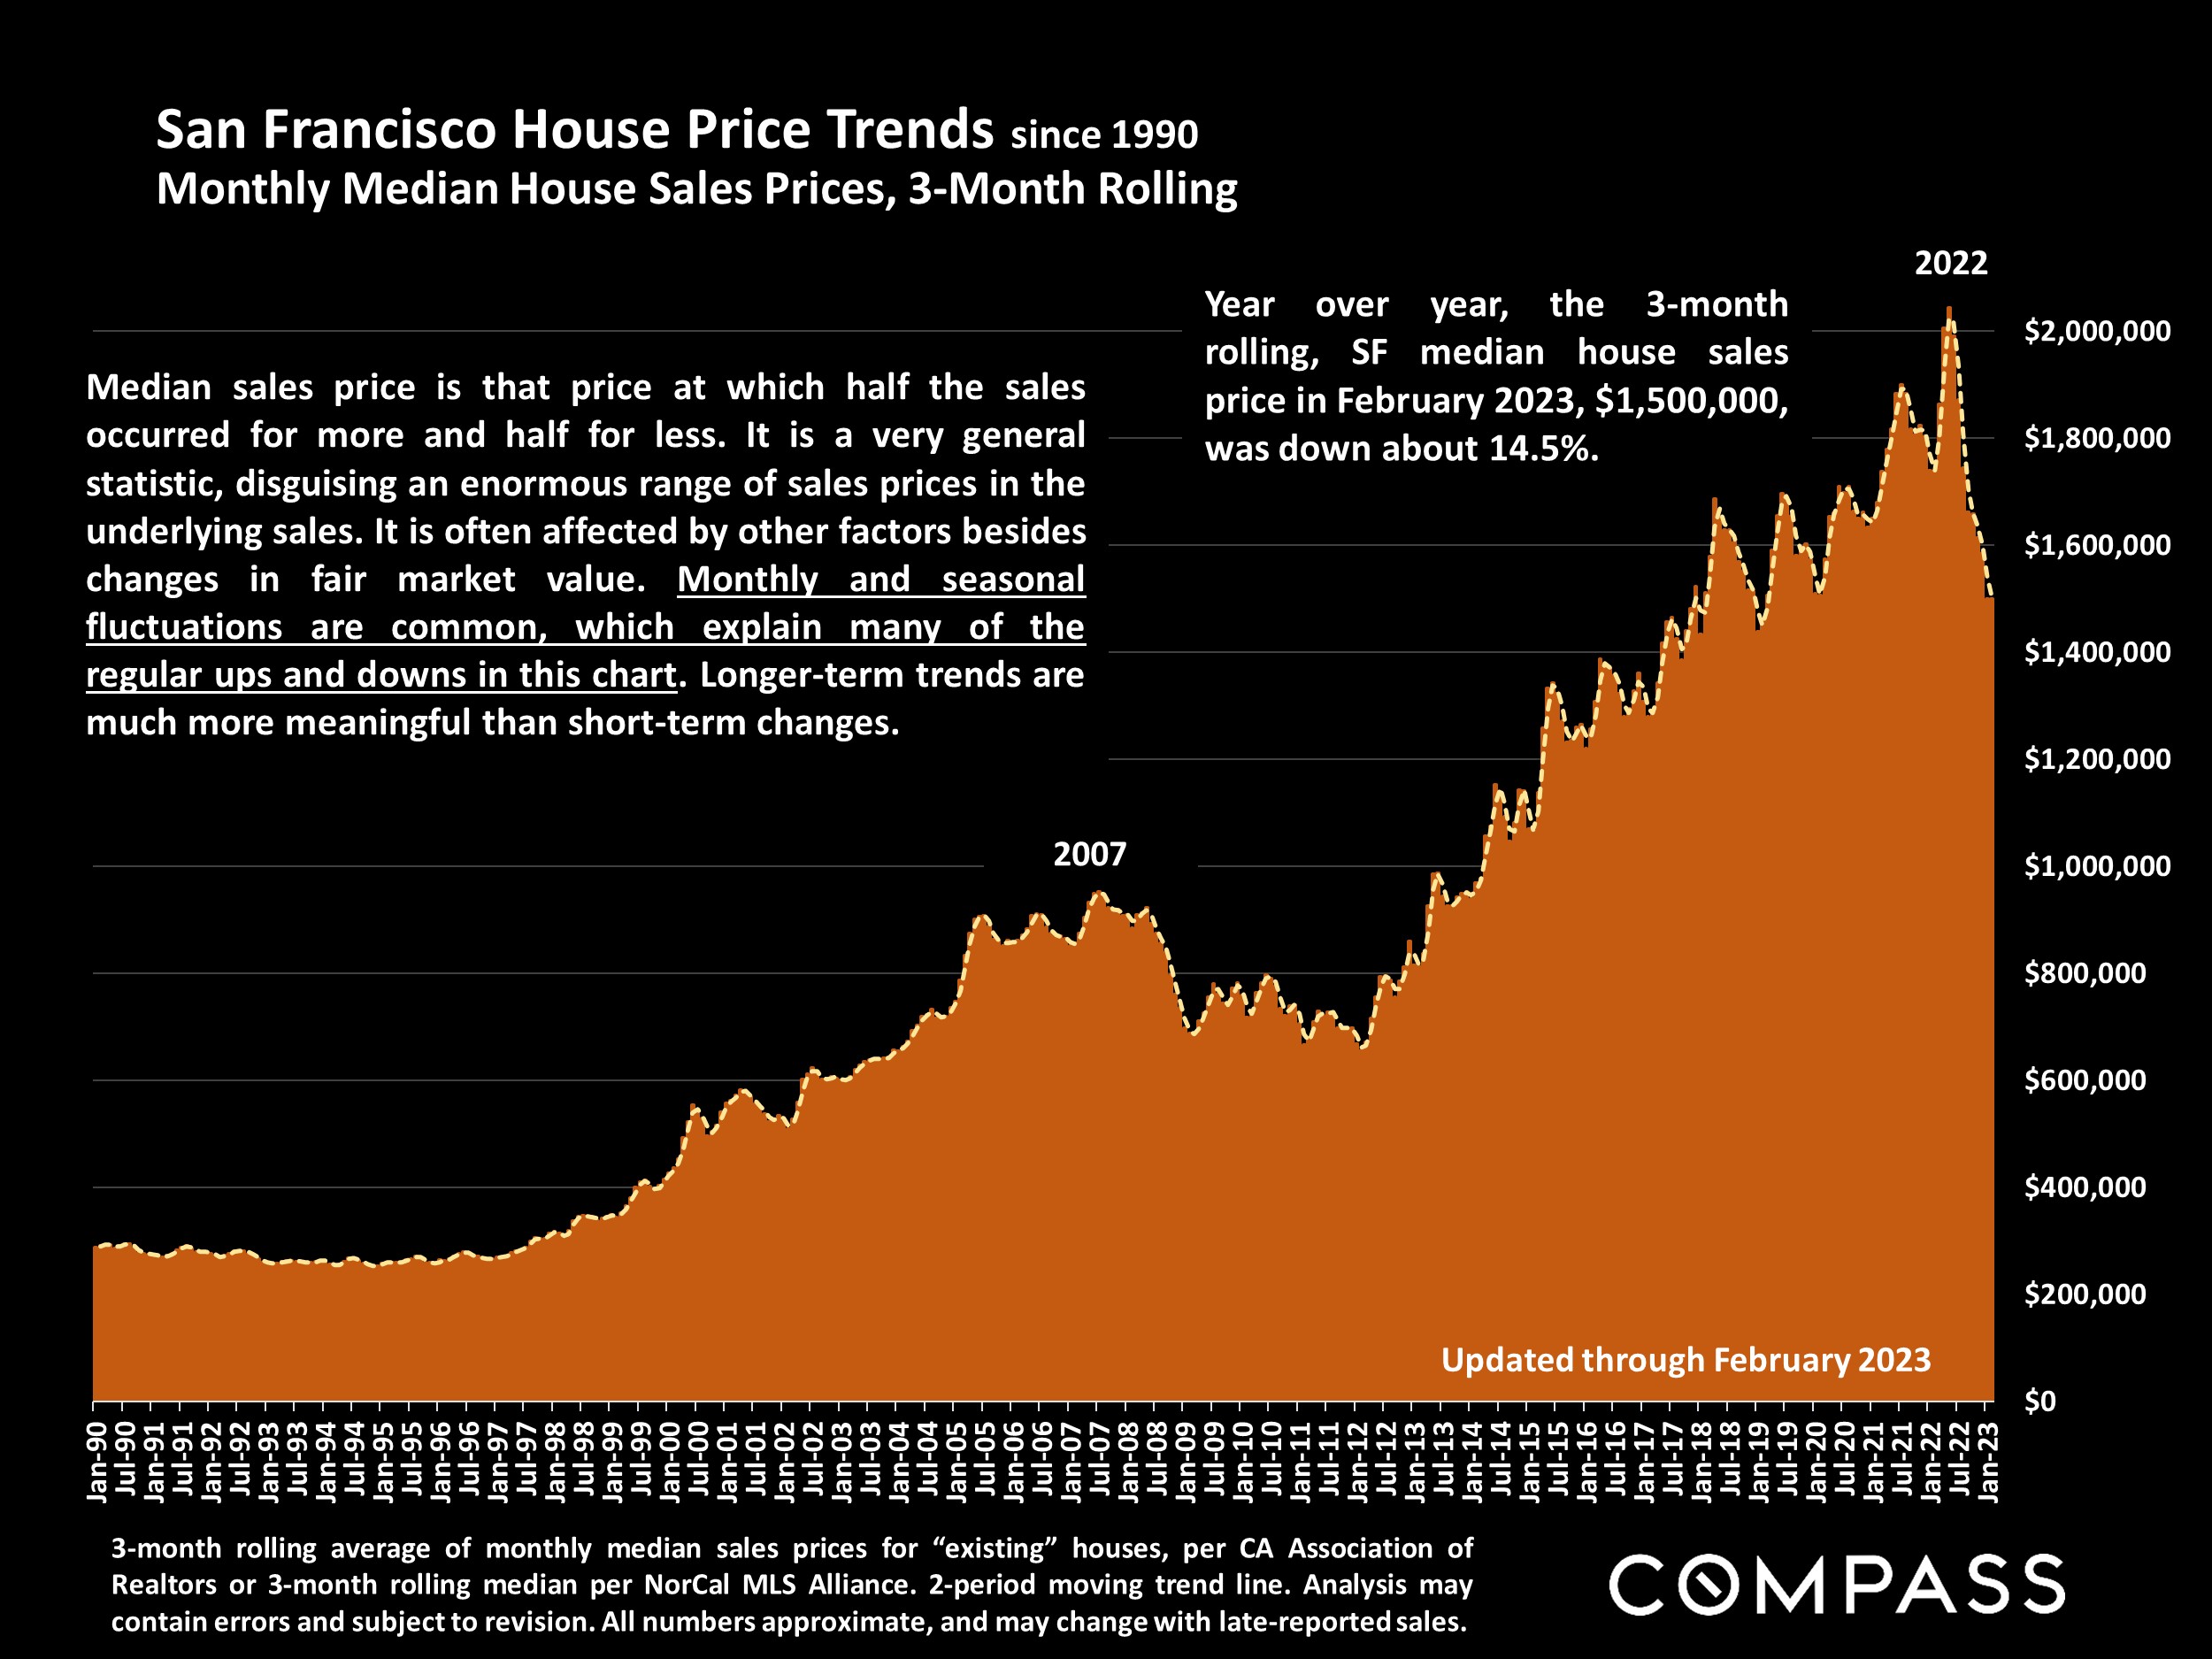
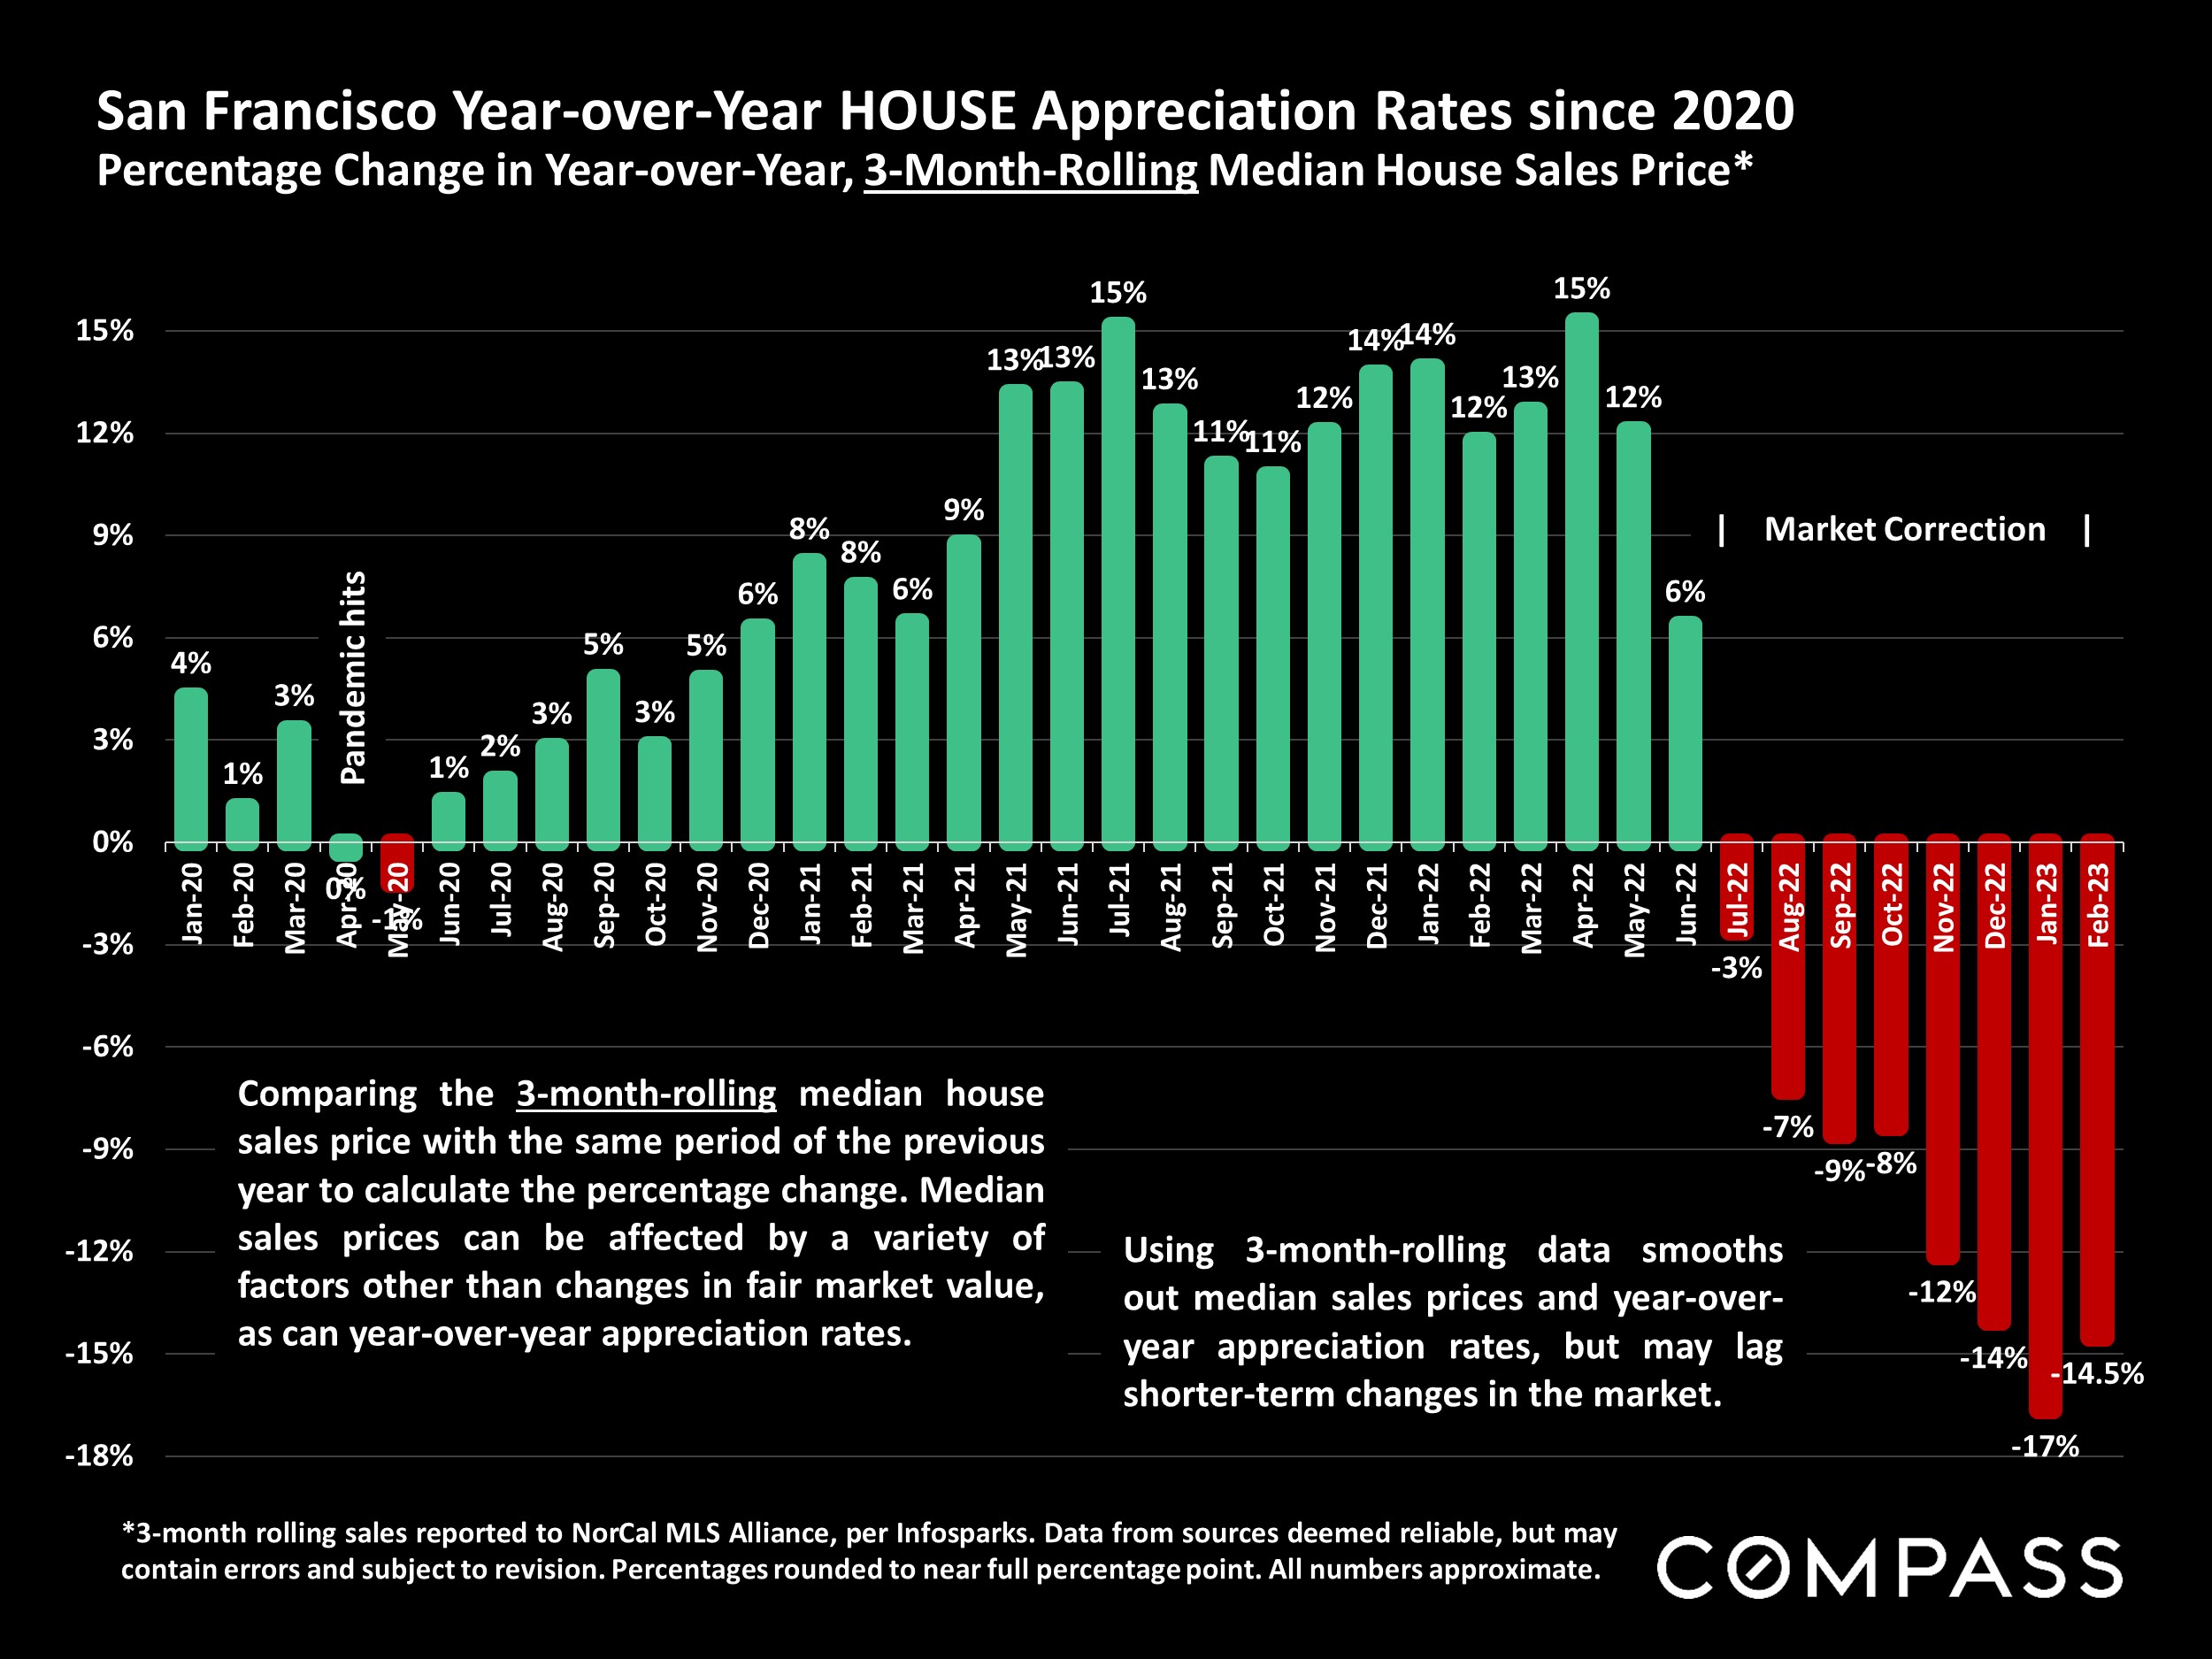
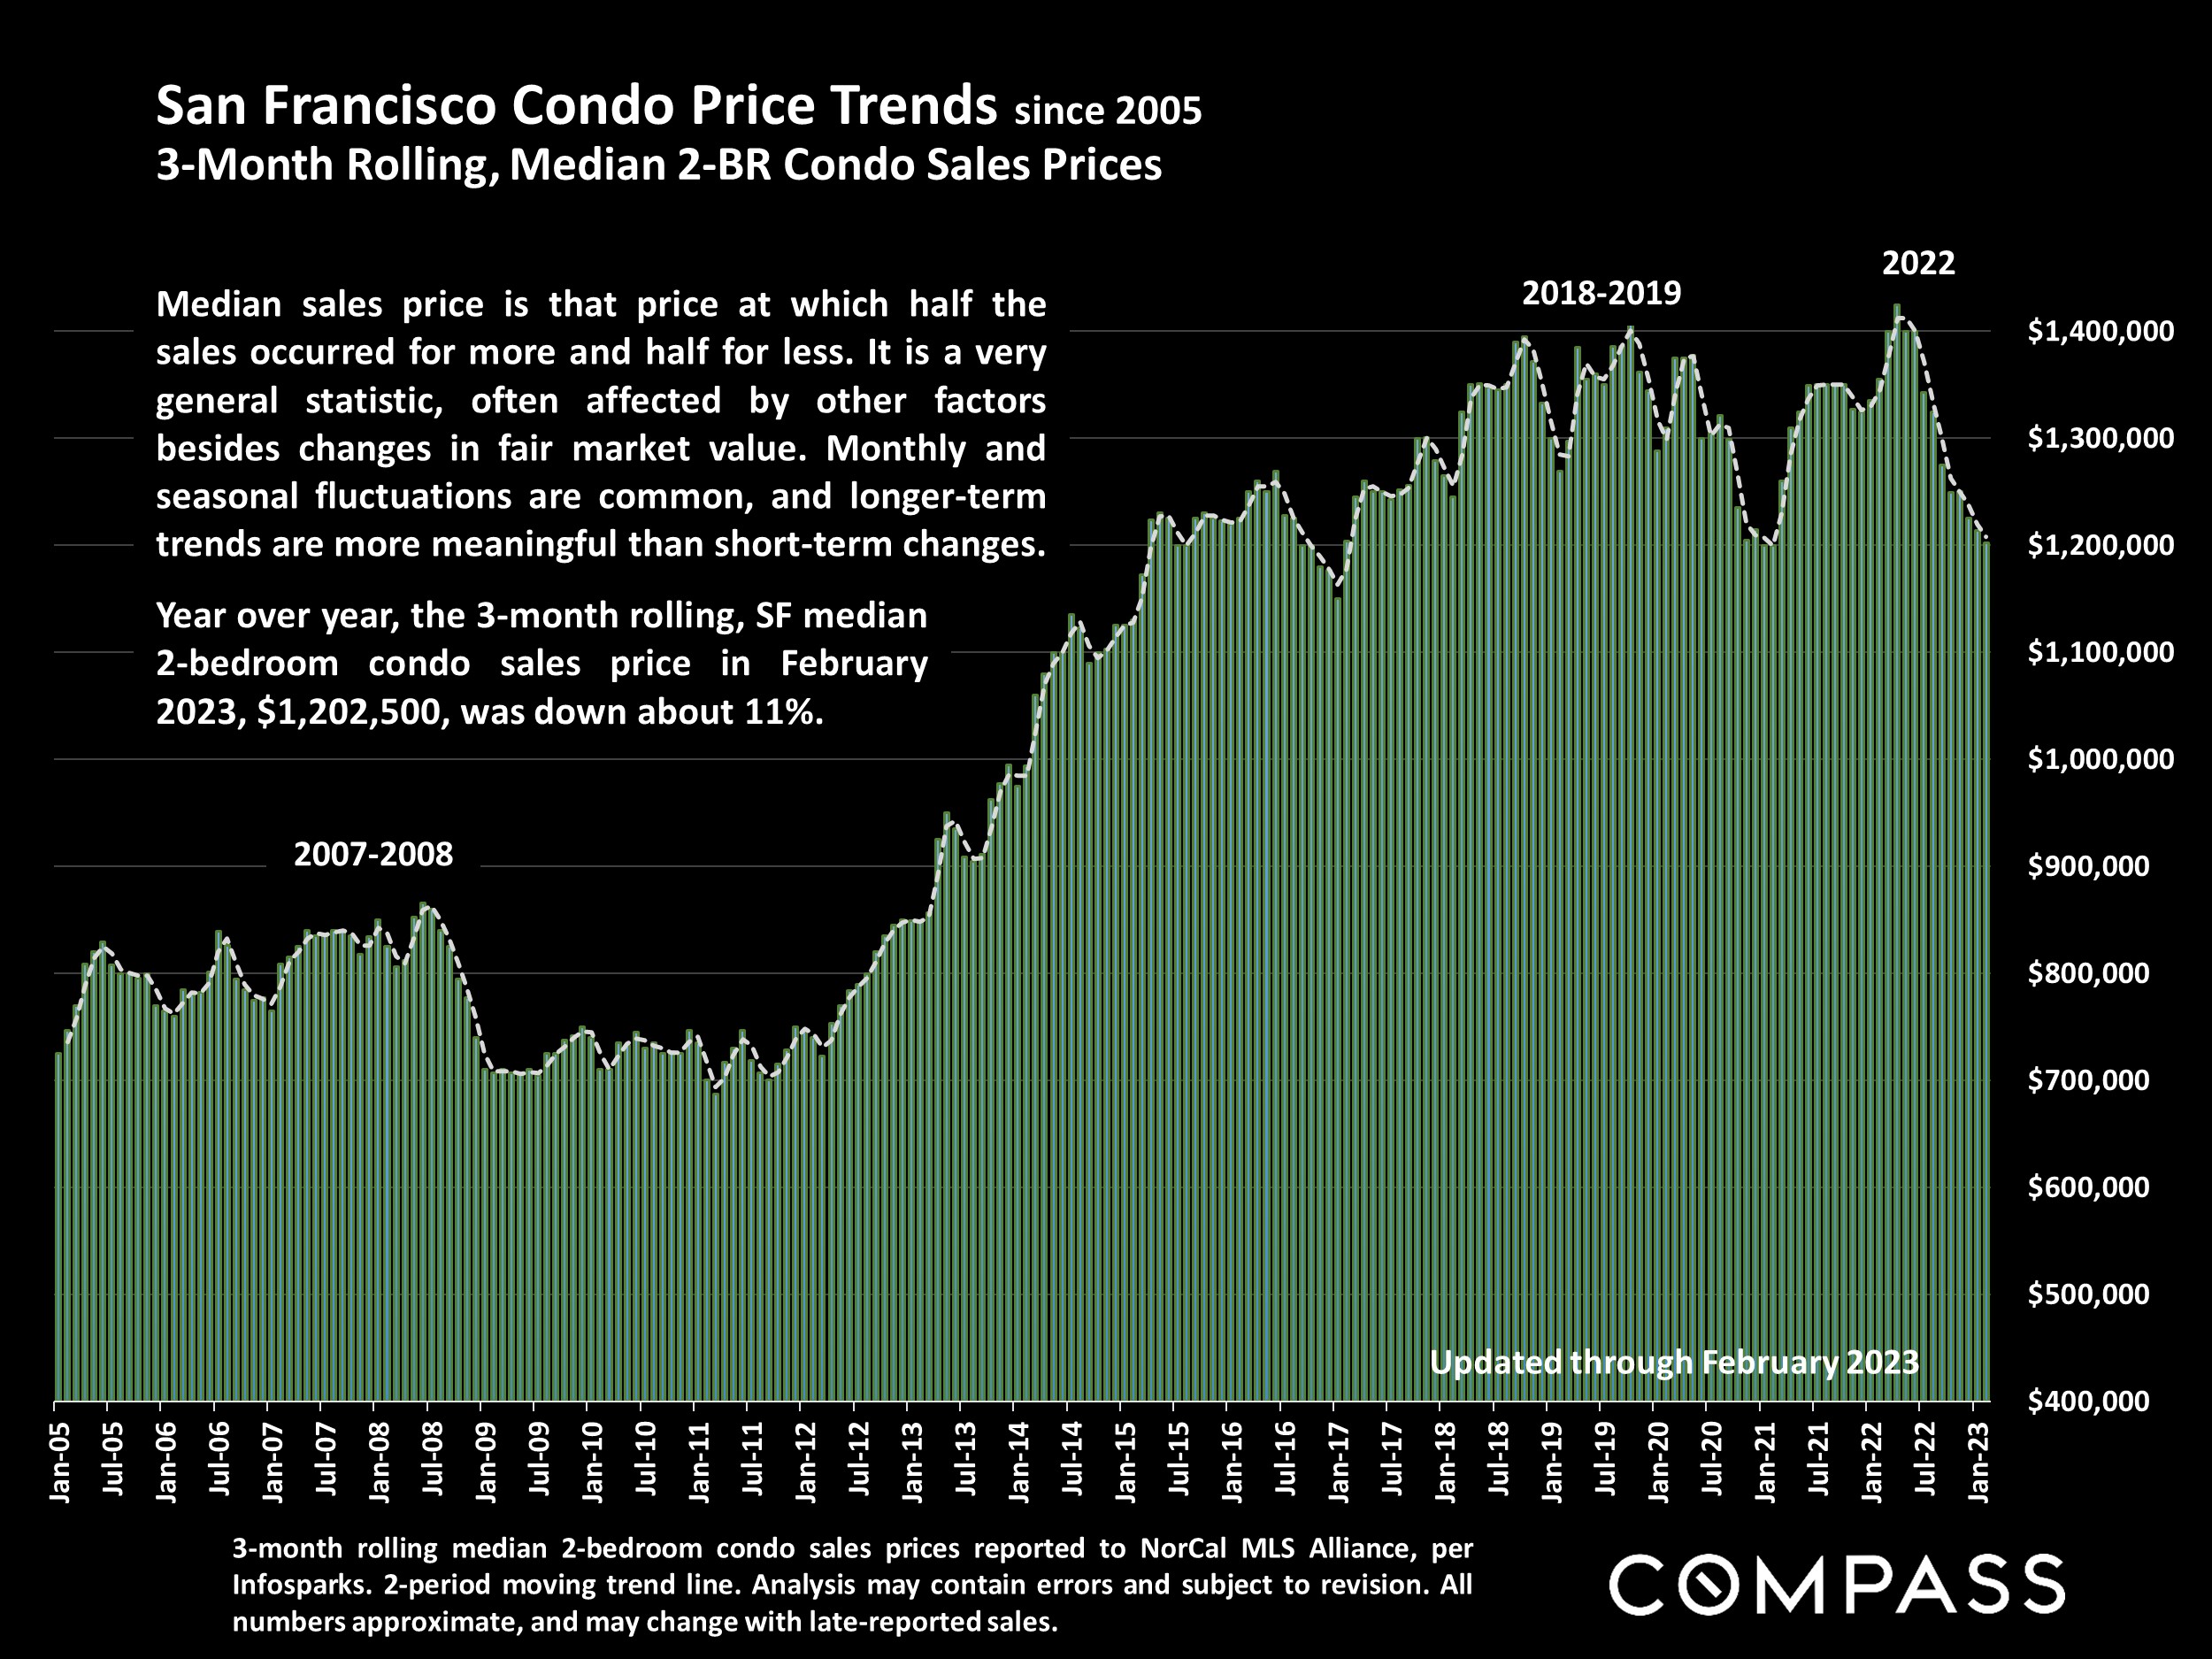
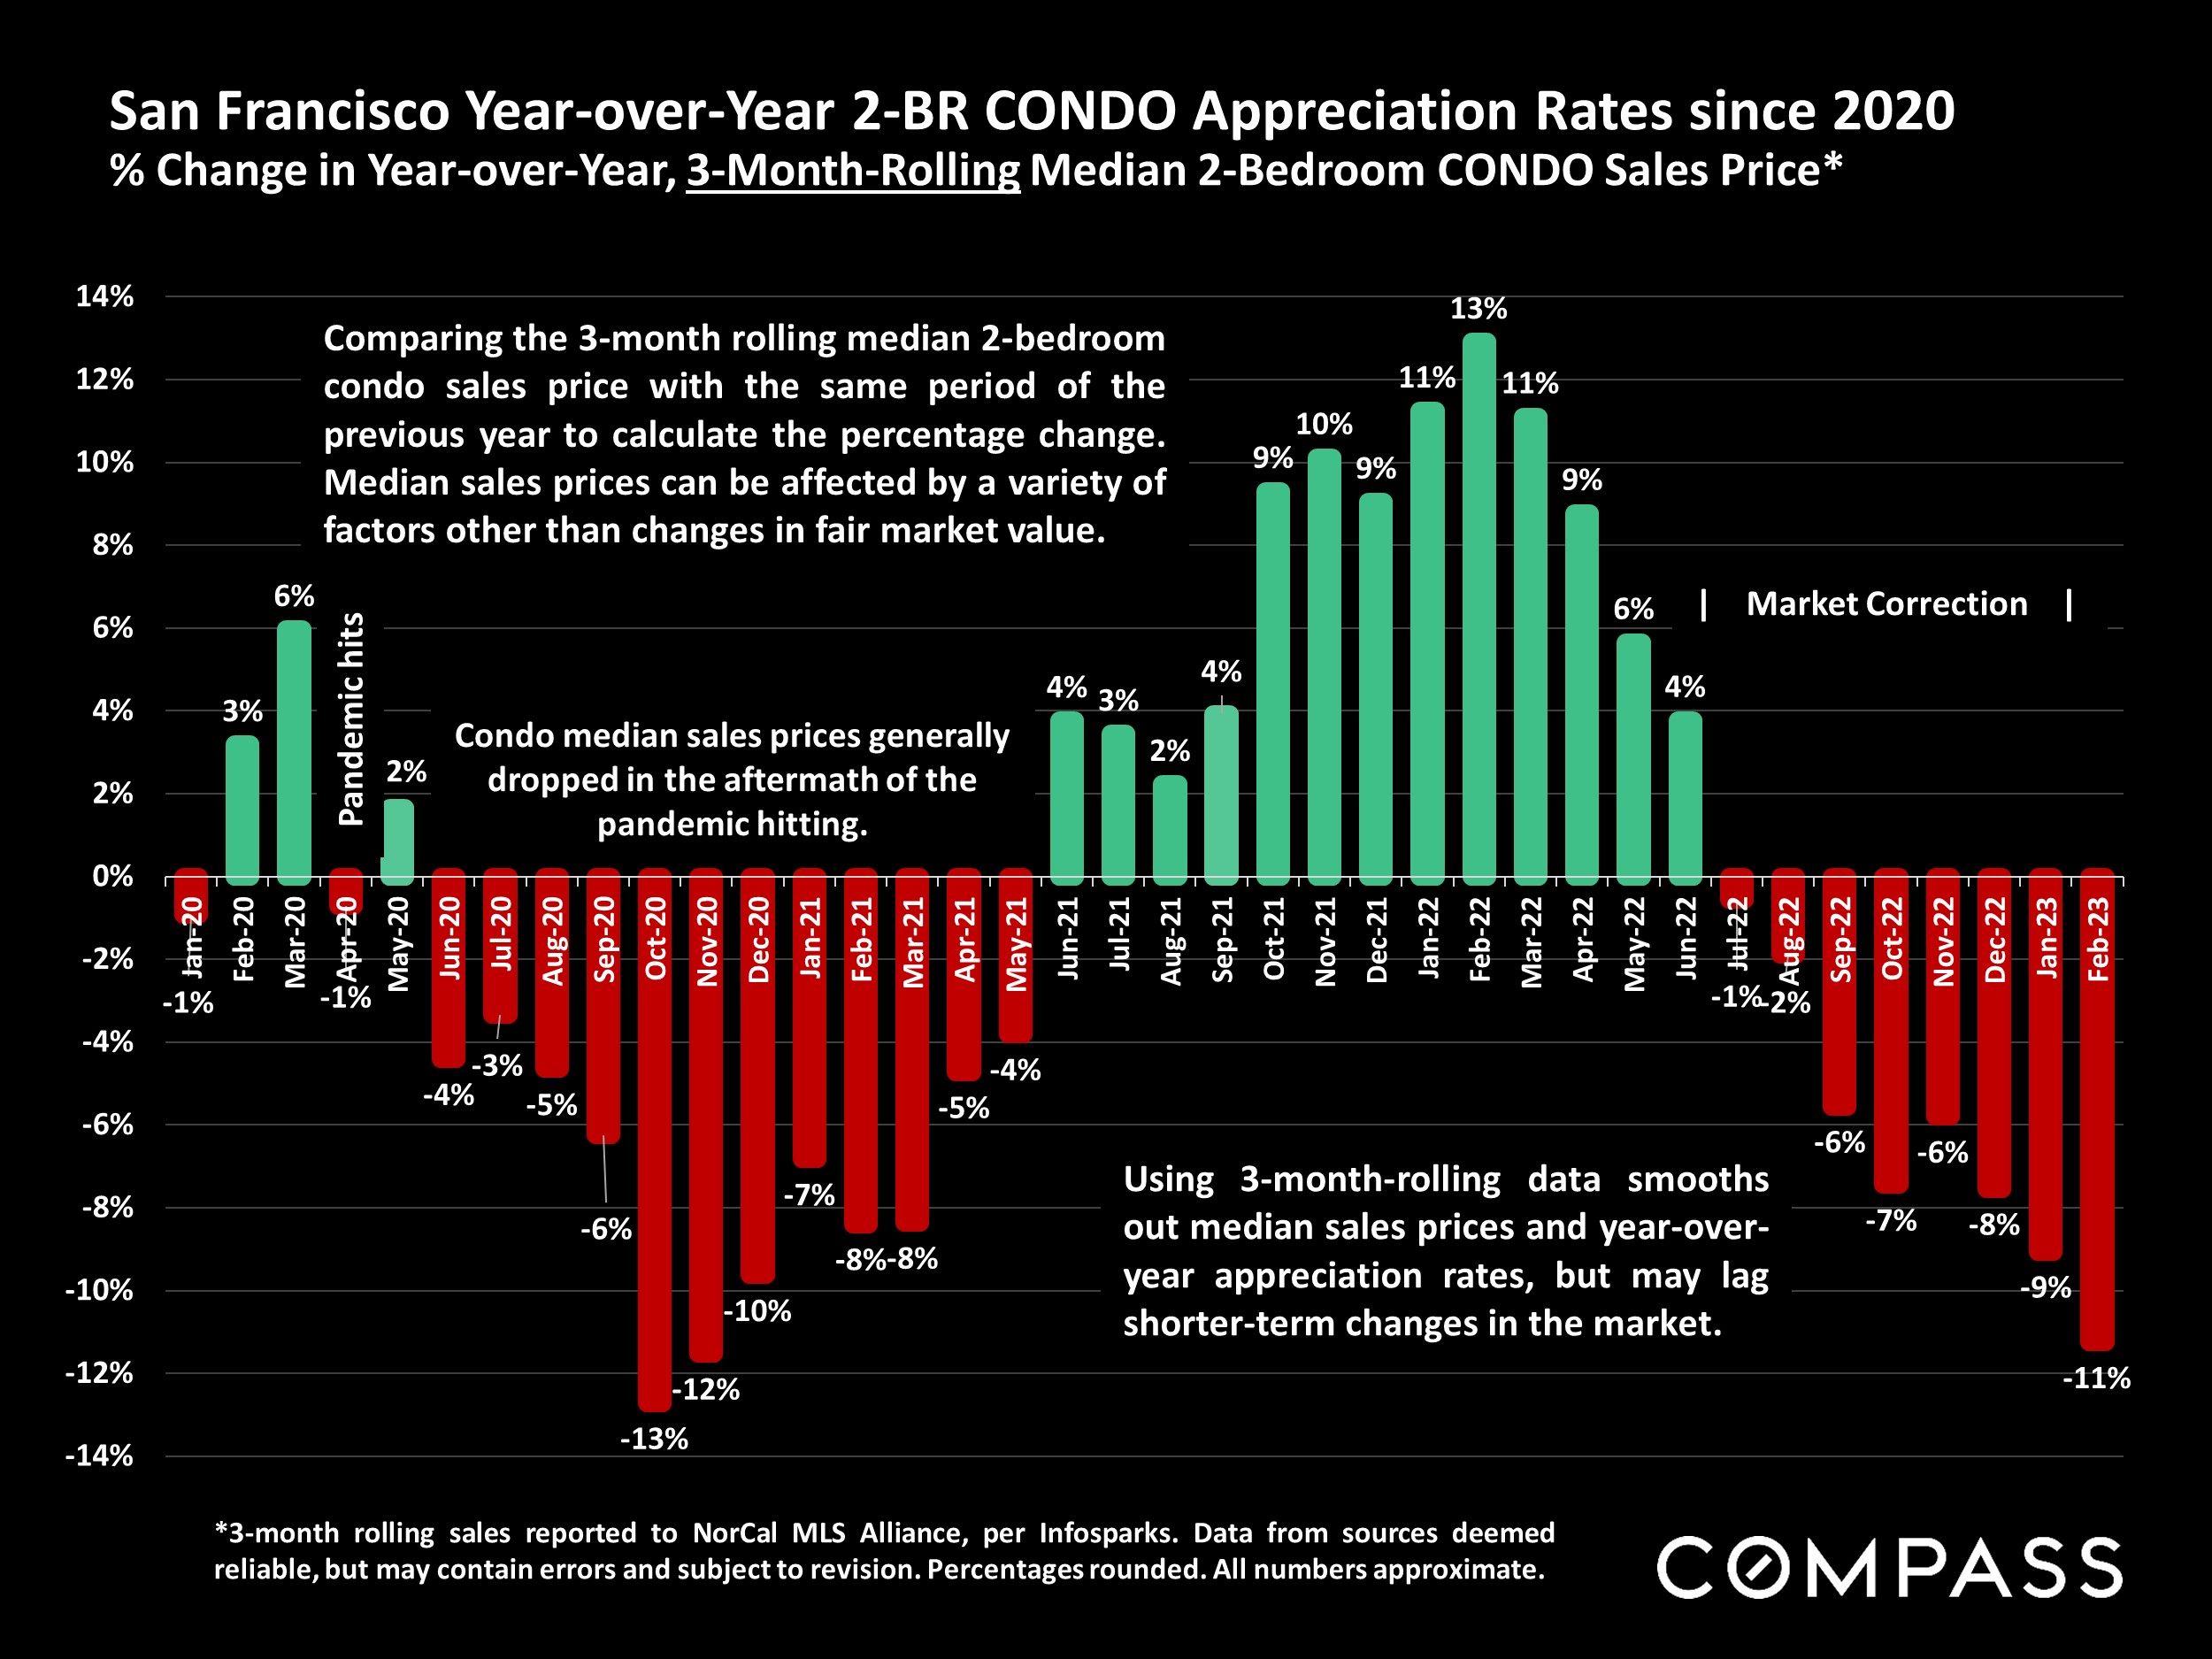
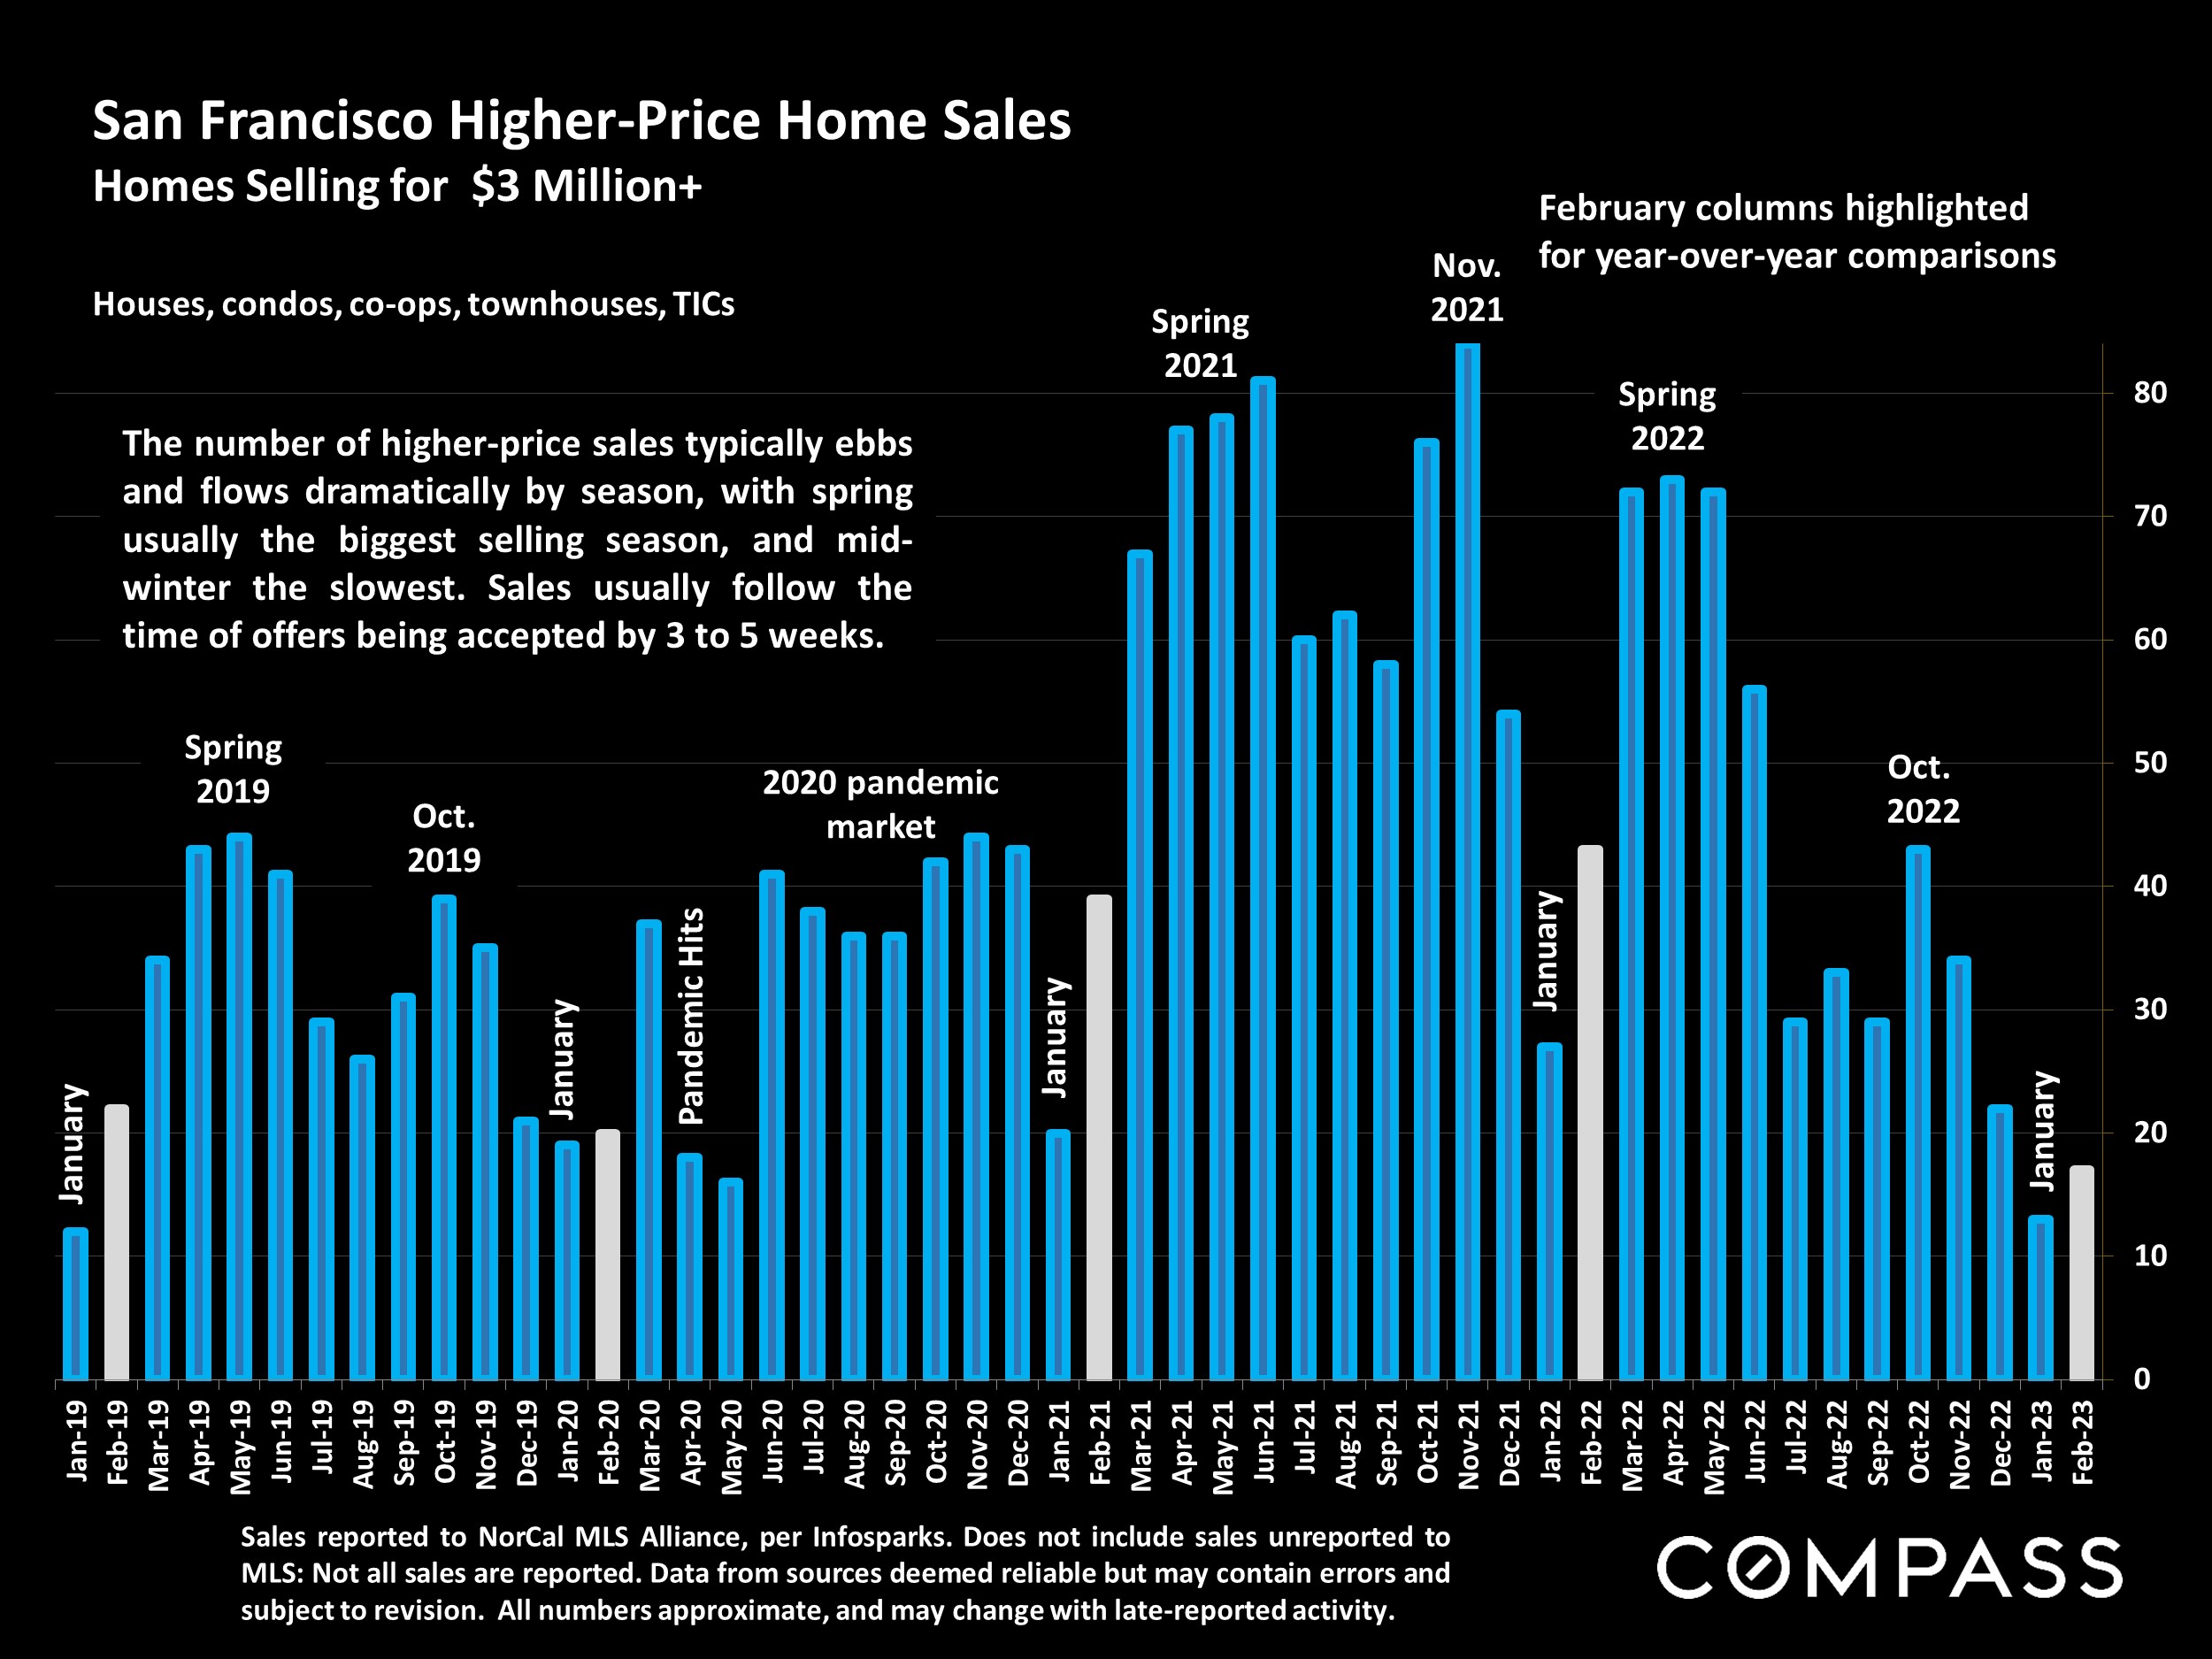
It is too early for significant effects to show up in home prices: Indeed, through February, 3-month-rolling median house sales prices saw year-over-year declines across all Bay Area counties (These percentage declines should be regarded cautiously until substantiated over the longer term.) Even with the striking improvement in demand over late 2022, most year-over-year indicators remain depressed, but these comparisons are with the severely overheated conditions prevailing at the peak of a 10-year housing market upcycle.
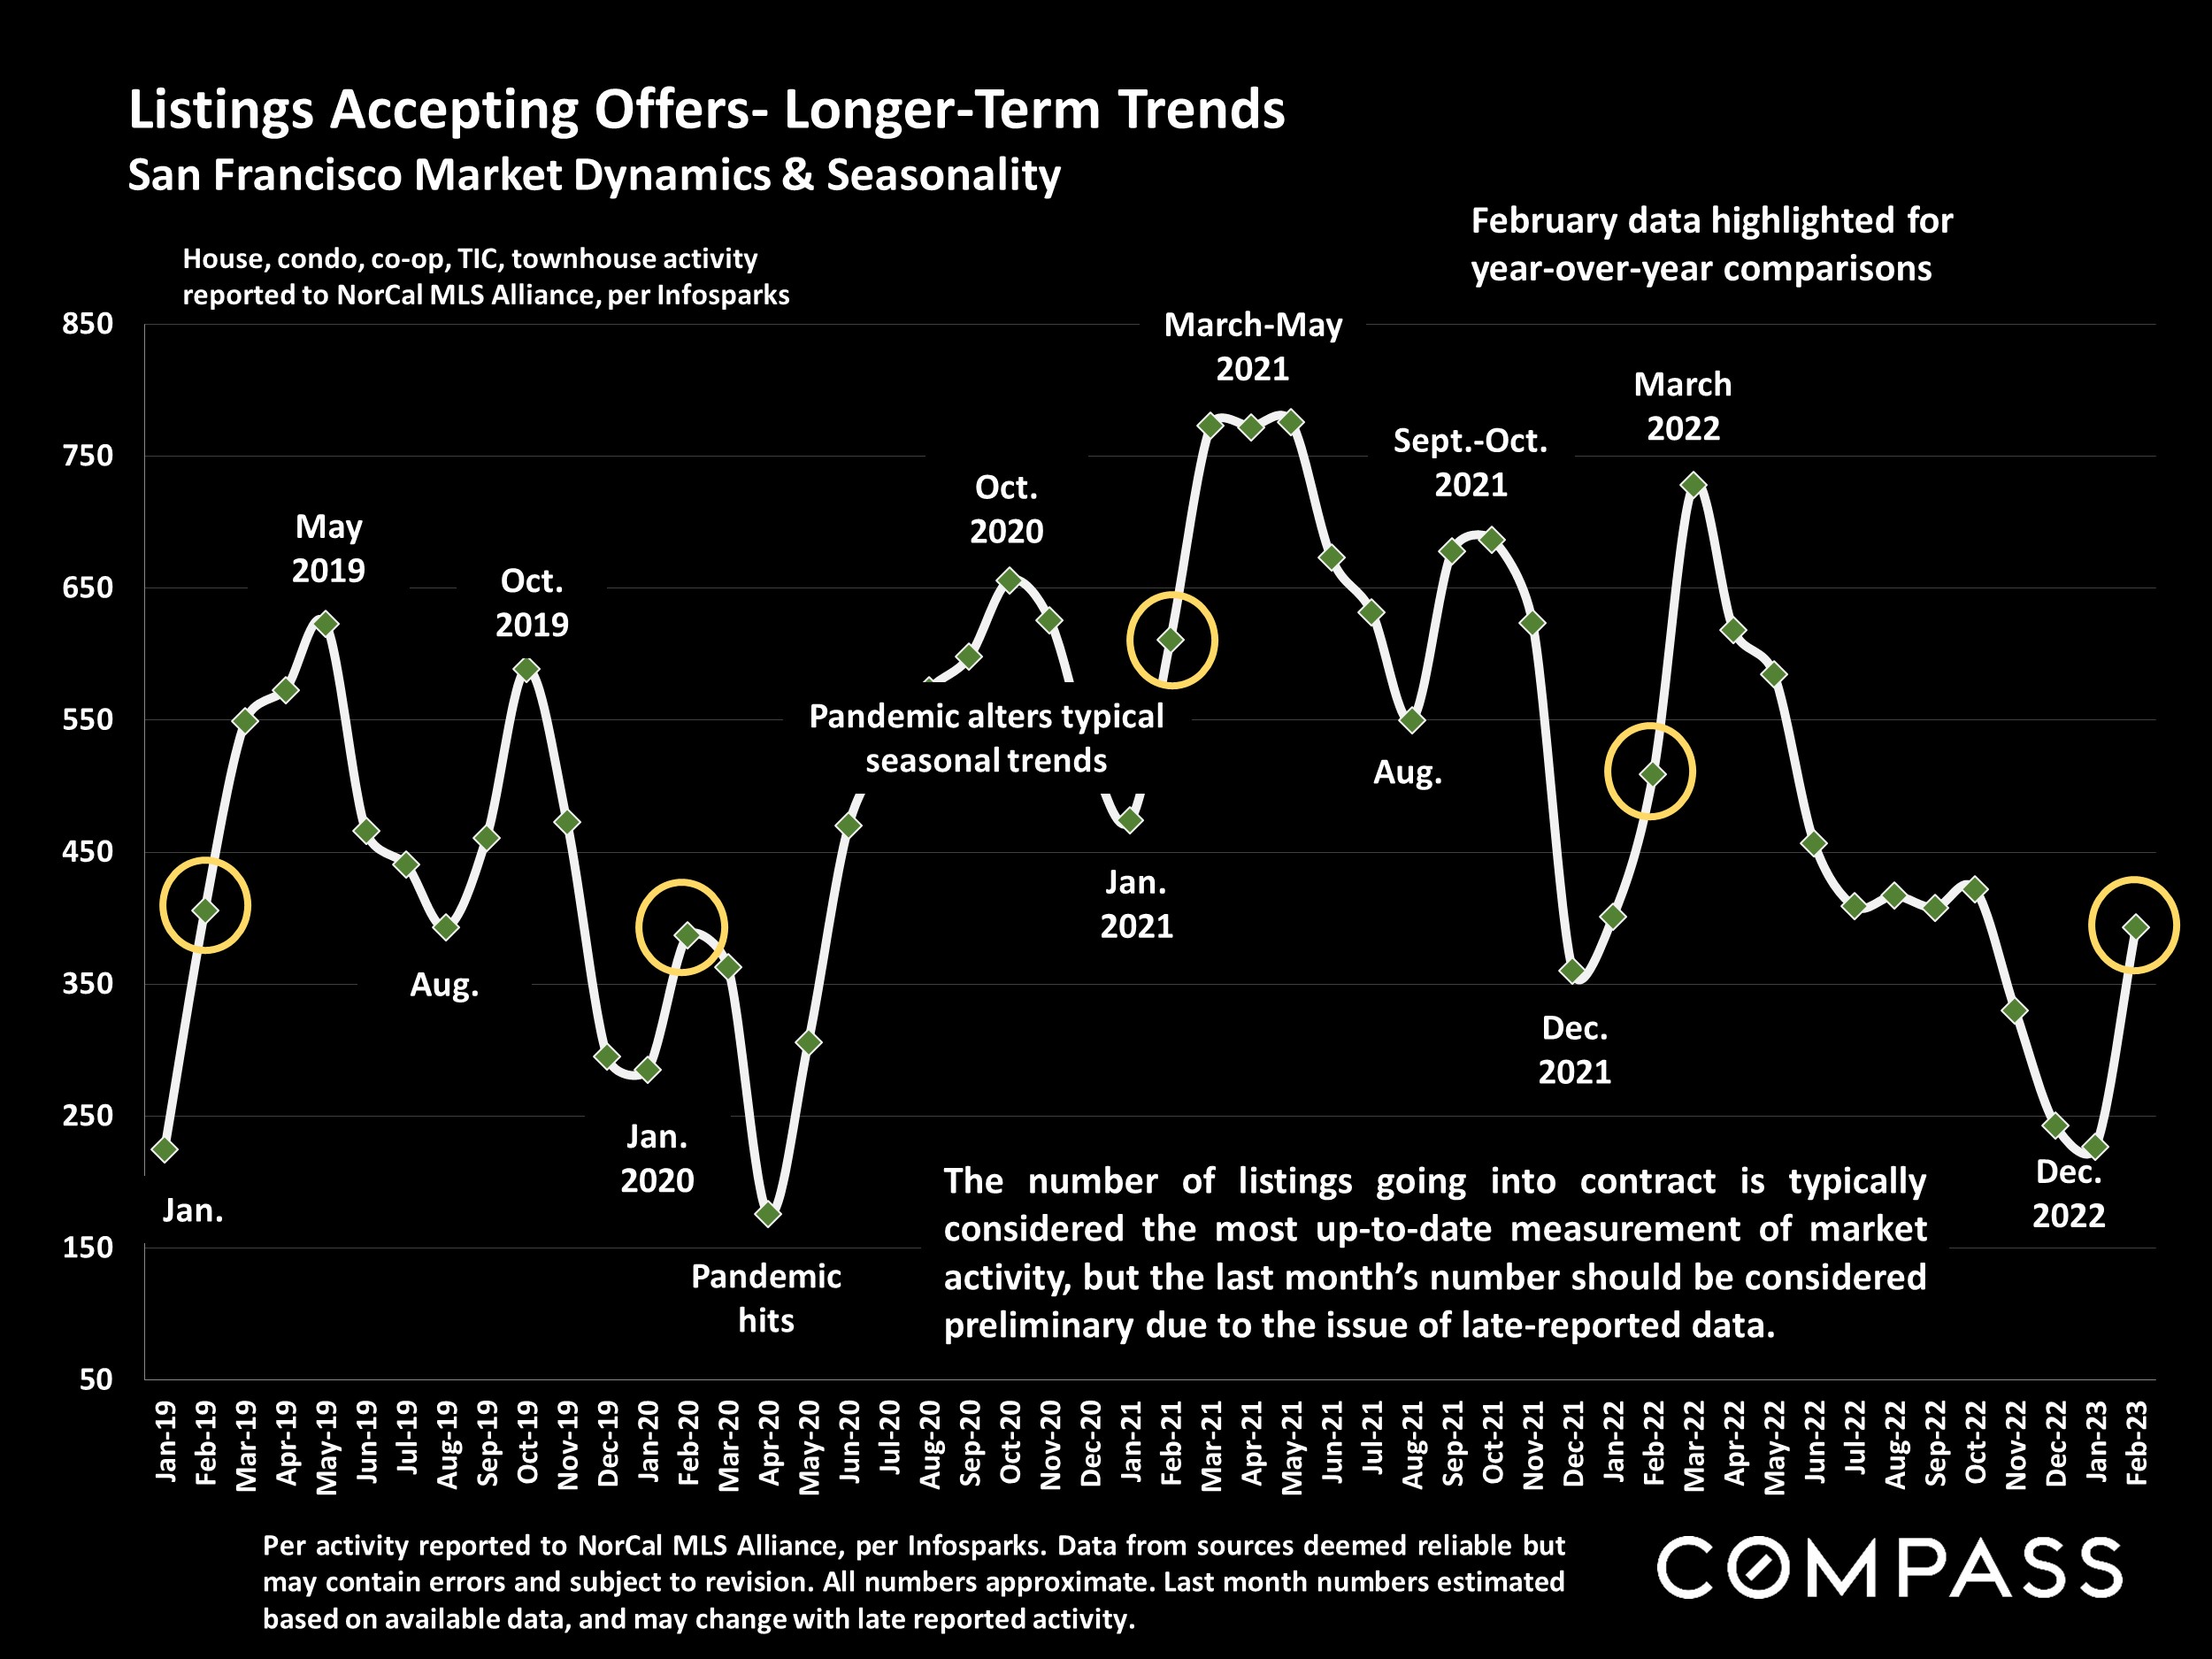
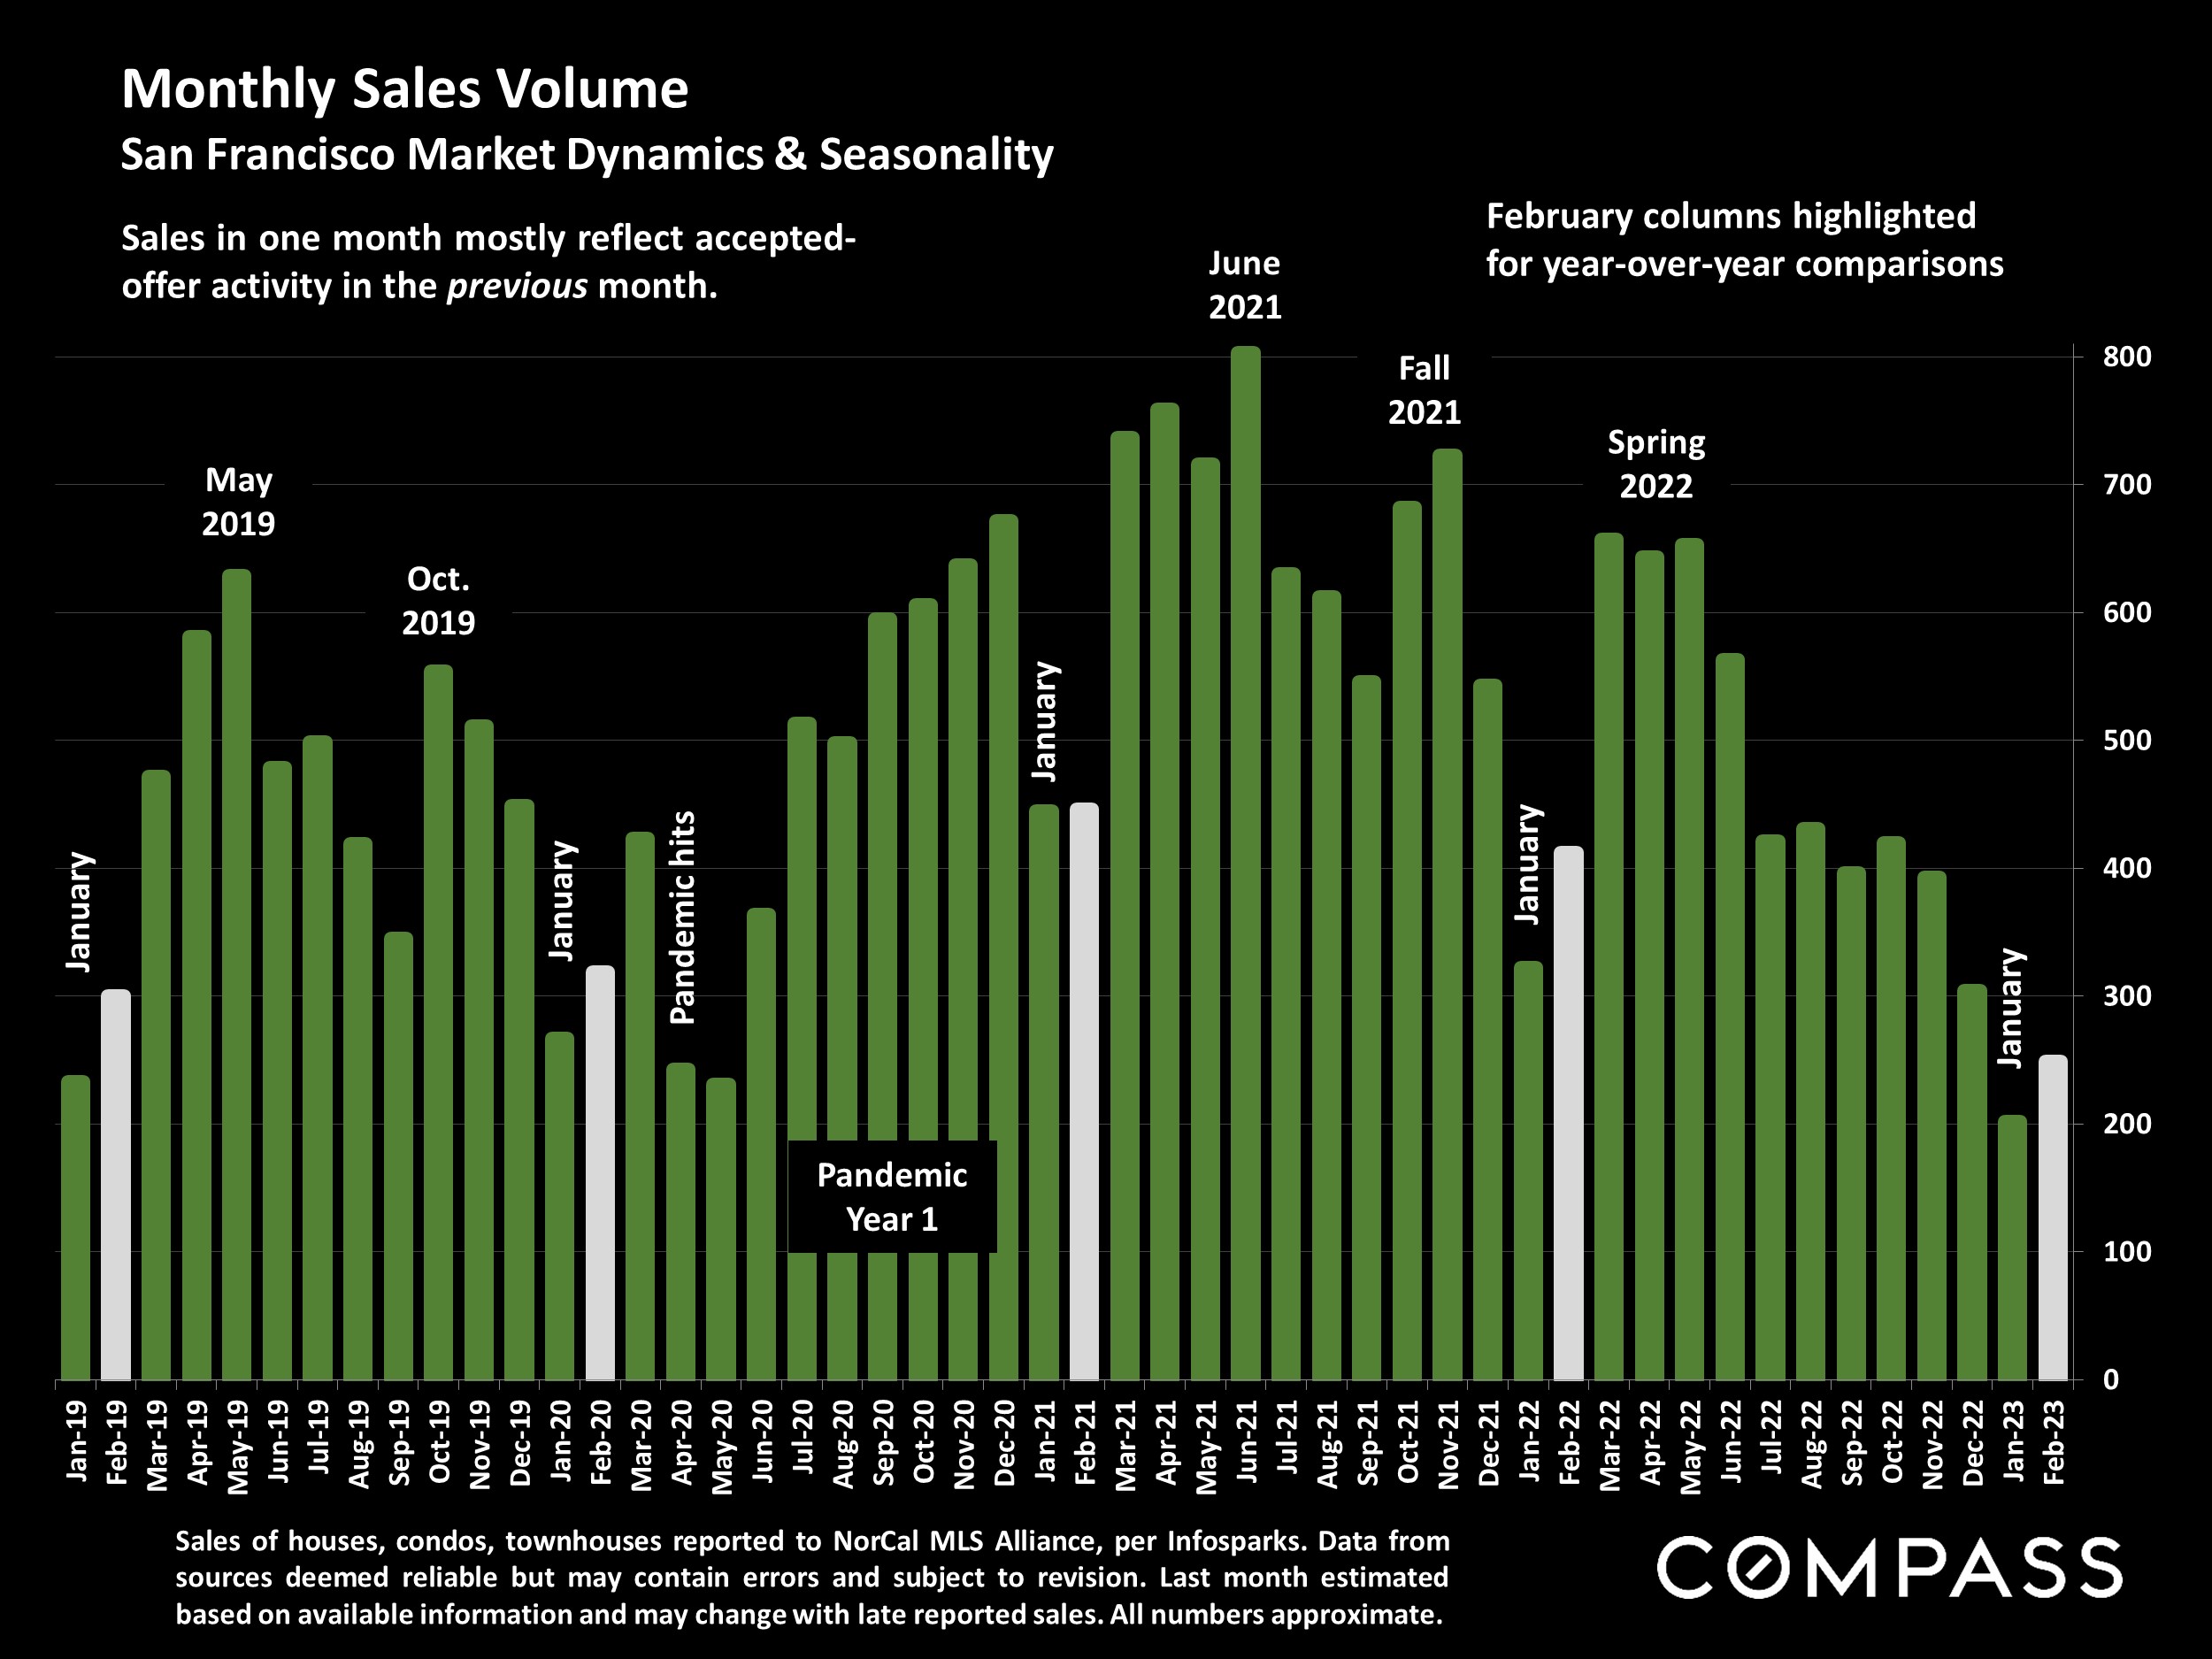
The market was still just waking up in February. March through May is typically the most active listing and sales period of the year, and should soon provide much more data on supply, demand, and price trends. Over the last 3 years, spring markets were deeply affected, in very different and often surprising ways, by the onset of the pandemic (2020), the pandemic boom (2021), and soaring interest rates (2022).
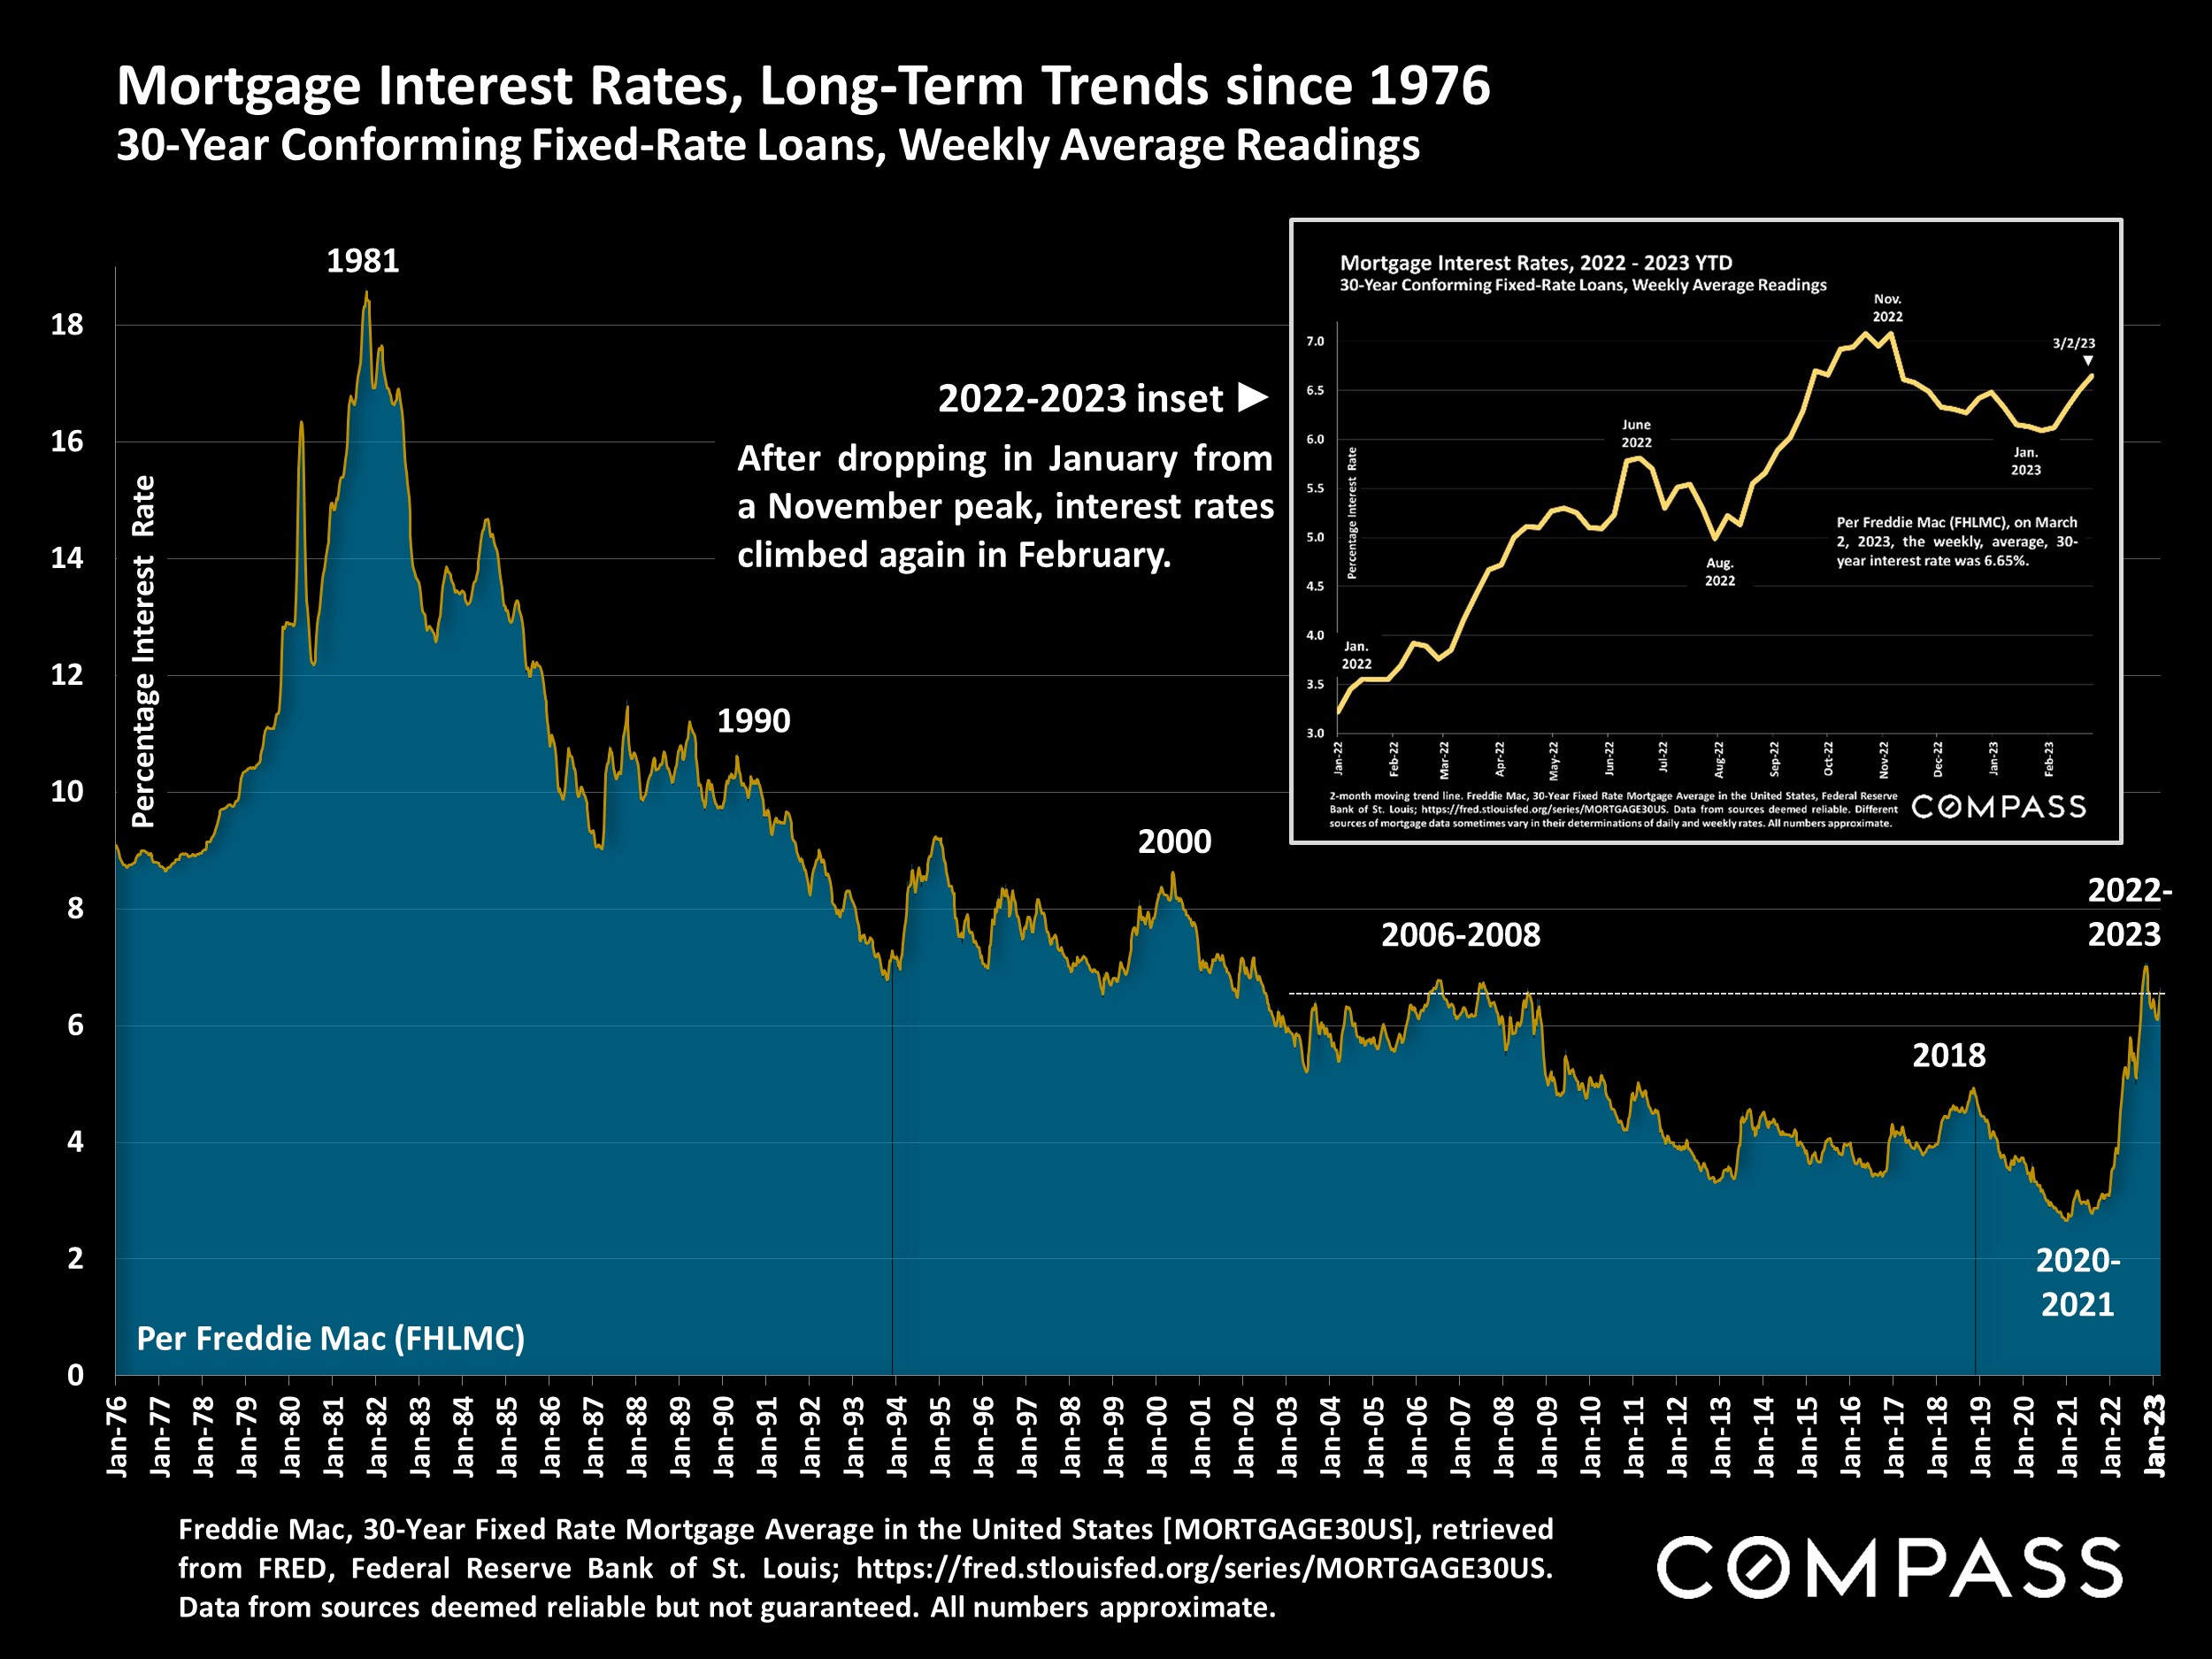
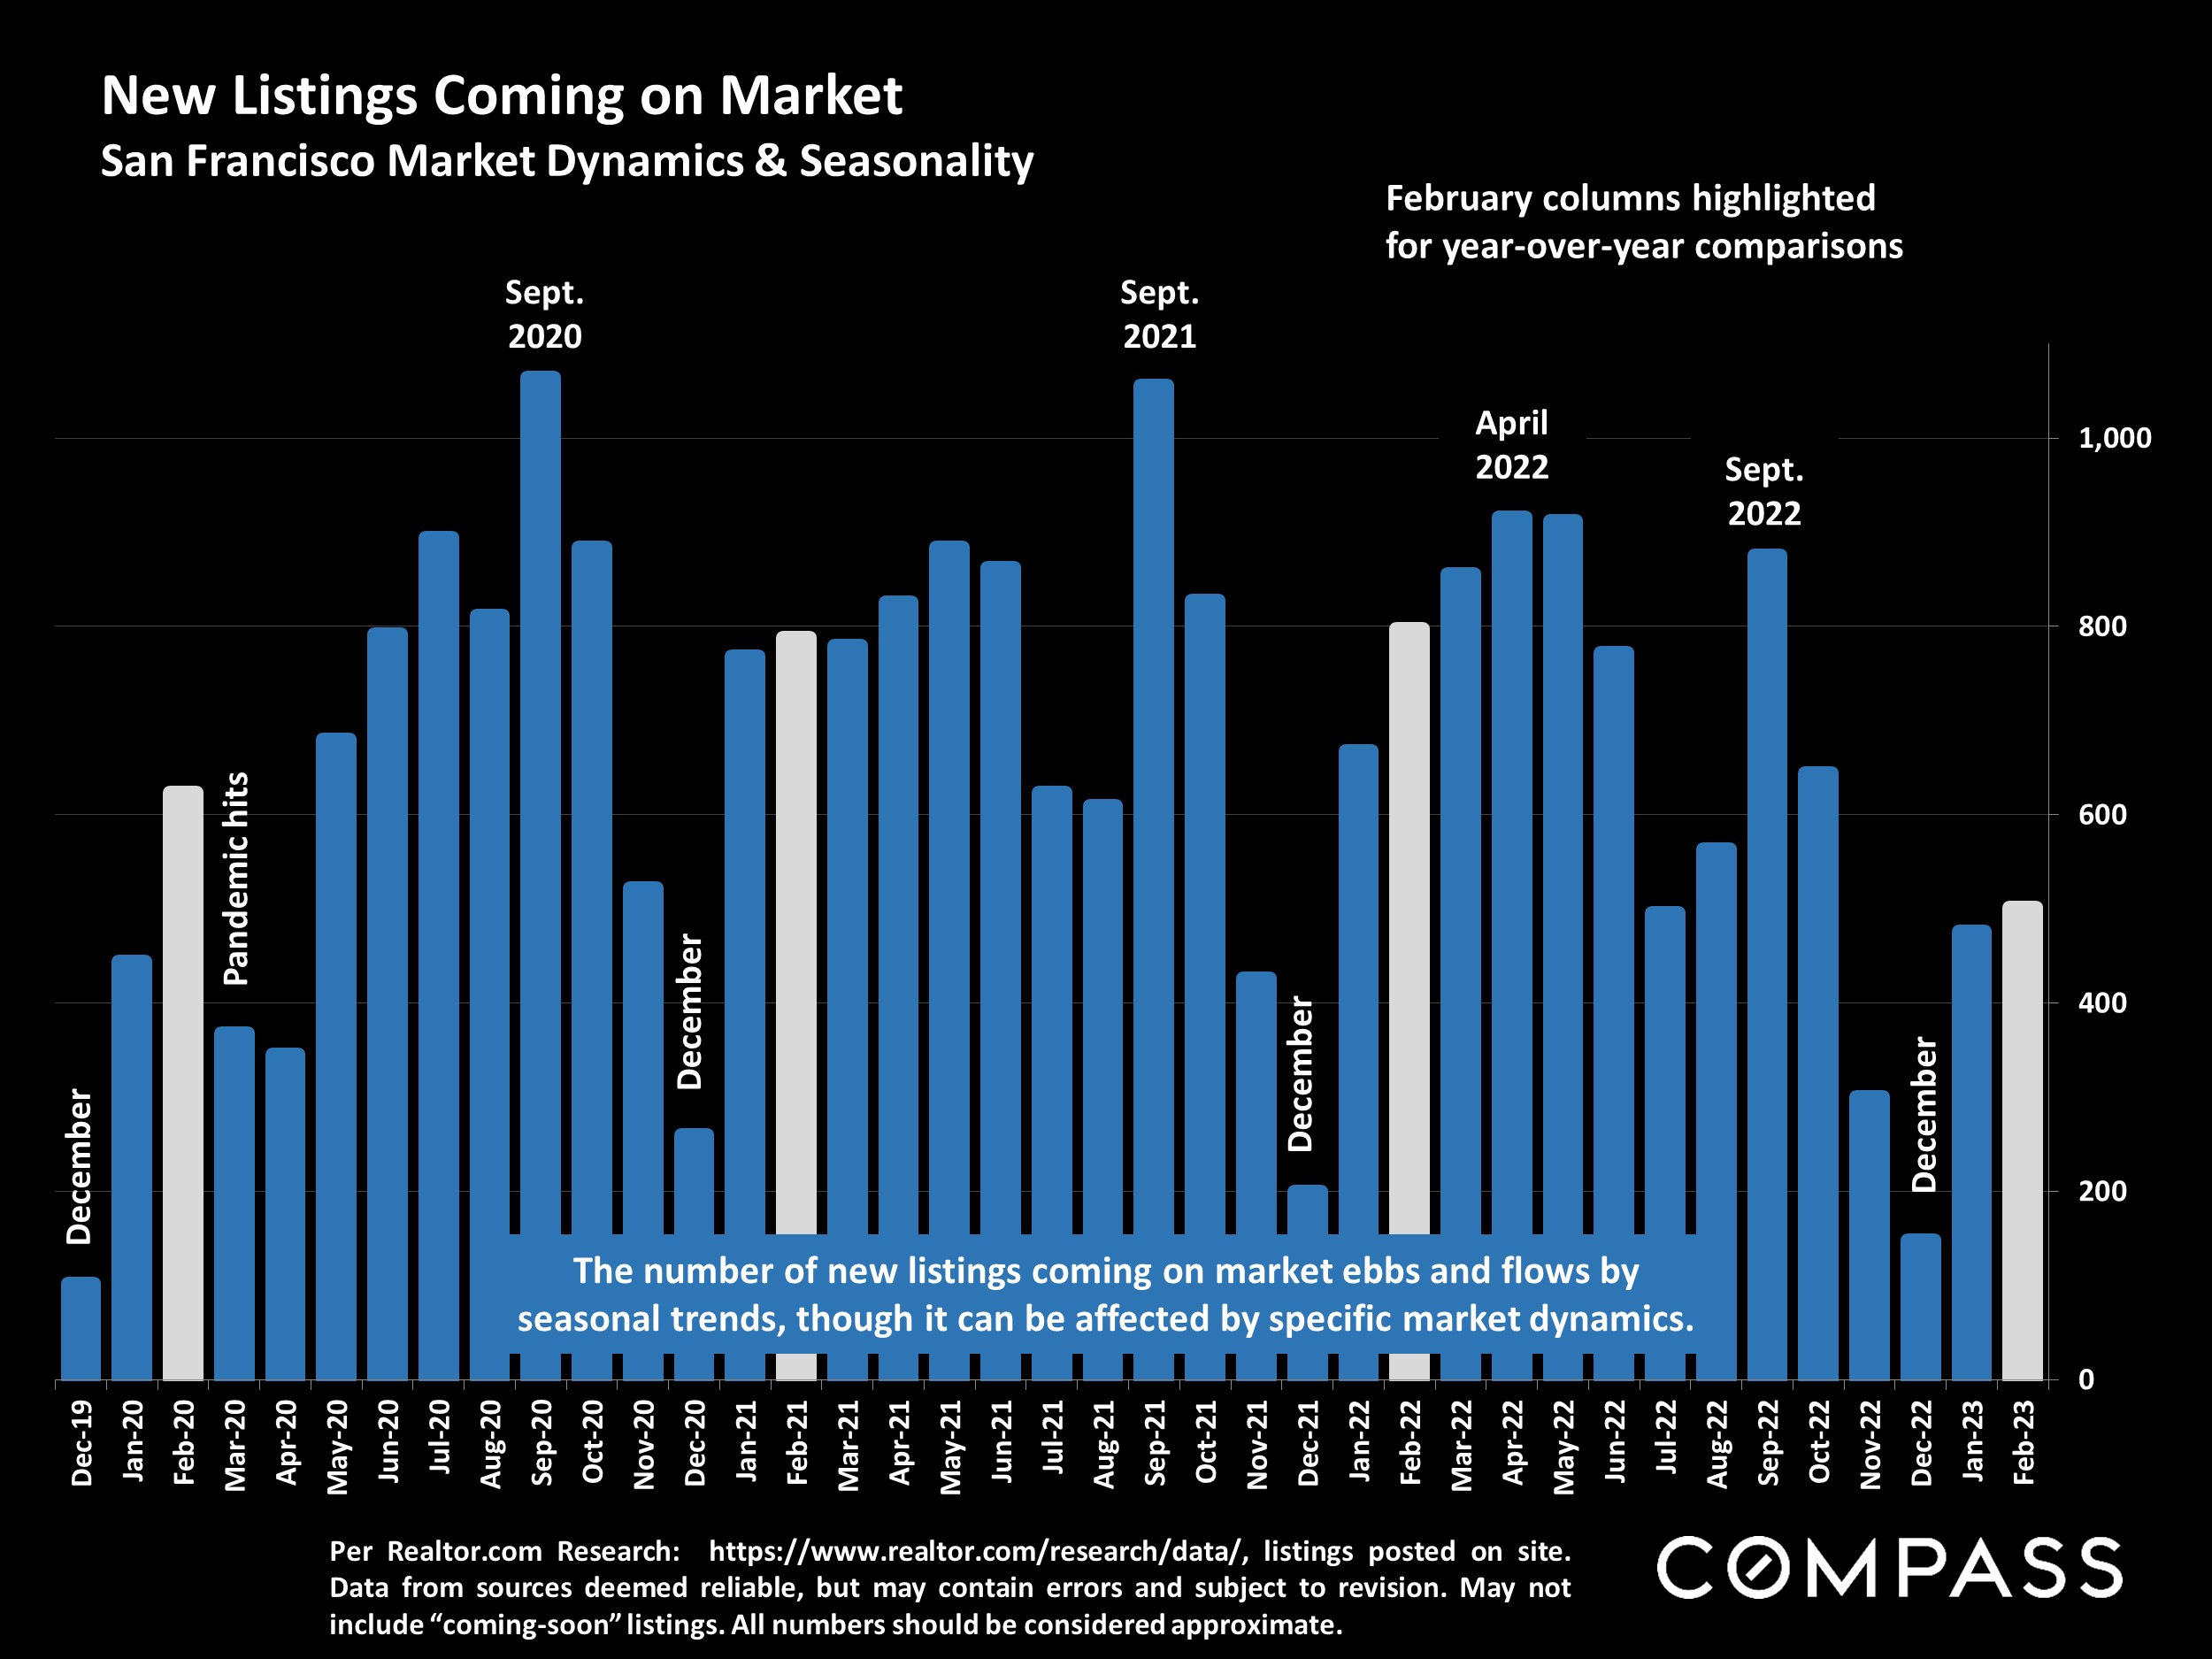
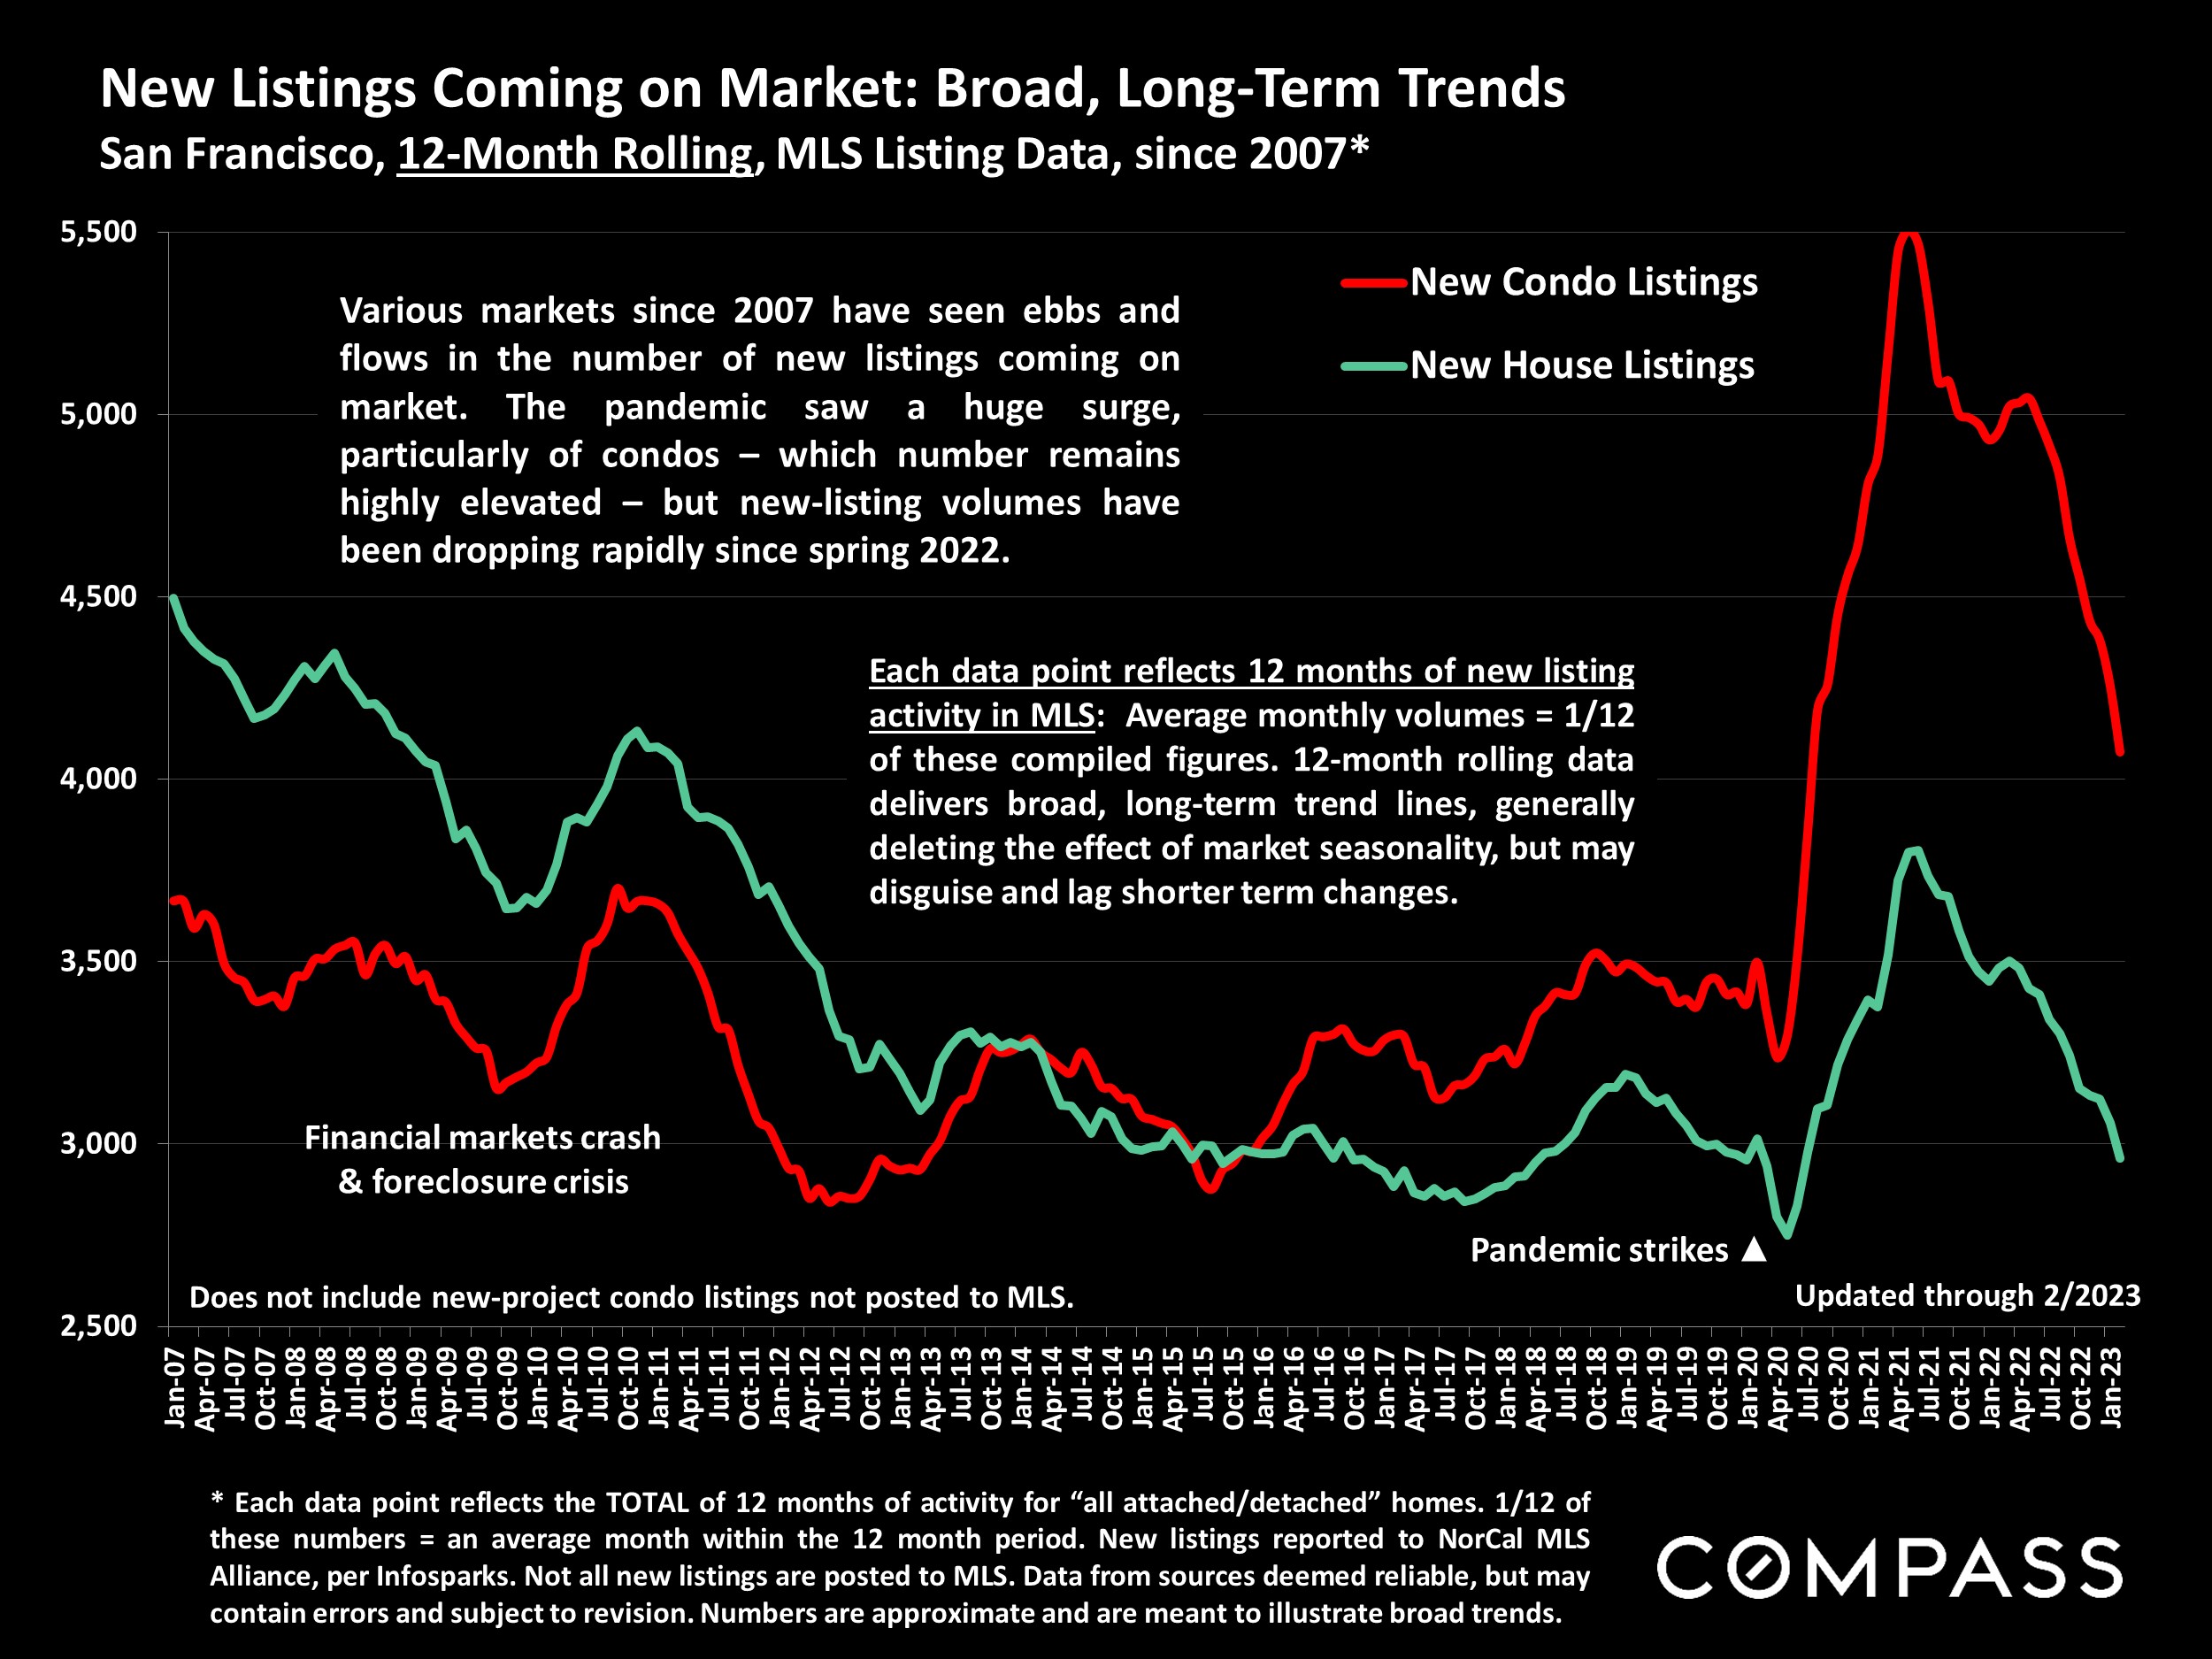
As has been the case for the last 14 months, the biggest wildcard remains interest rates: After dropping considerably in January from a November peak, they climbed again in February, with big impacts on loan application rates. It has been very challenging to predict short-term interest rate changes. Another major factor is the substantial decrease in the number of new listings coming on the market, a critical issue with wide ramifications if it continues.
Want to learn more about Bay Area market trends?
Let’s connect! With relationships and networks across the city, there are a variety of ways I can help you make informed real estate decisions. Call, email, or text – I’m here to help.
Contact