
July 26, 2022
SF: July 2022 Market Stats
By Compass
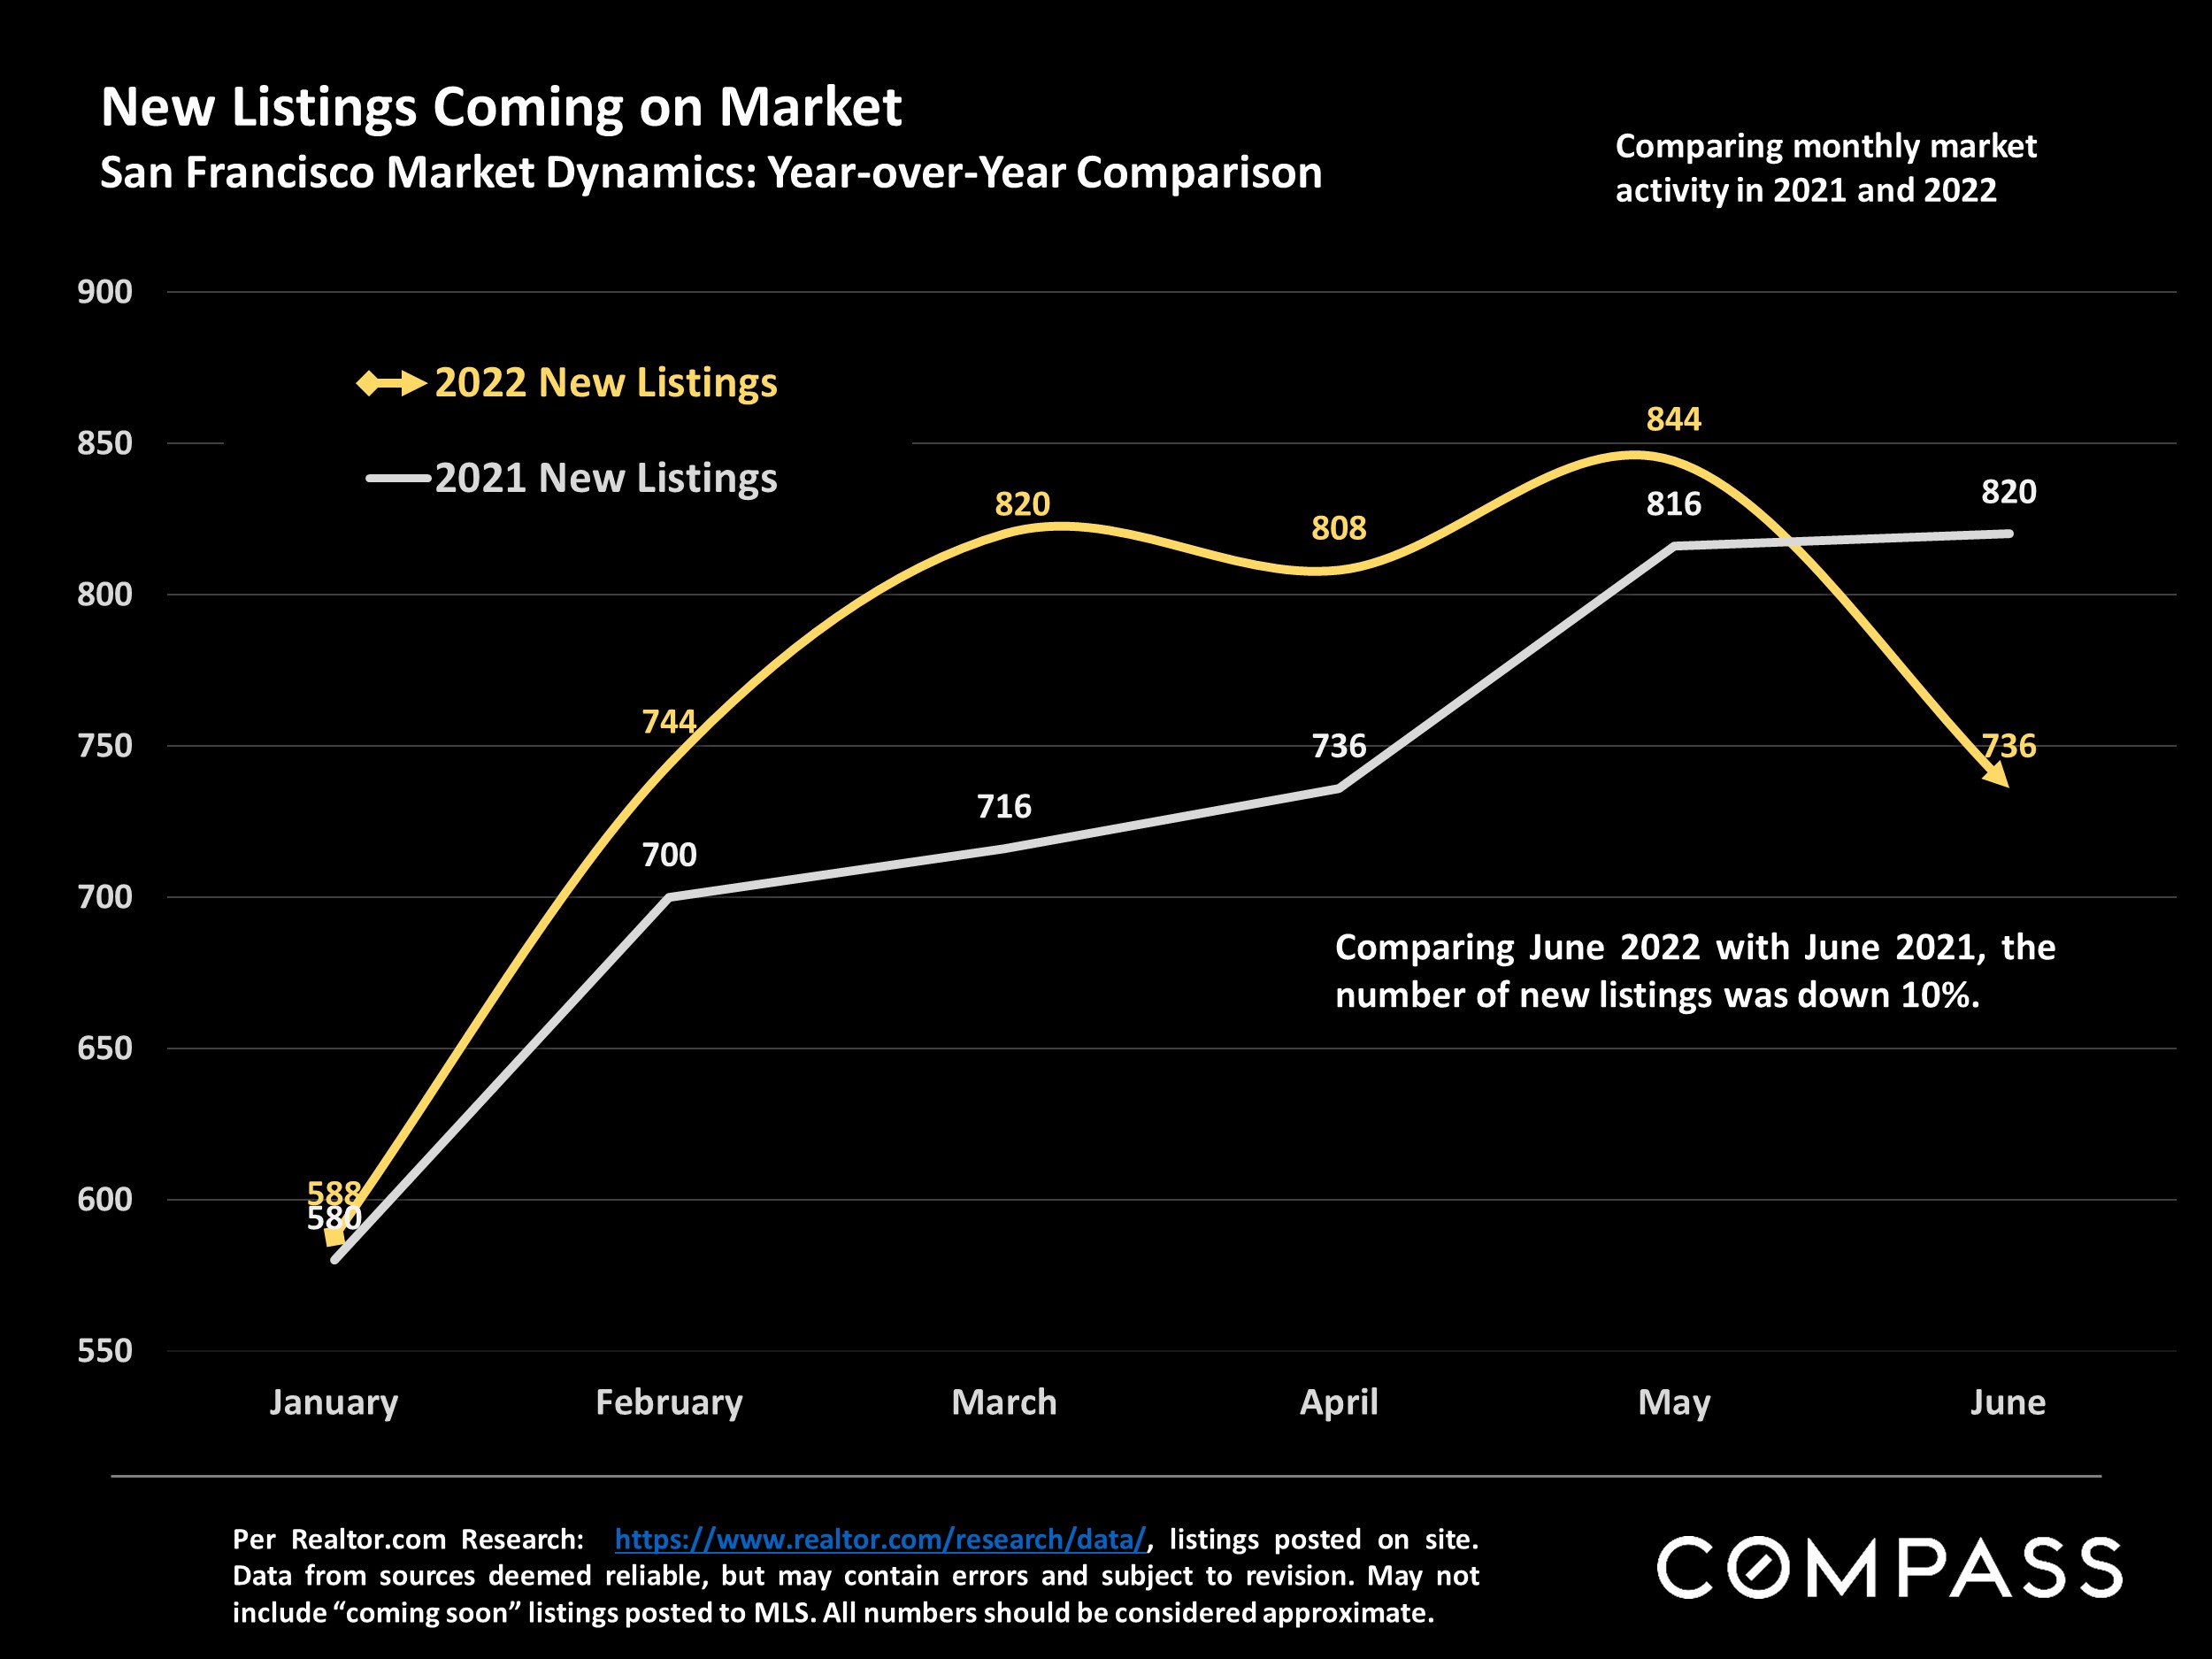
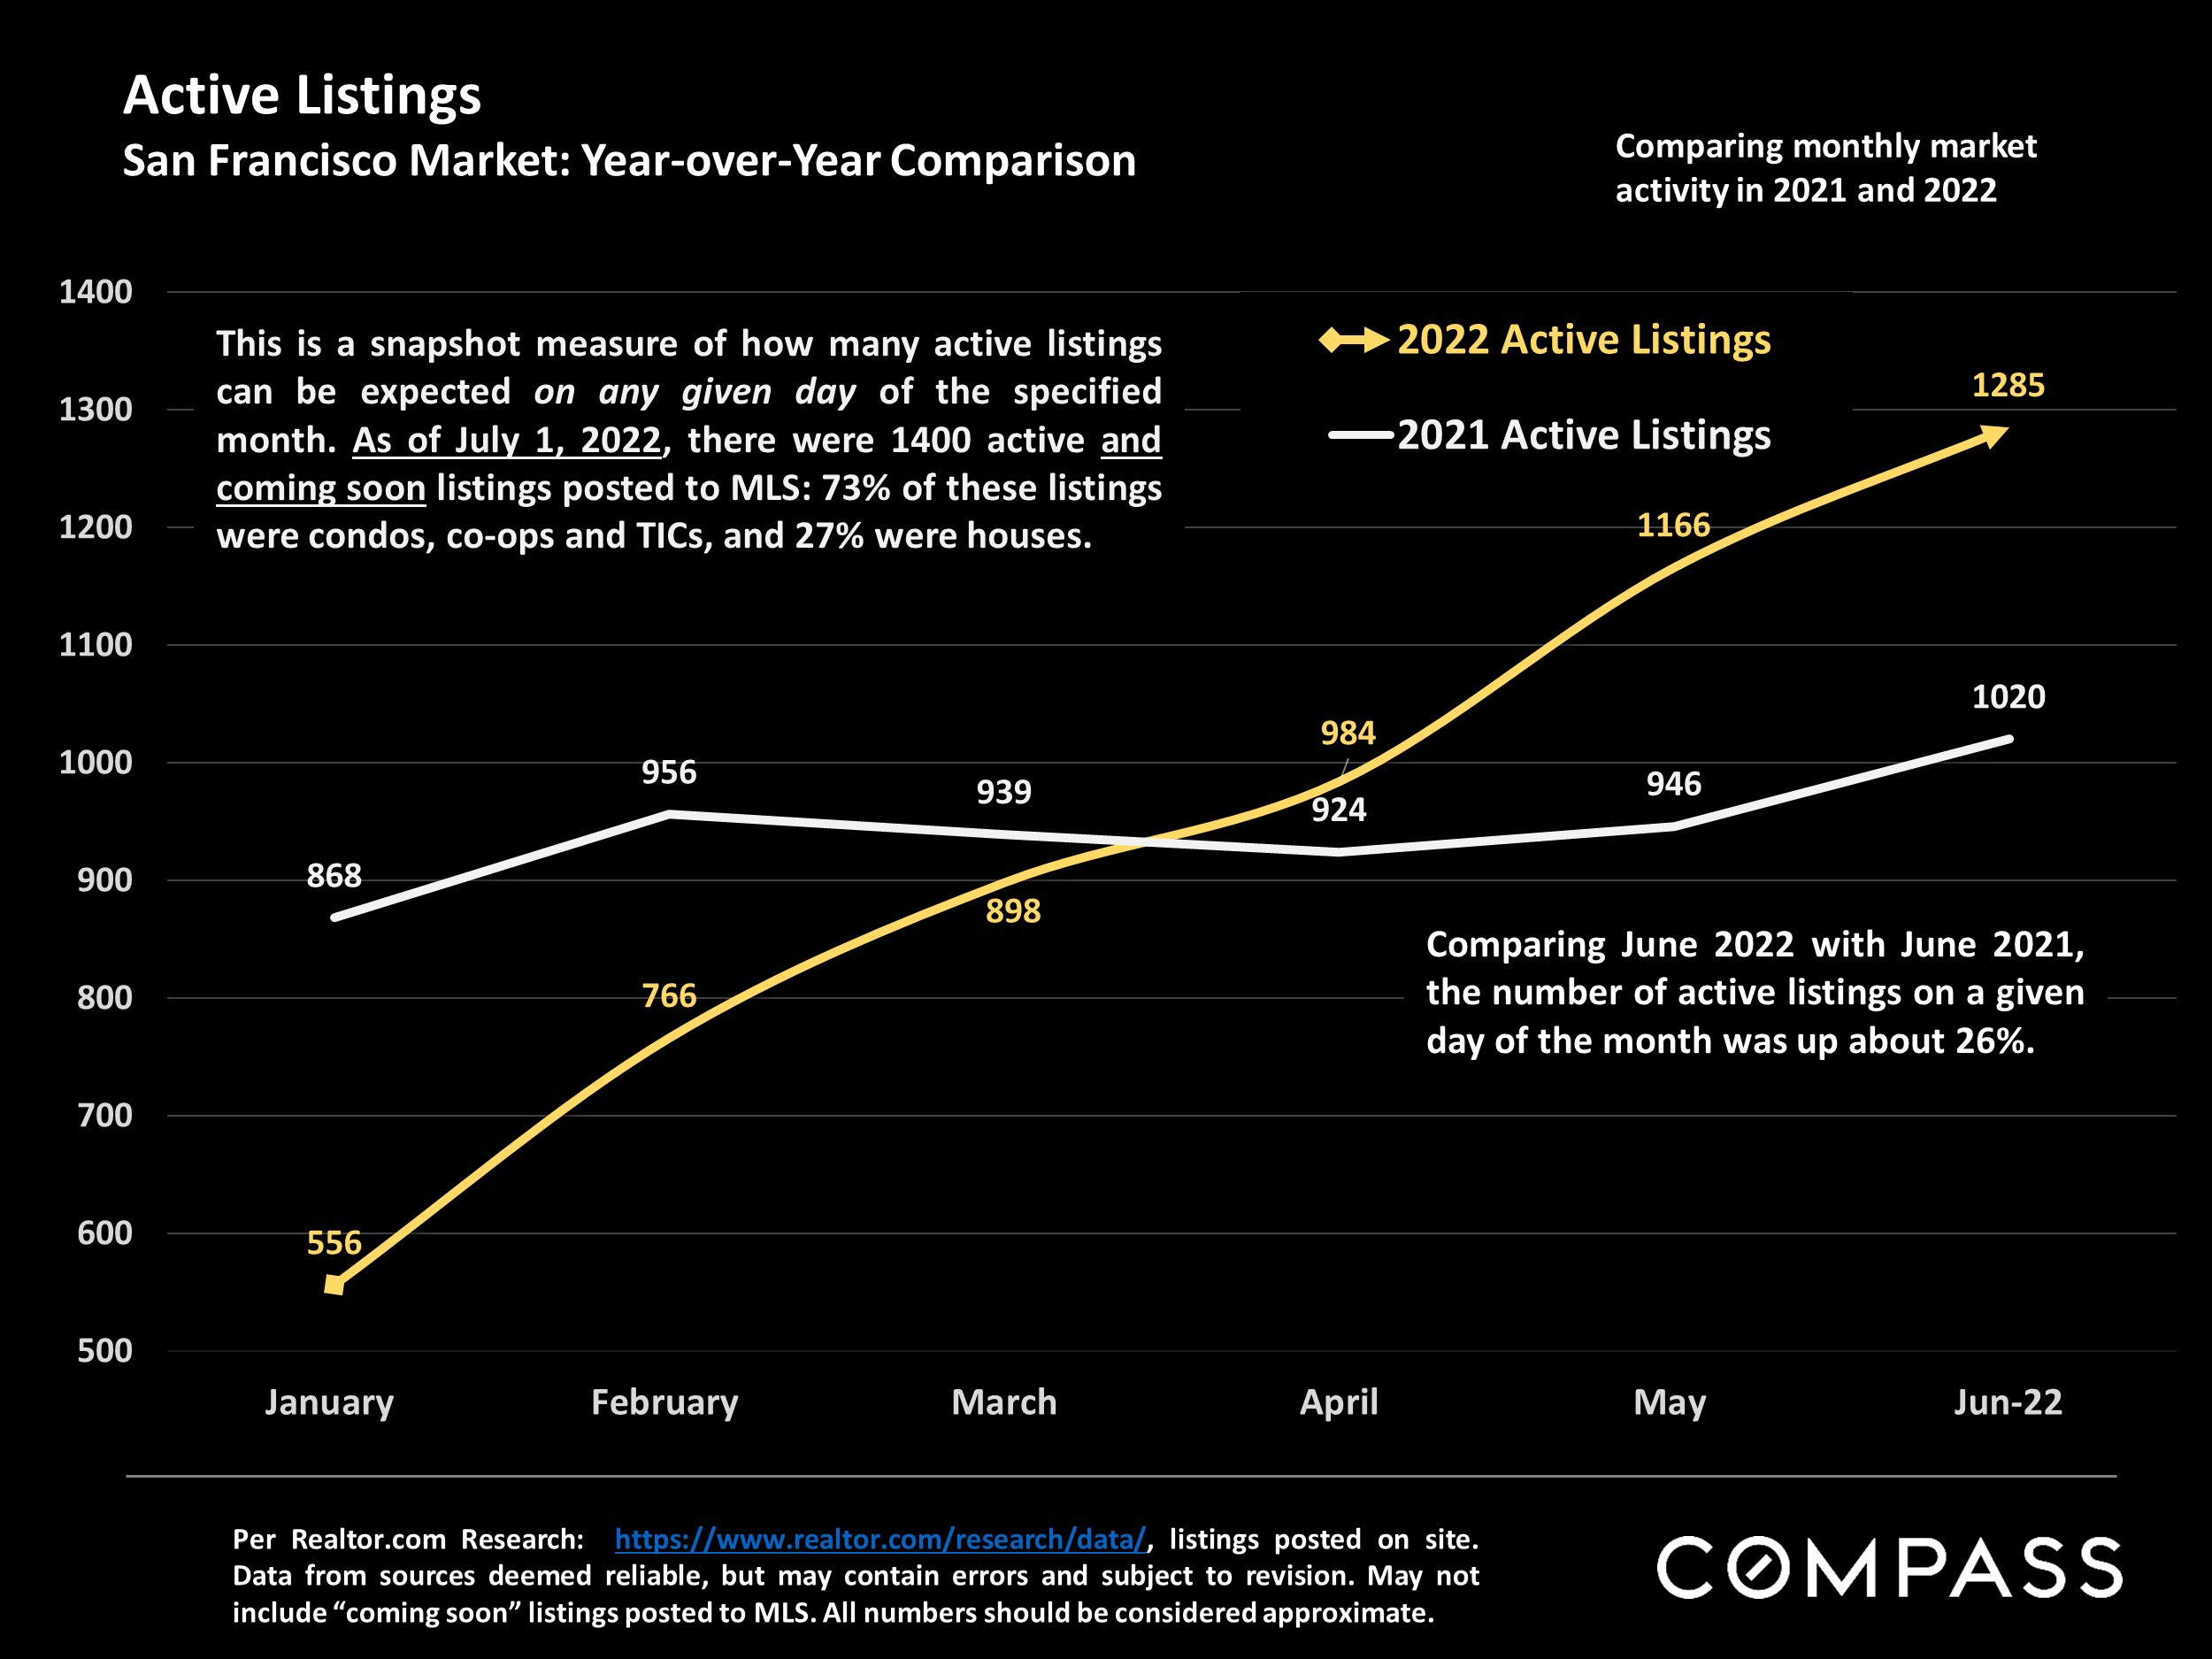
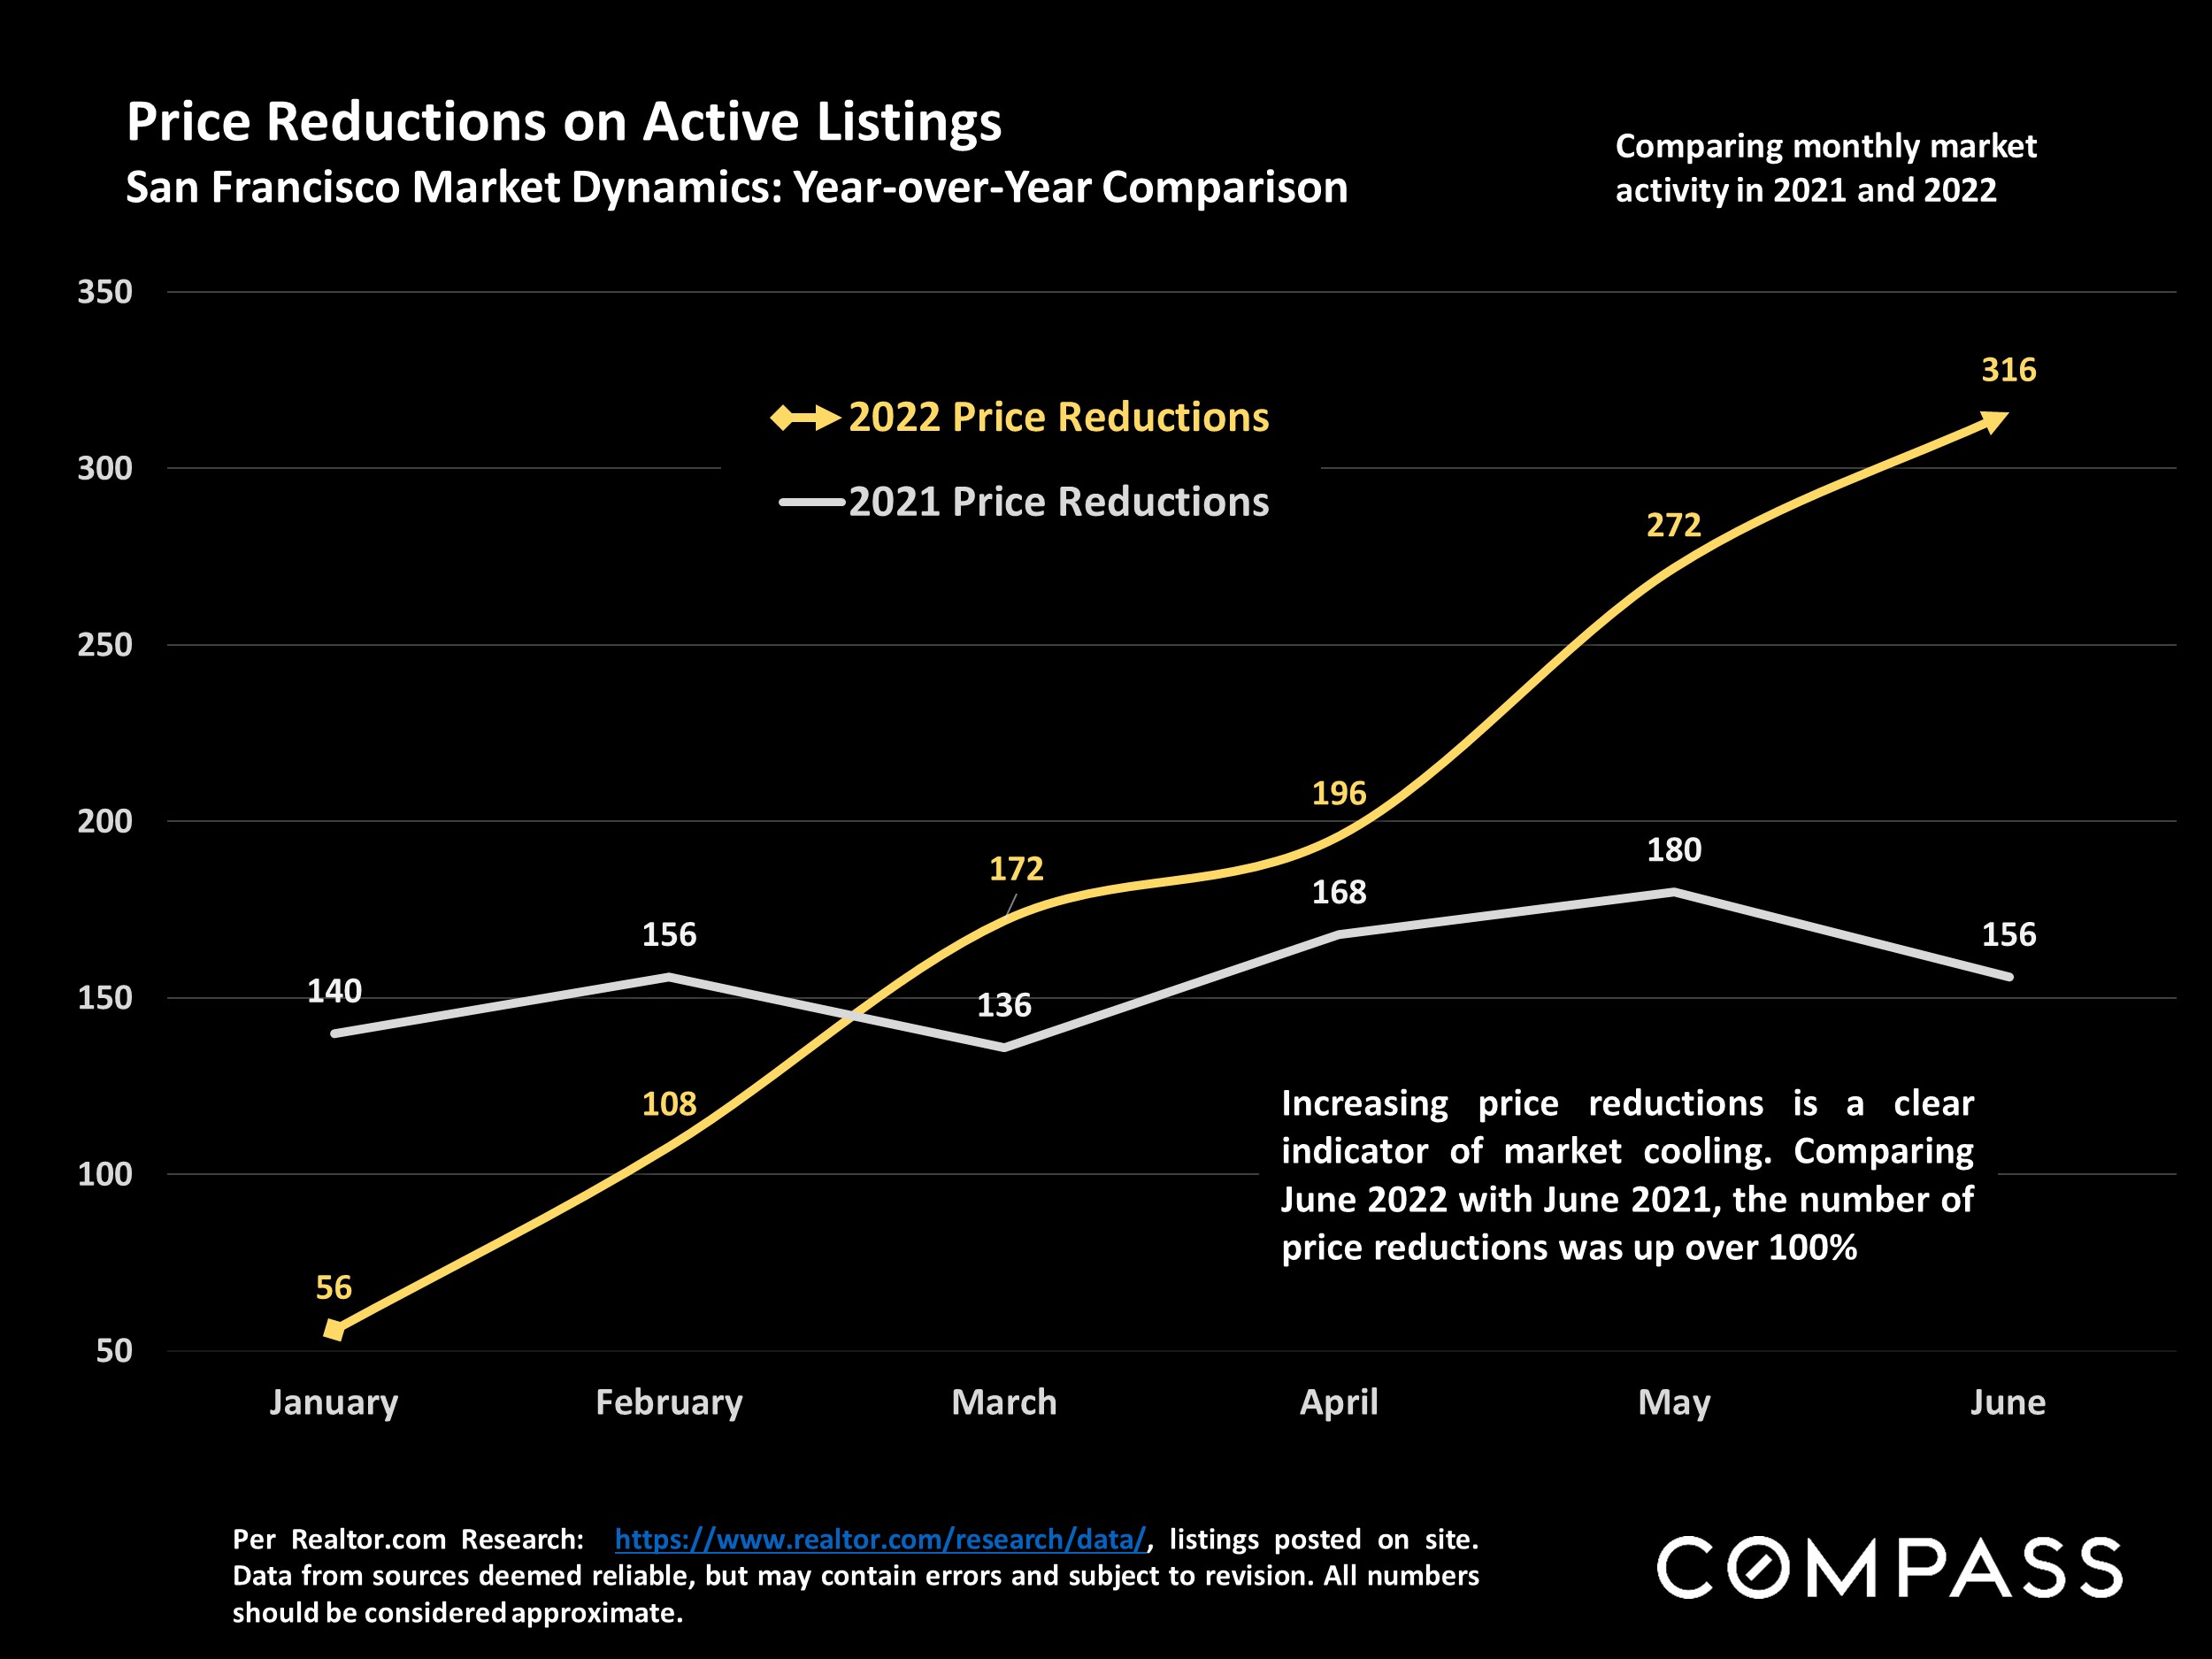
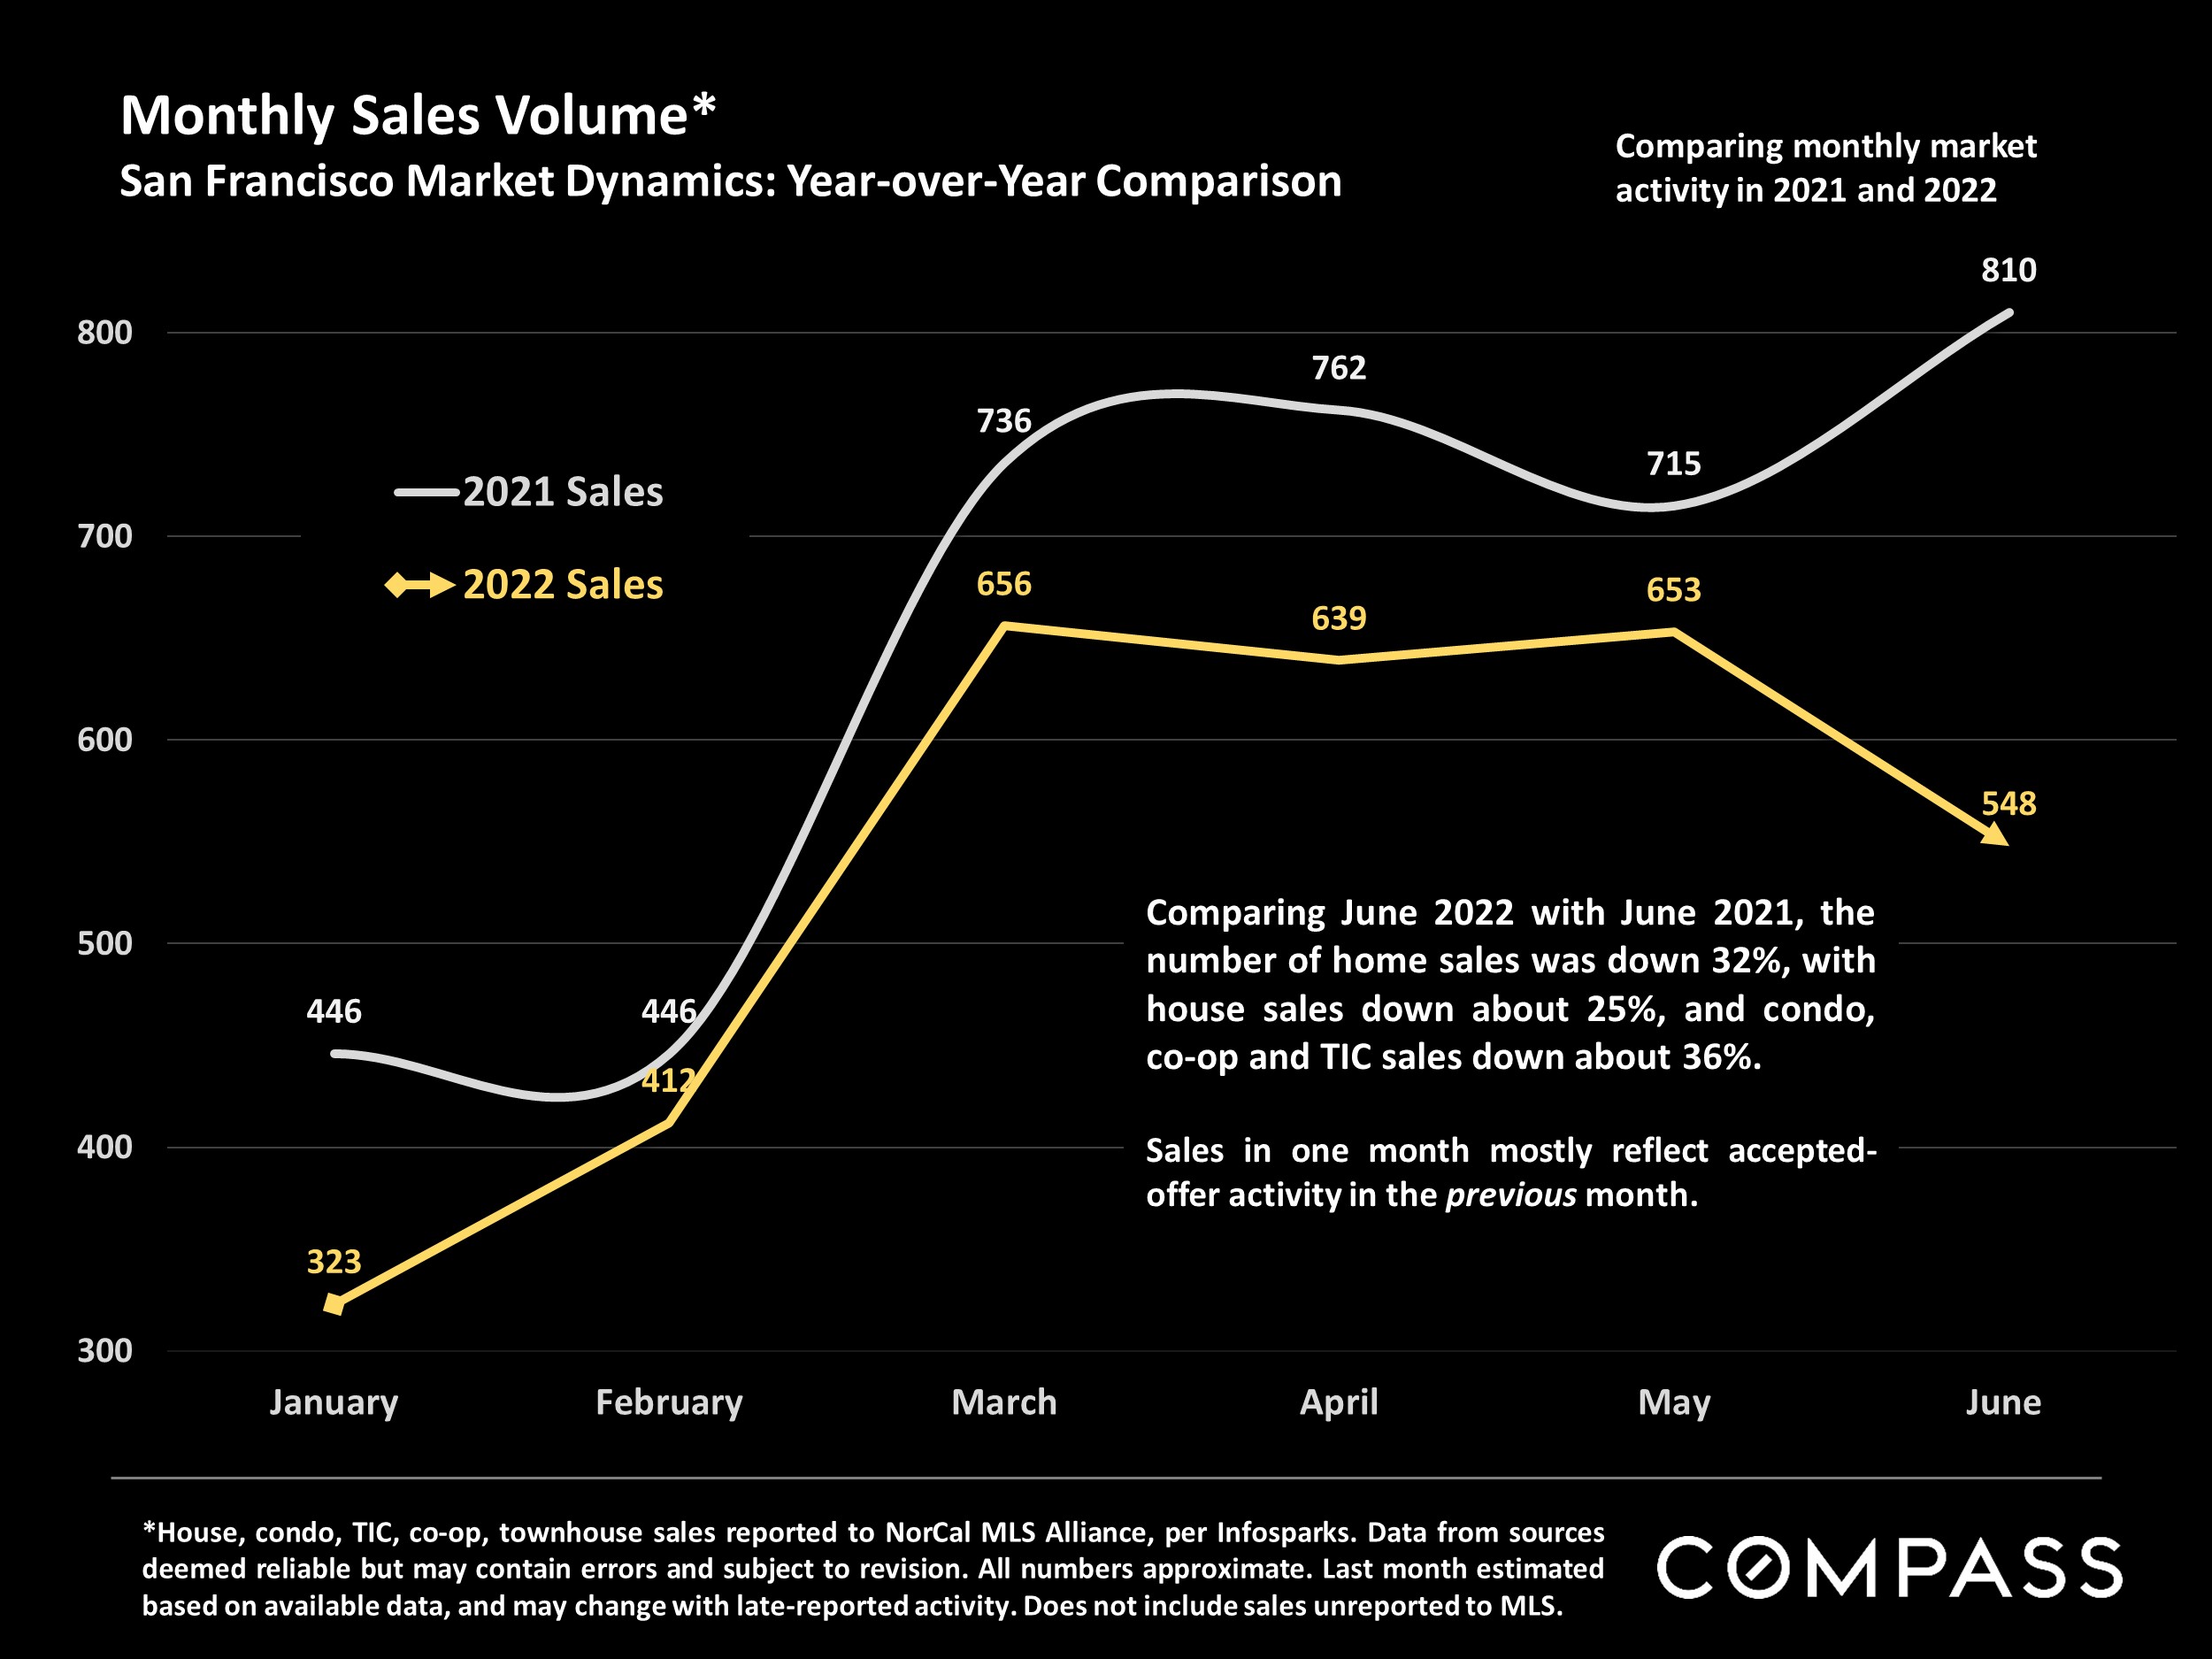
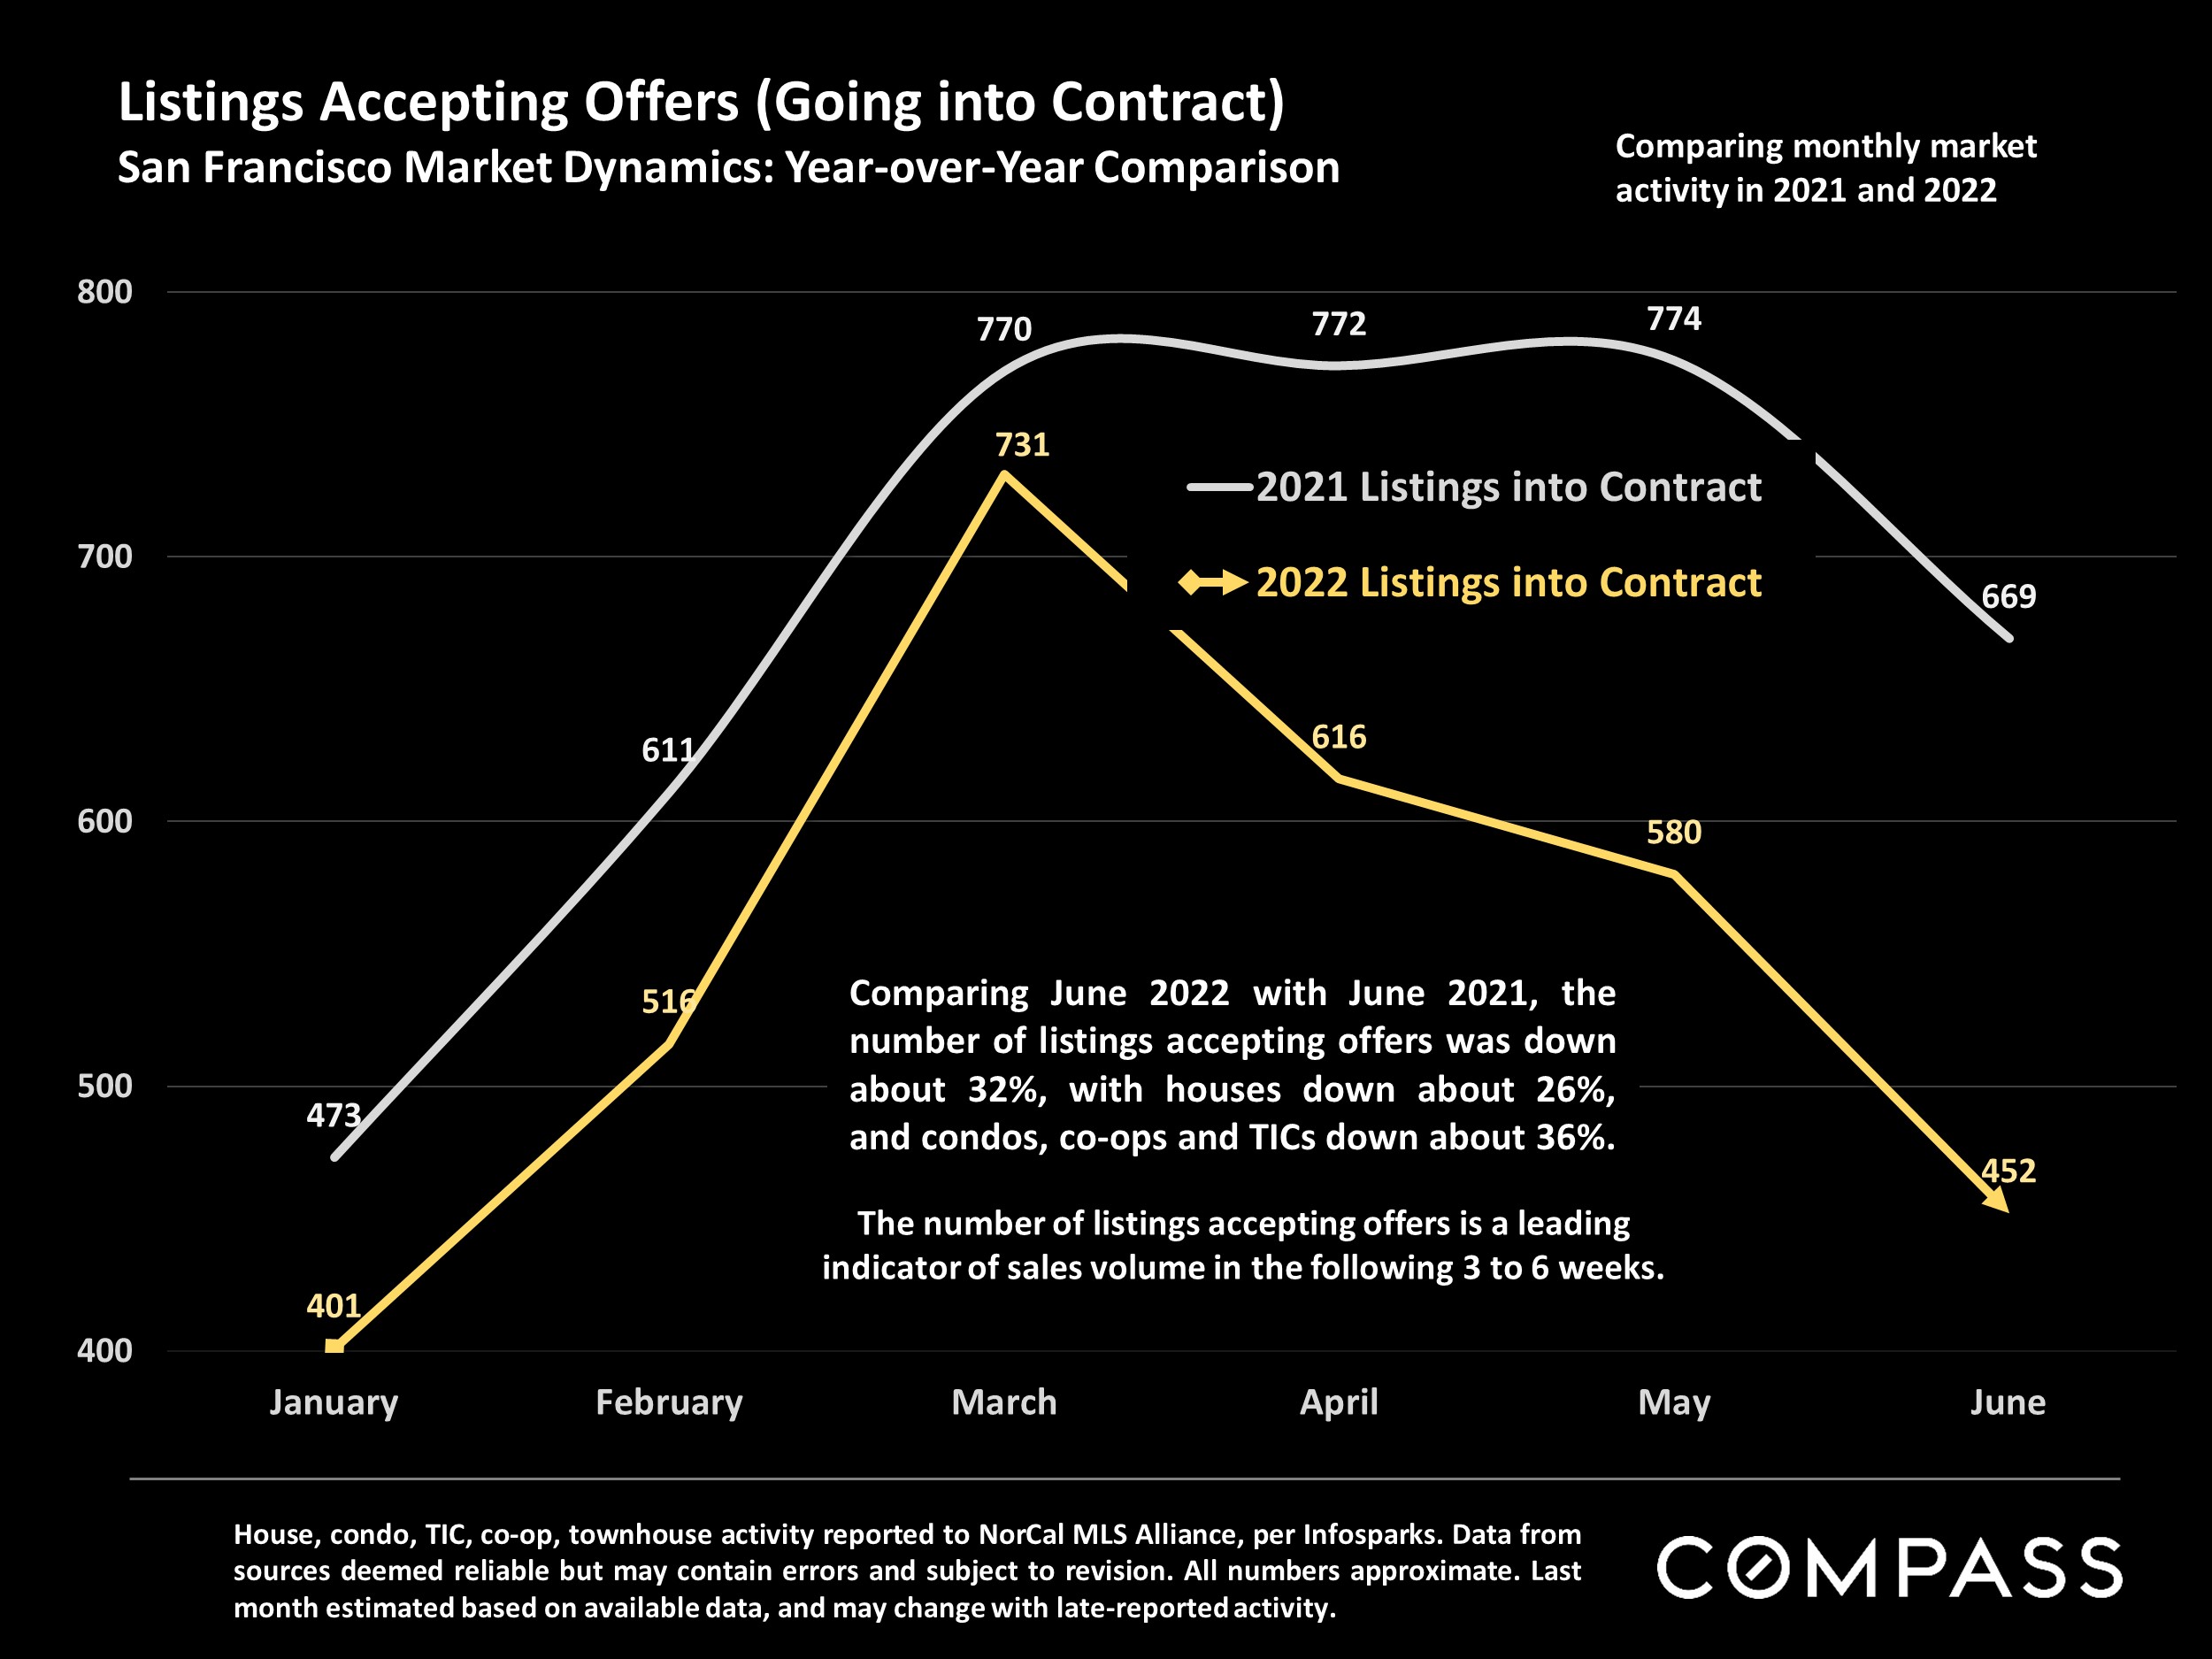
Leaning into Market Headwinds, Year-over-Year Appreciation Rate Falls: The impacts of this year’s severe economic headwinds – soaring inflation and interest rates, stock market declines, fears of recession – on Bay Area real estate markets are speeding up. The first effect was on buyer demand (fewer buyers, offers, and listings into contract), leading to changes in supply (more homes for sale, more price reductions), which began to alter buyer and seller psychology and the balance of power between them. Especially after one of the longest, most dramatic upcycles in history, the psychology, circumstances, and plans of individual buyers and sellers shift unevenly in the early months of a transition as they try to make sense of changing market realities. Eventually, statistics based on closed sales – prices, appreciation rates, overbidding, days on market – slowly start to adjust. Generally speaking, closed sales are lagging indicators of what occurred in the economy and market weeks and months earlier.
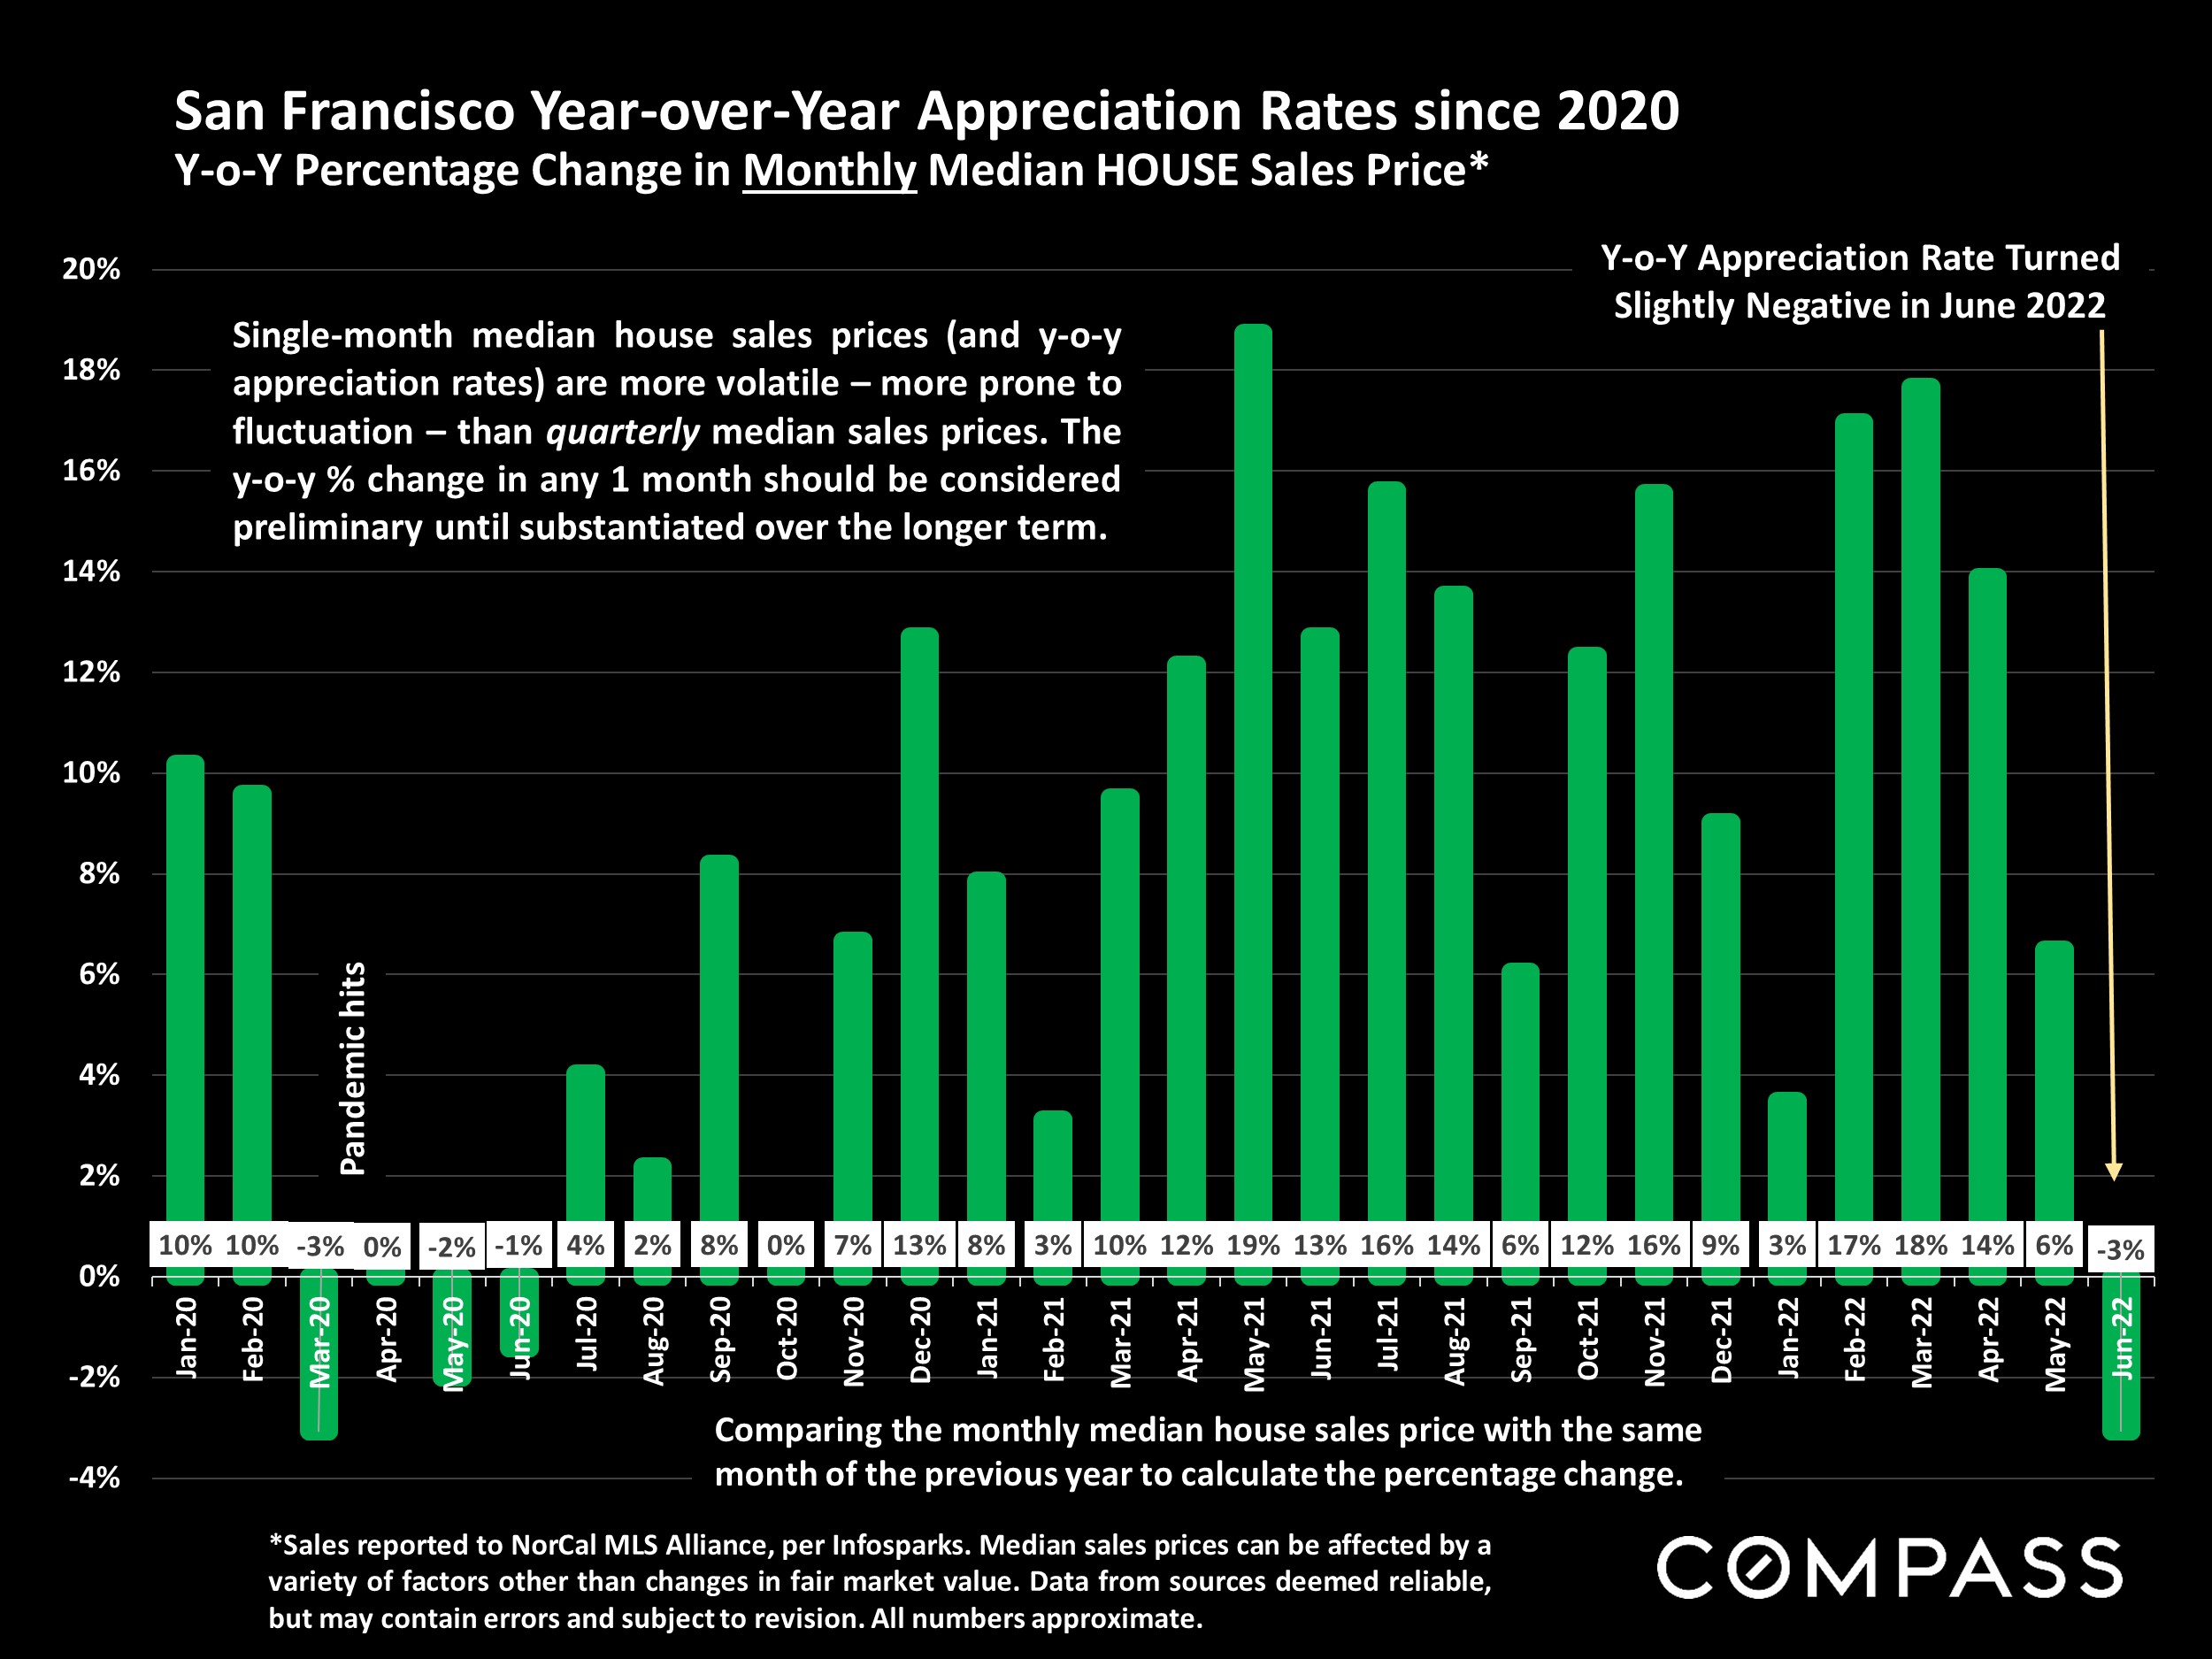
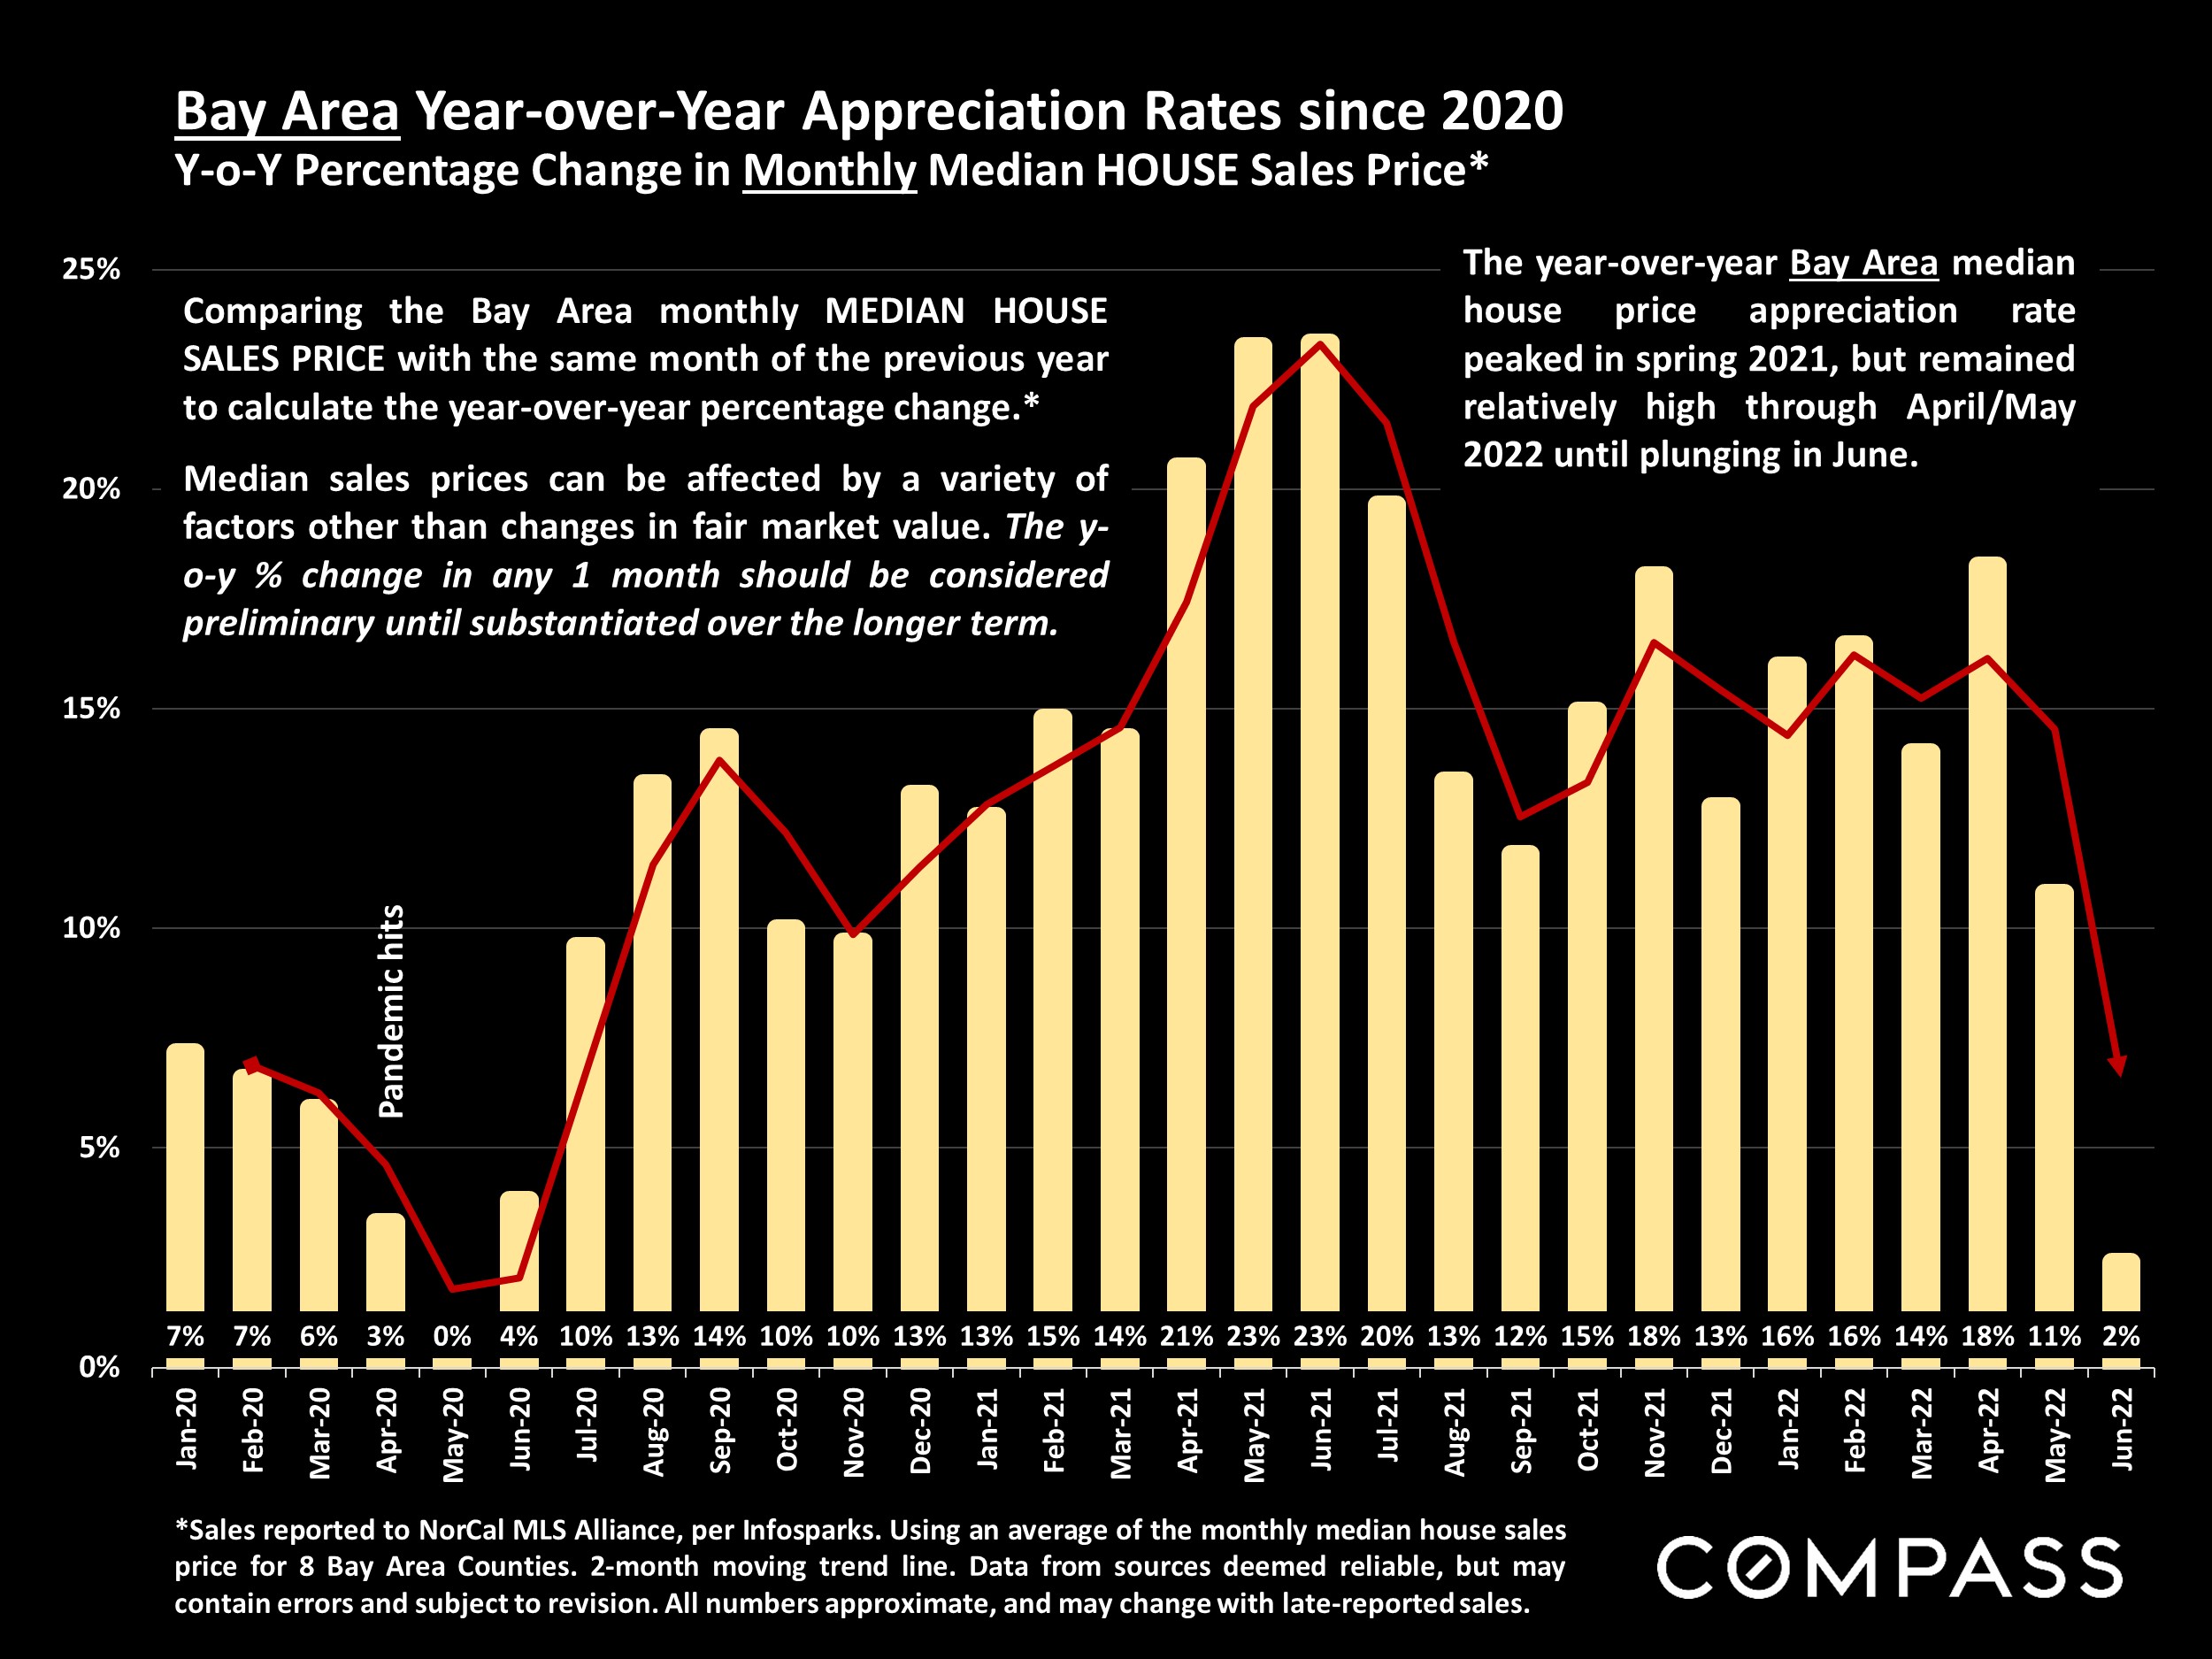
If stock market prices are like a jet skier on a triple espresso, home prices are like a giant cargo ship, which decelerates and turns slowly. It took a few months from when the big economic changes began, but the high year-over-year appreciation rates of recent years are now dropping fast in Bay Area markets – and in San Francisco, the rate turned slightly negative in June – though the degree of any actual, longer-term “correction” to prices, if it occurs, remains to be seen.
A correction is not a crash. The precipitating factor in the 2008 crash – tens of millions of households talked into home loans they couldn’t afford, forcing frantic sales during a recession – does not apply today. Indeed, mortgage payments as a percentage of income are close to all-time lows (and most homeowners’ mortgages are also at historically low rates). Outside the 2008 crash, market corrections over the last 4 decades typically ran from a simple flattening in appreciation to price adjustments of 5% to 10% (relatively small compared to the appreciation rates which preceded them). It is far too early, with far too many factors at play, to make predictions.
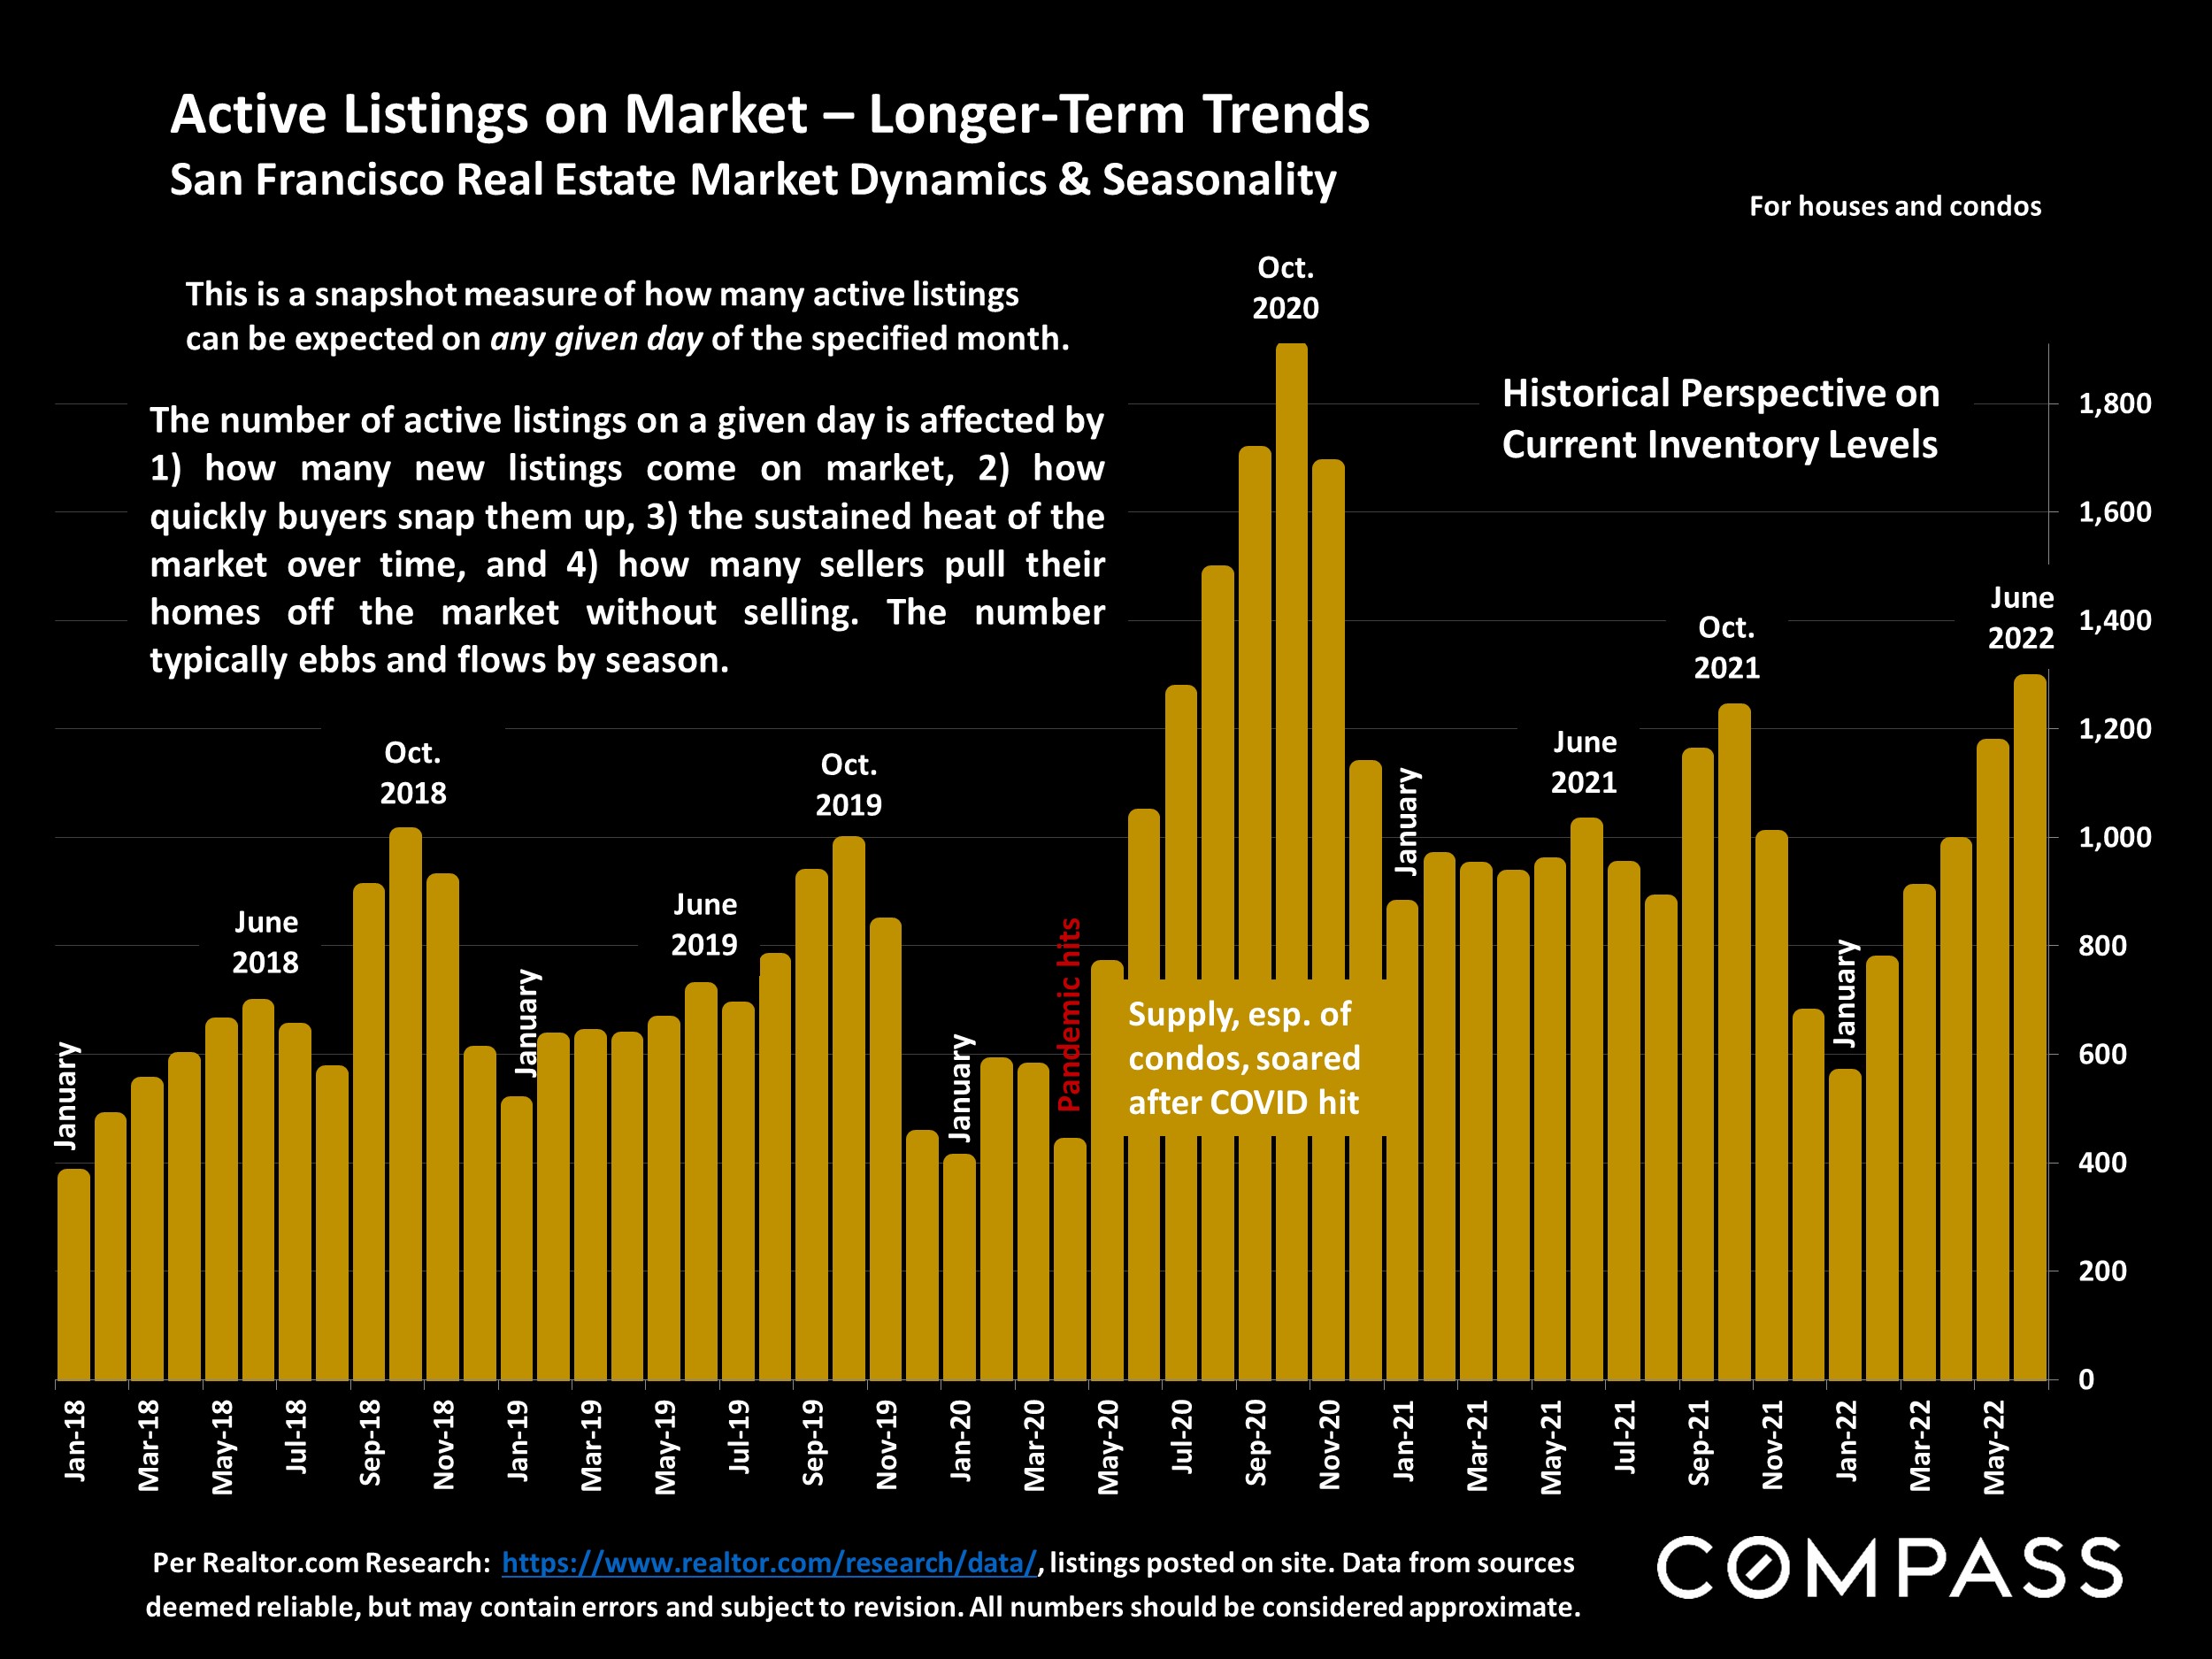
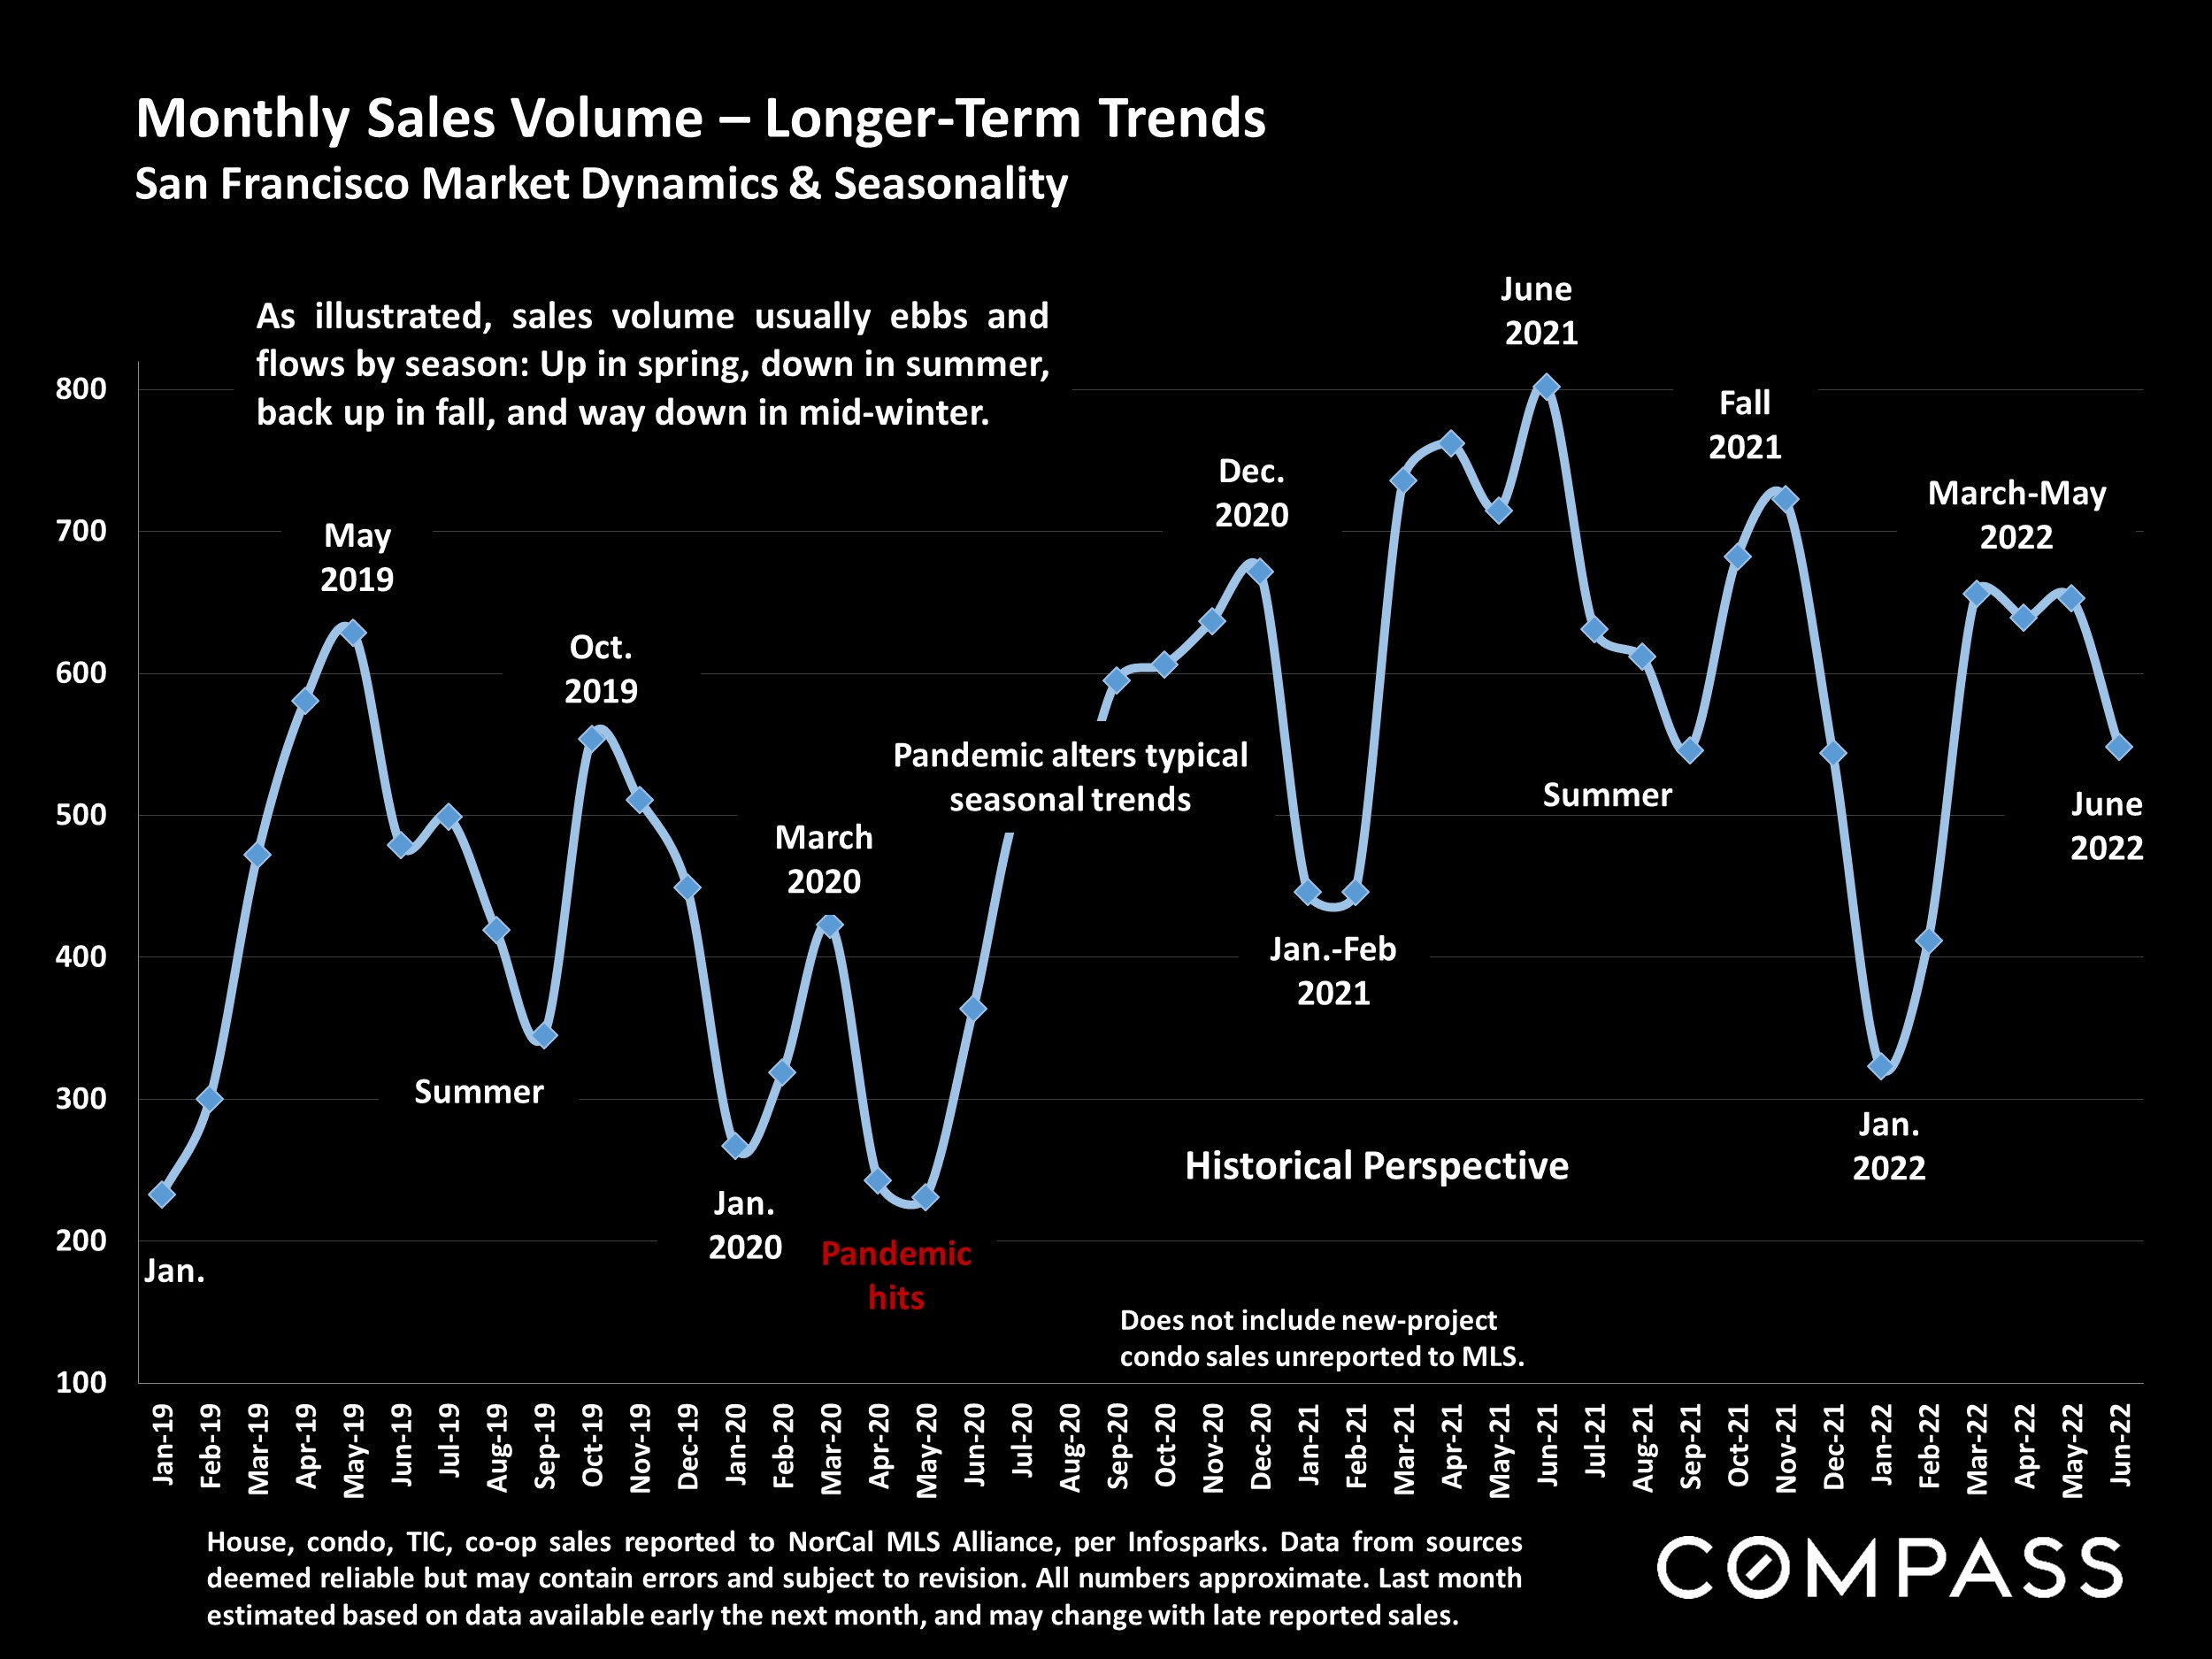
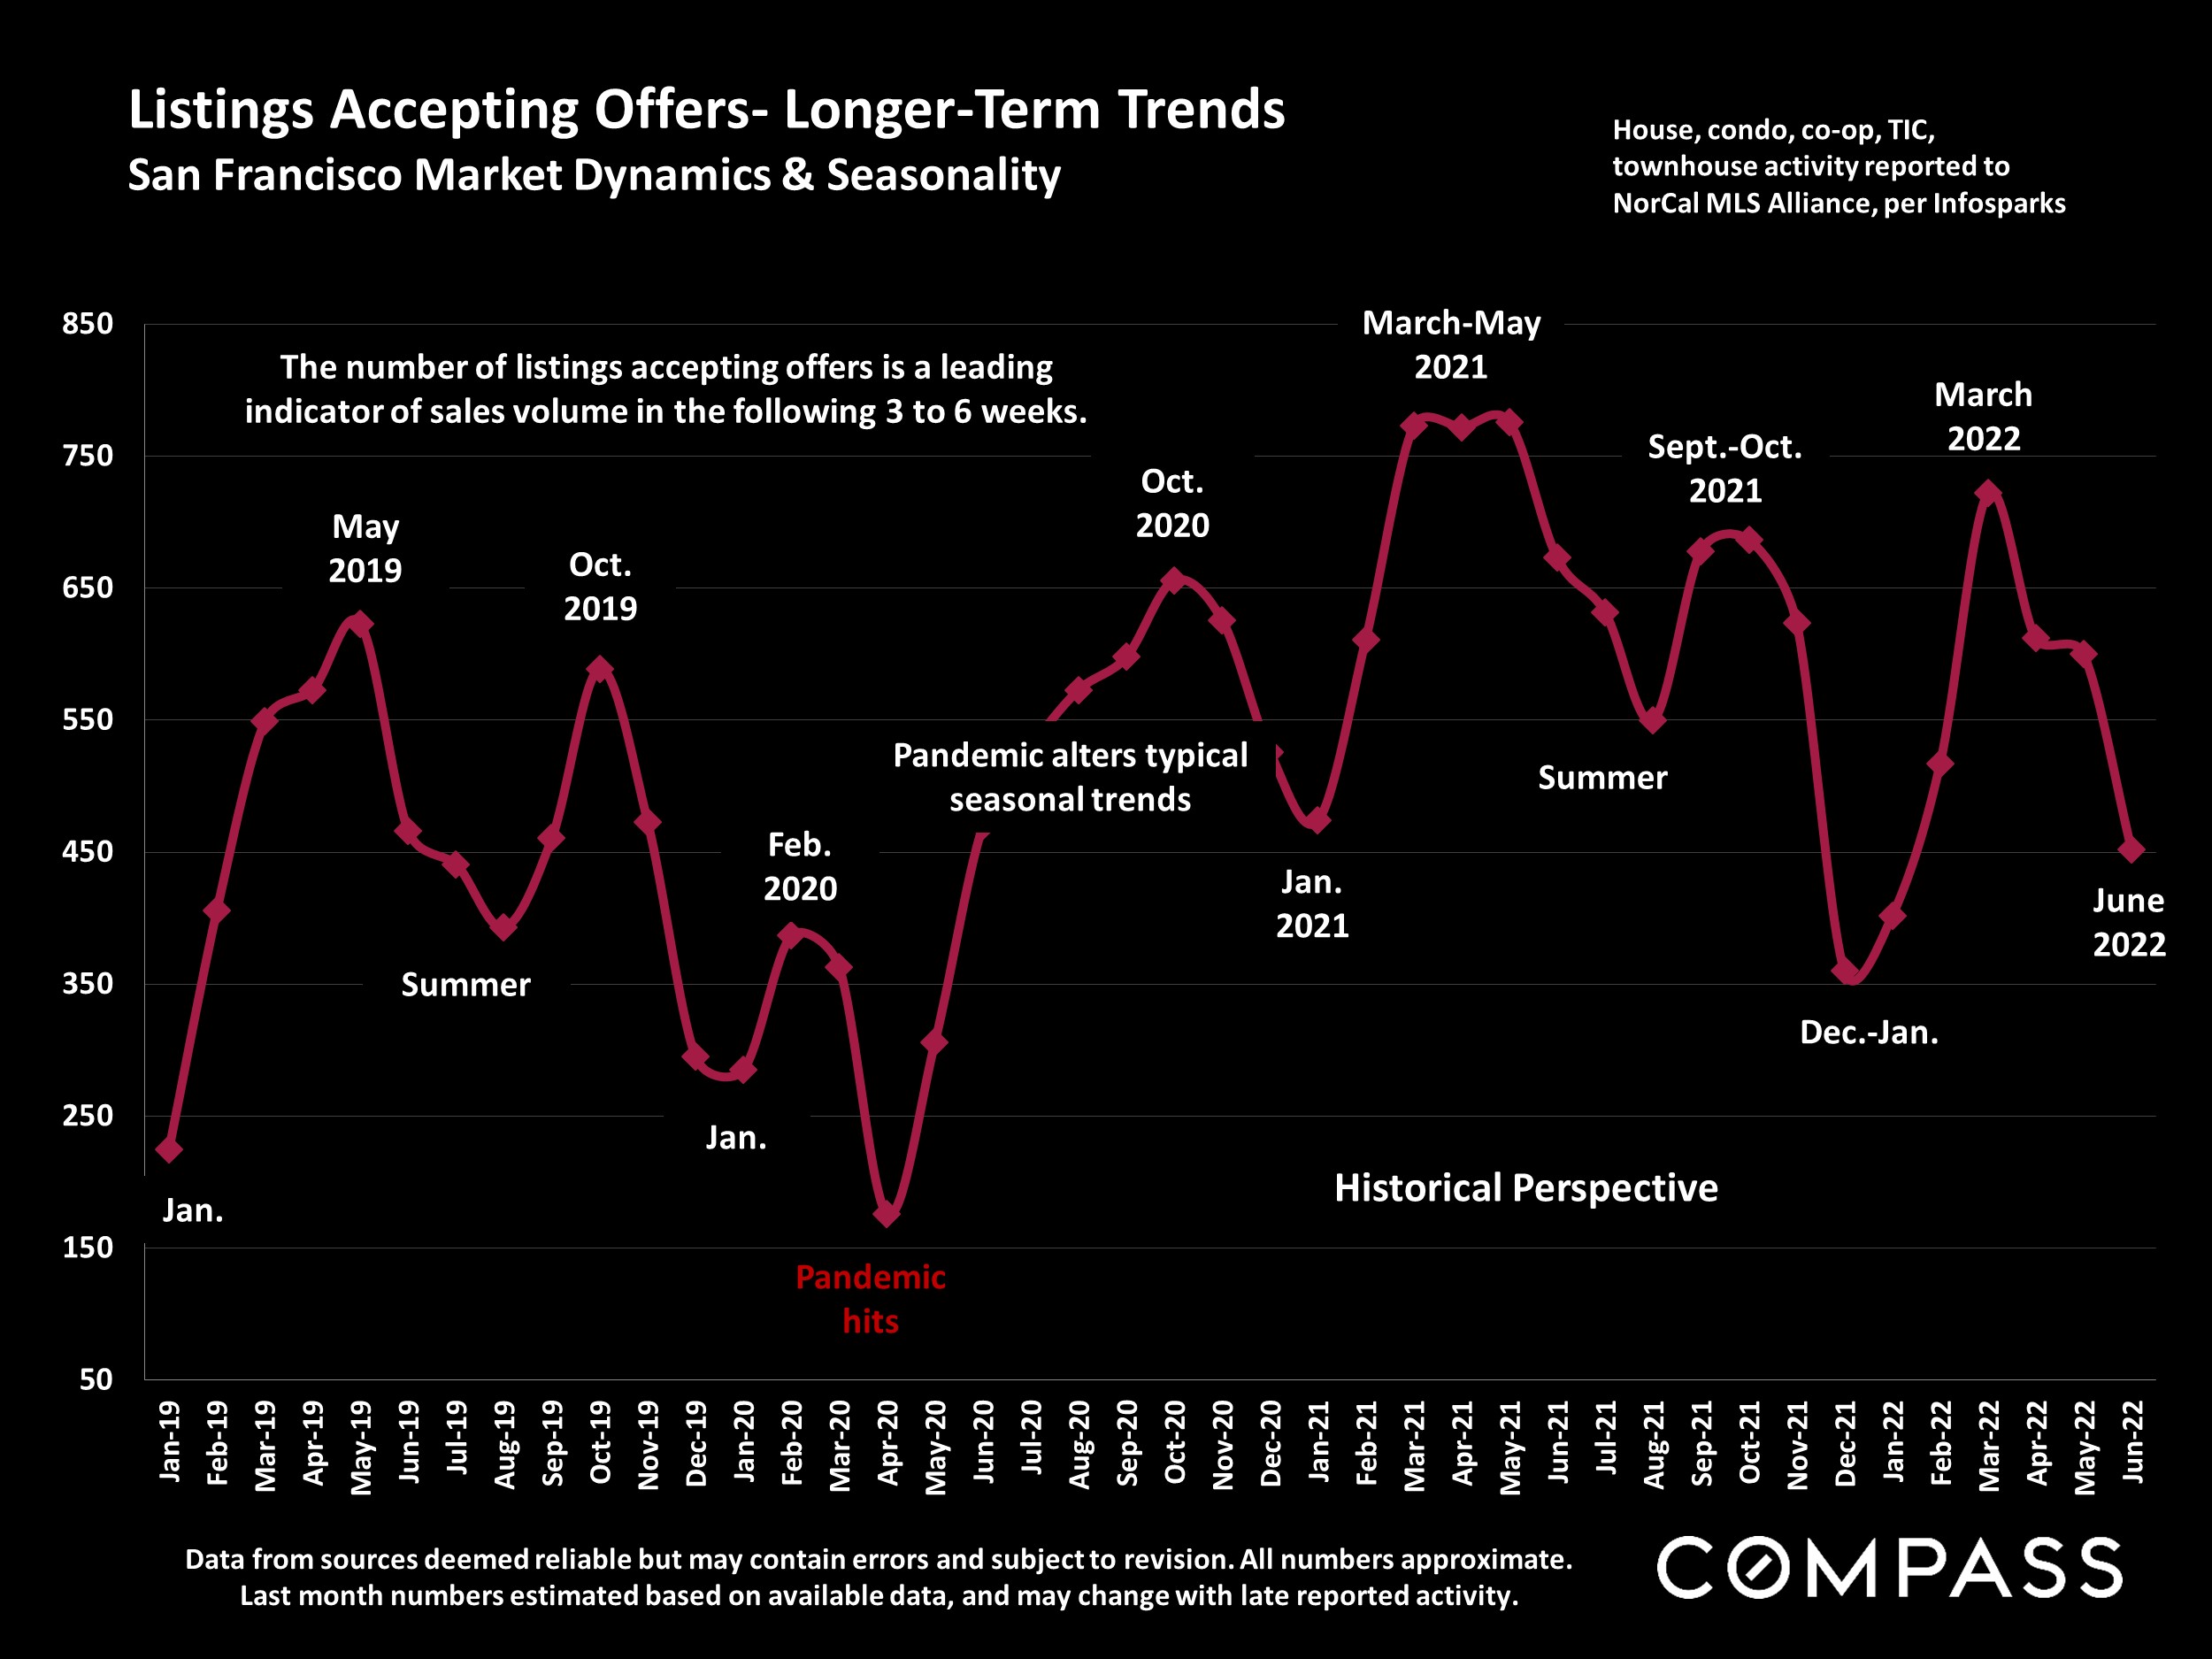
An overheated market cooling or normalizing, slowing from an unsustainable rate of acceleration, does not necessarily imply a weak market by historical standards, even if the speed and scale of the change are startling. This report will review year-over-year changes in supply and demand, reflecting the significant adjustments occurring, but also longer-term trends to provide greater context to these recent changes.
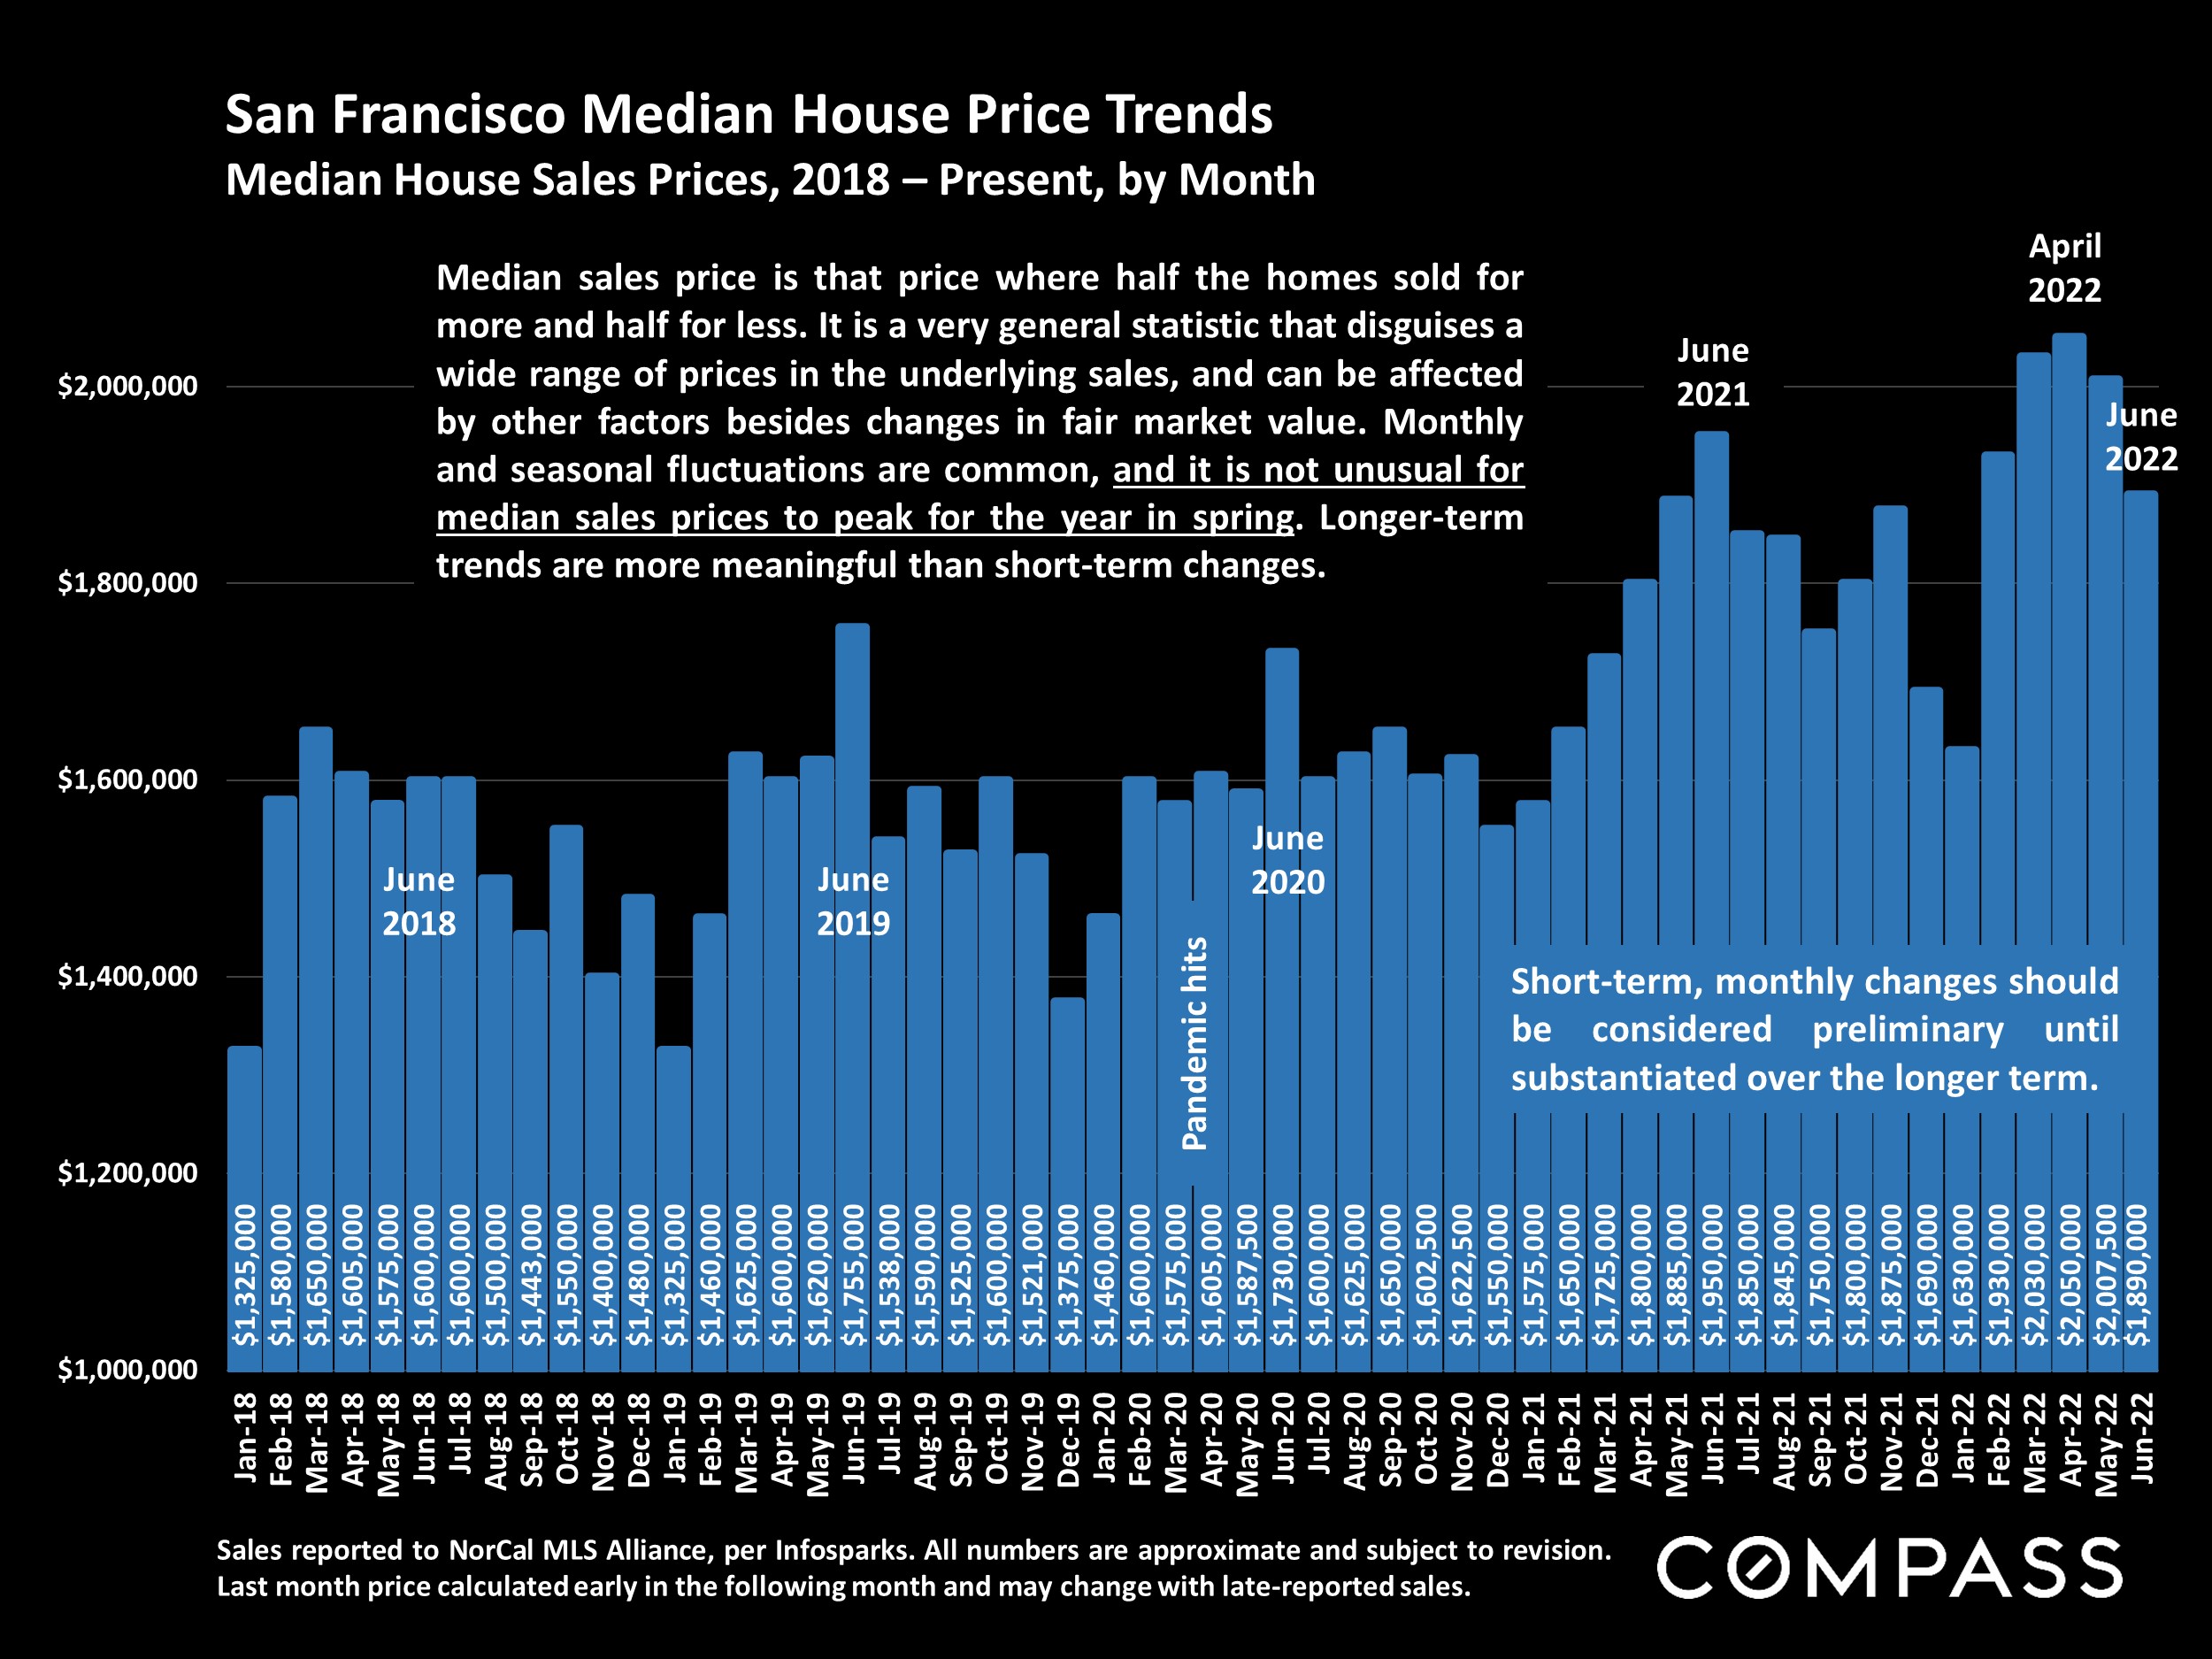
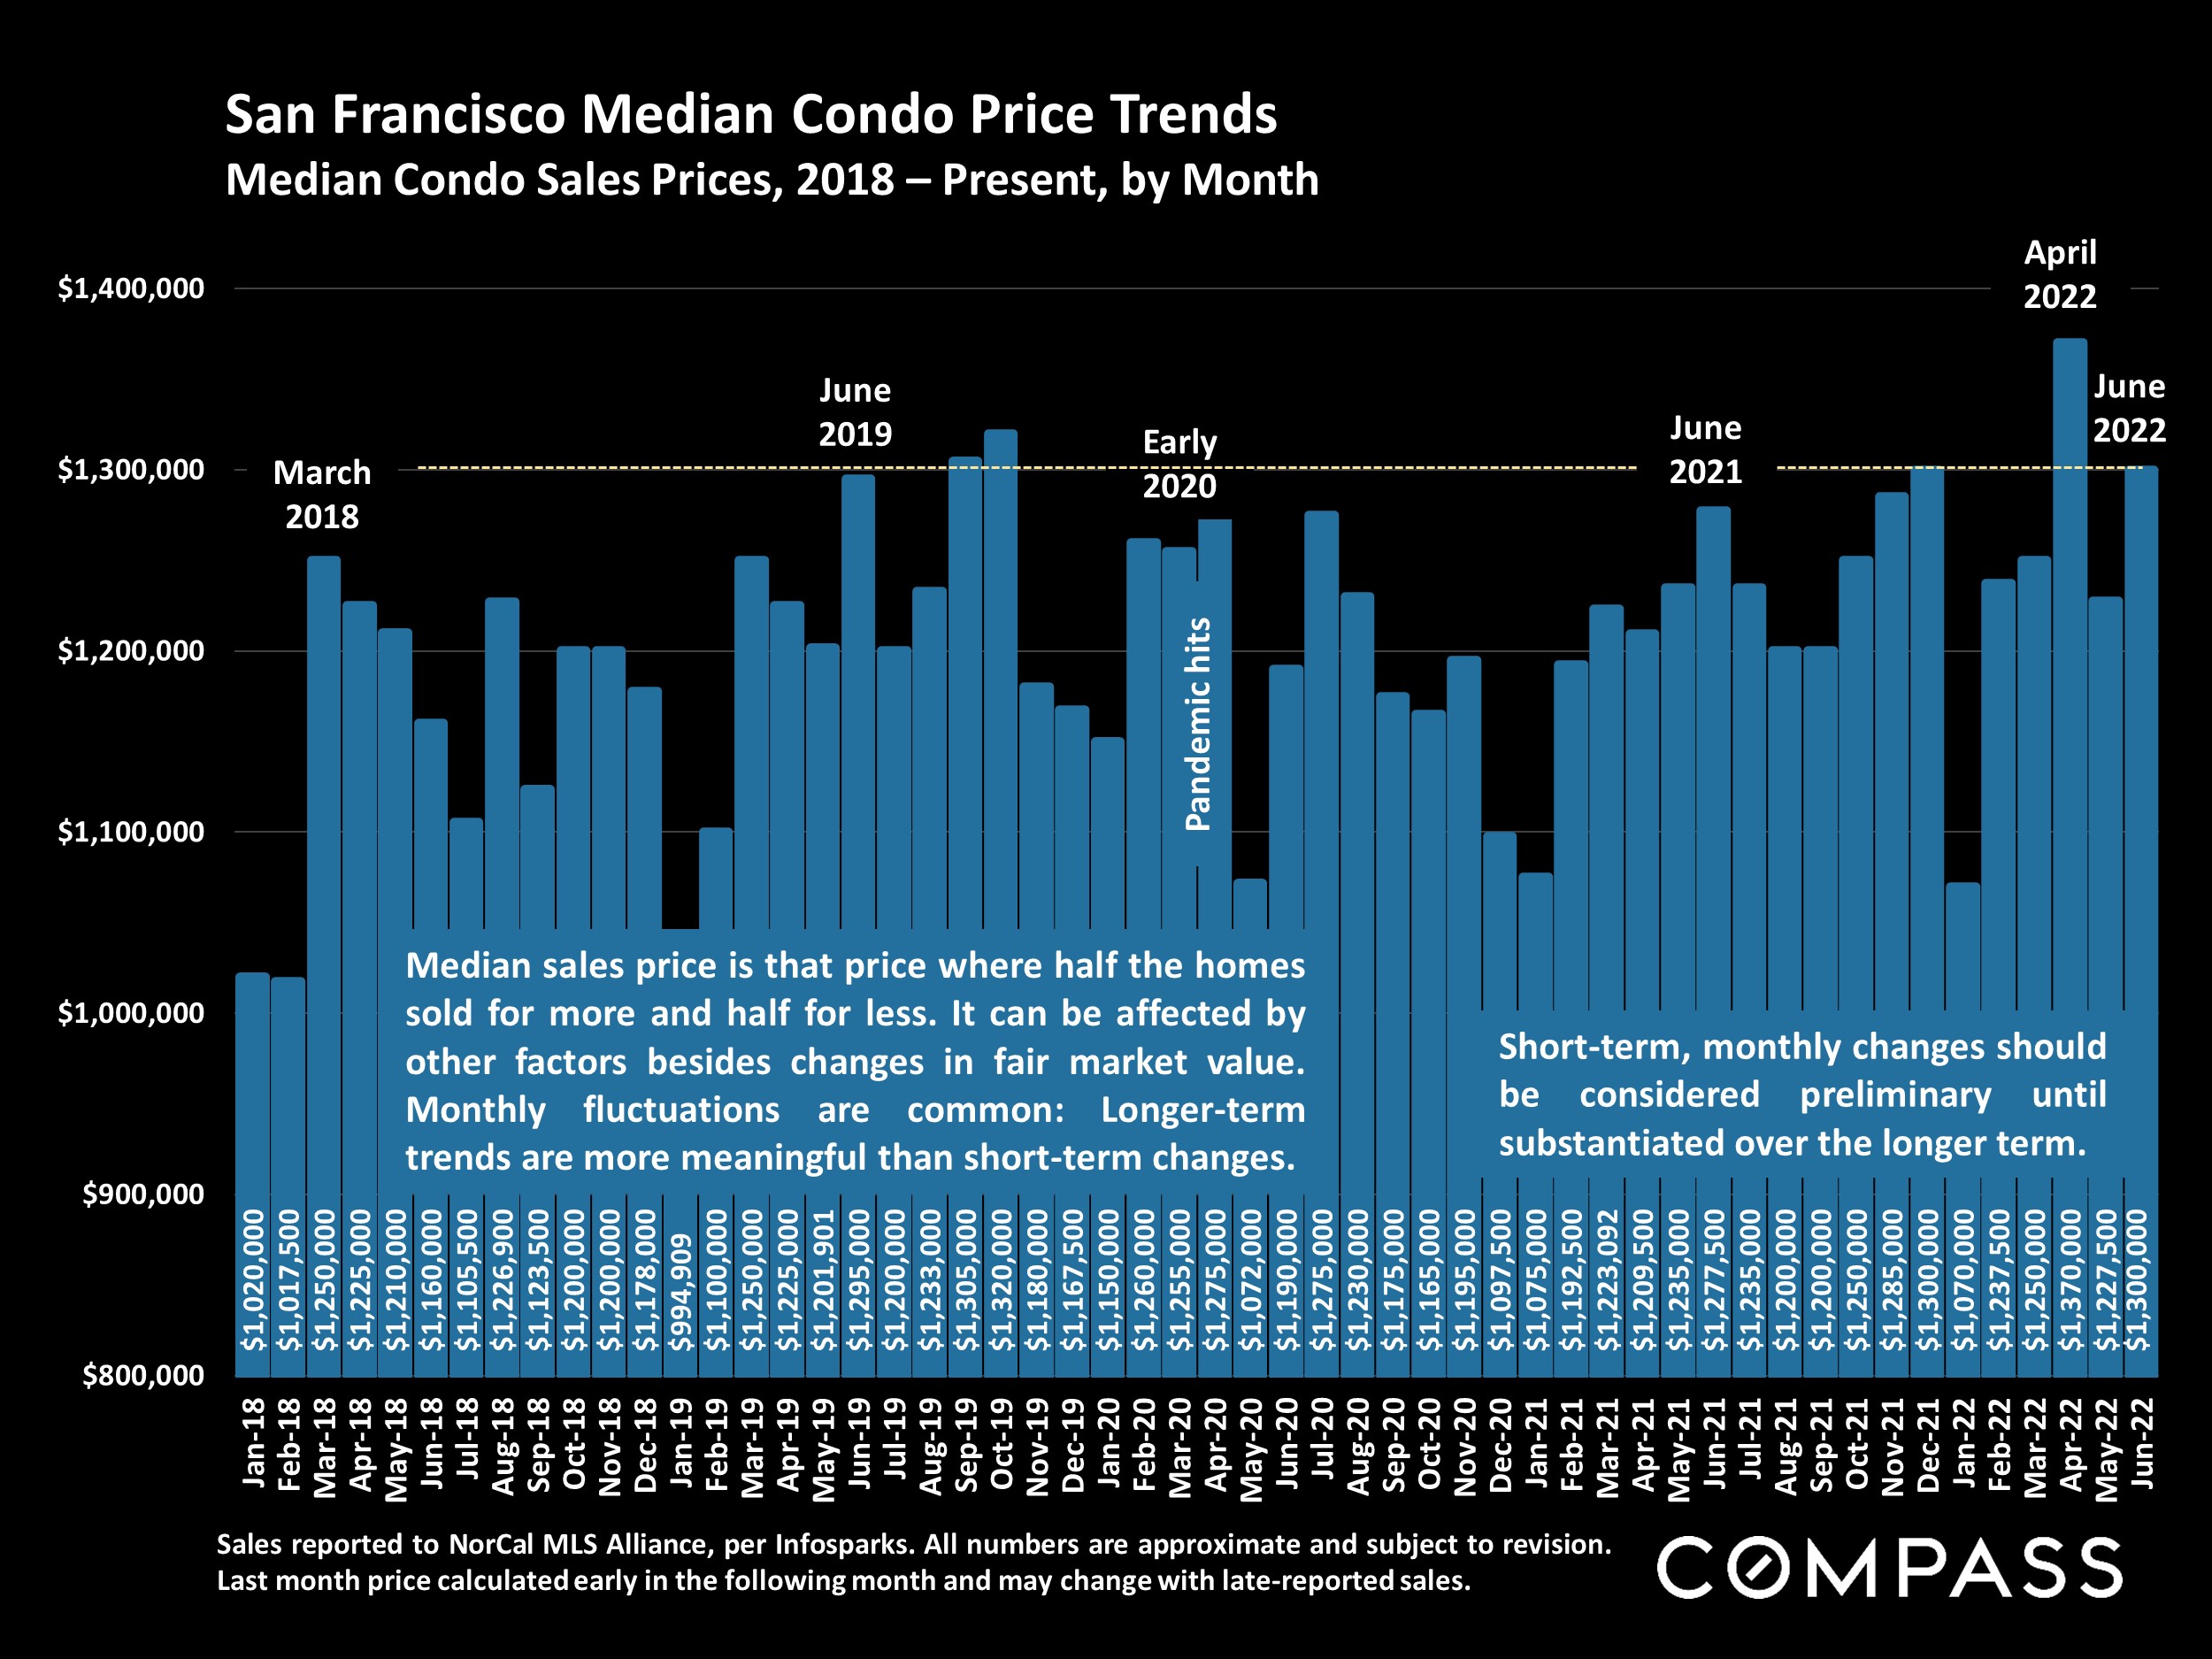
Monthly data can be volatile, fluctuating according to a number of factors, including market seasonality. For example, in most Bay Area markets, it is not unusual for median sales prices to peak for the year in spring or early summer. It is best not to jump to definitive conclusions based on a few months of data, much less a single month’s: Longer-term data is more meaningful than short-term fluctuations.
Different regions and market segments are cooling at differing speeds, and each region has unique conditions – and in the Bay Area, each home is relatively unique as well. But barring very special
circumstances, markets across the Bay Area (and the country) can be expected to eventually move in roughly parallel directions because of the broad macroeconomic factors at play. This report reviews many of these factors. As of July 7, 2022, according to FHLMC, the average weekly mortgage rate for a 30-year fixed rate loan fell to 5.3% from 5.81% two weeks earlier.
If you have any questions or want to talk more about local market trends, please don't hesitate to reach out. I'd be happy to grab a coffee or chat via phone.
Thank you,
Shannon
Want to learn more about Bay Area market trends?
Let’s connect! With relationships and networks across the city, there are a variety of ways I can help you make informed real estate decisions. Call, email, or text – I’m here to help.
Contact