Feature image for SF: December 2023 Market Stats

December 11, 2023

SF: December 2023 Market Stats

By Compass

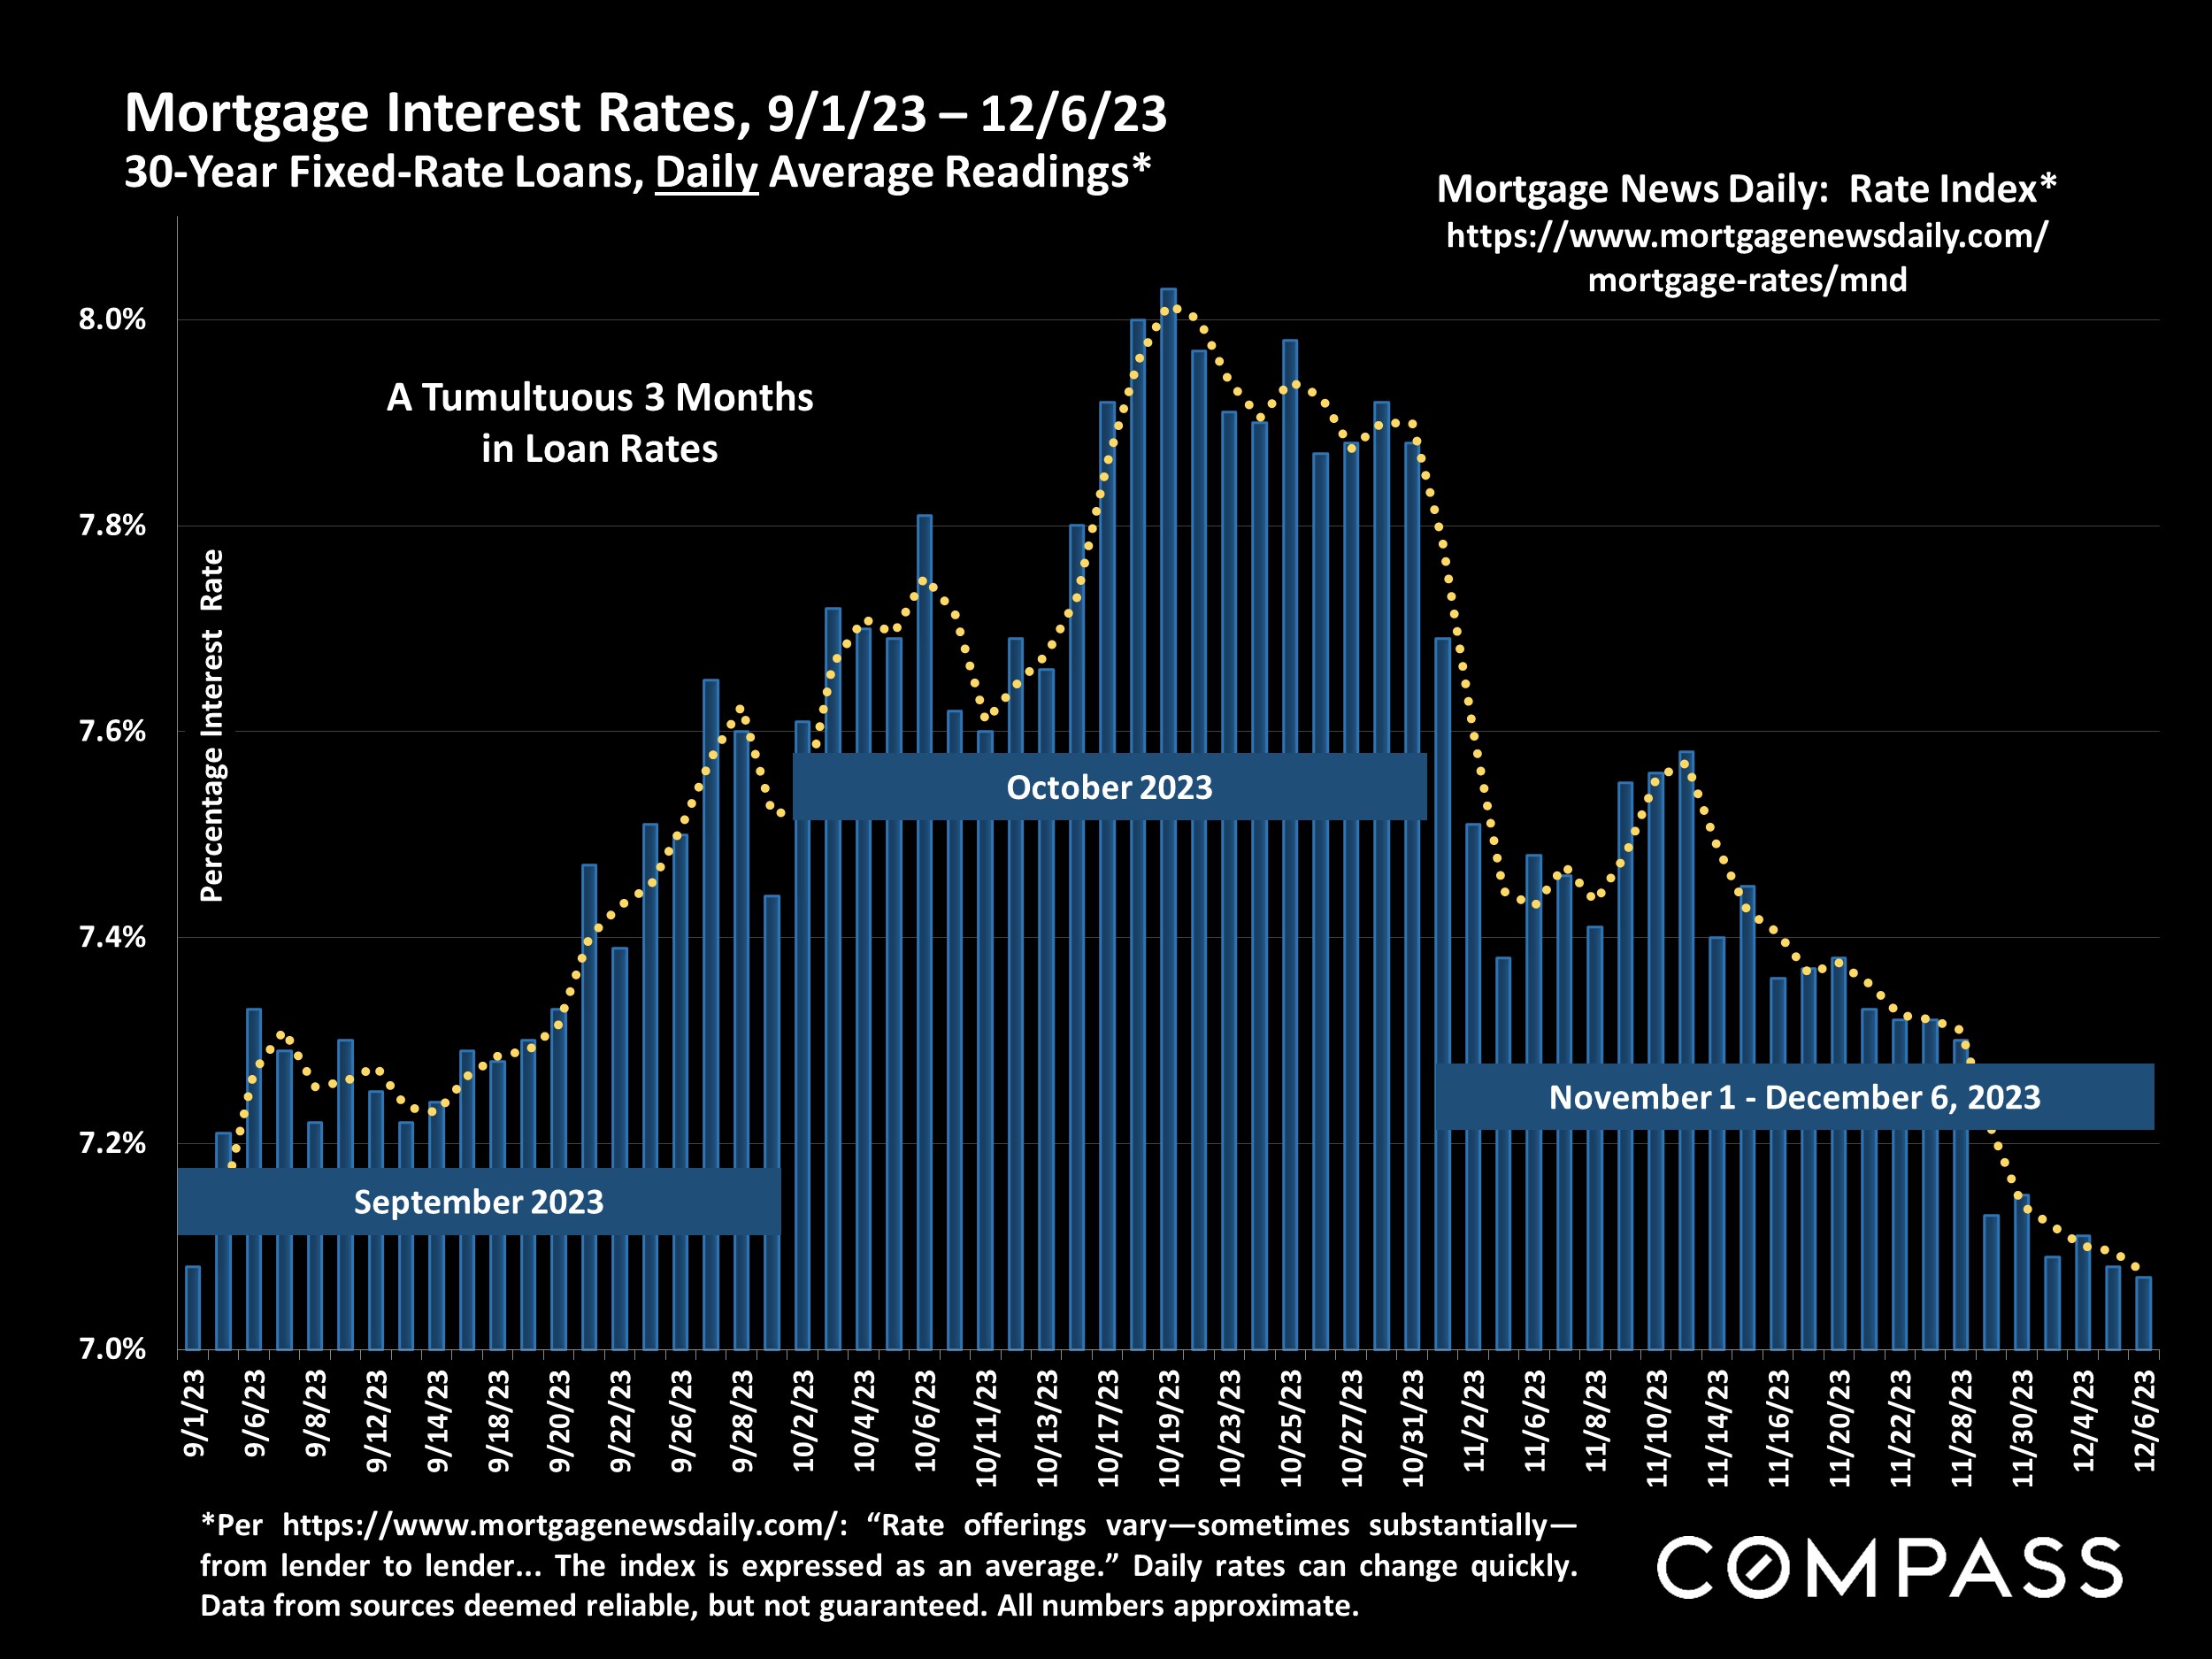
“For the sixth straight week, mortgage rates trended down, as new data indicates that inflationary pressures are receding. The combination of continued economic strength, lower inflation, and lower mortgage rates should likely bring more potential homebuyers into the market.” Freddie Mac (FHLMC)

Stock and bond markets– which greatly impact household wealth, consumer confidence, and interest rates– were generally characterized by deep pessimism in October, but with significant changes in economic indicators such as inflation, and a continued pause in benchmark rate increases by the Fed, financial markets abruptly shifted to enthusiastic optimism in November. That translated into a dramatic plunge in mortgage rates, which has caused mortgage applications to increase over recent weeks.

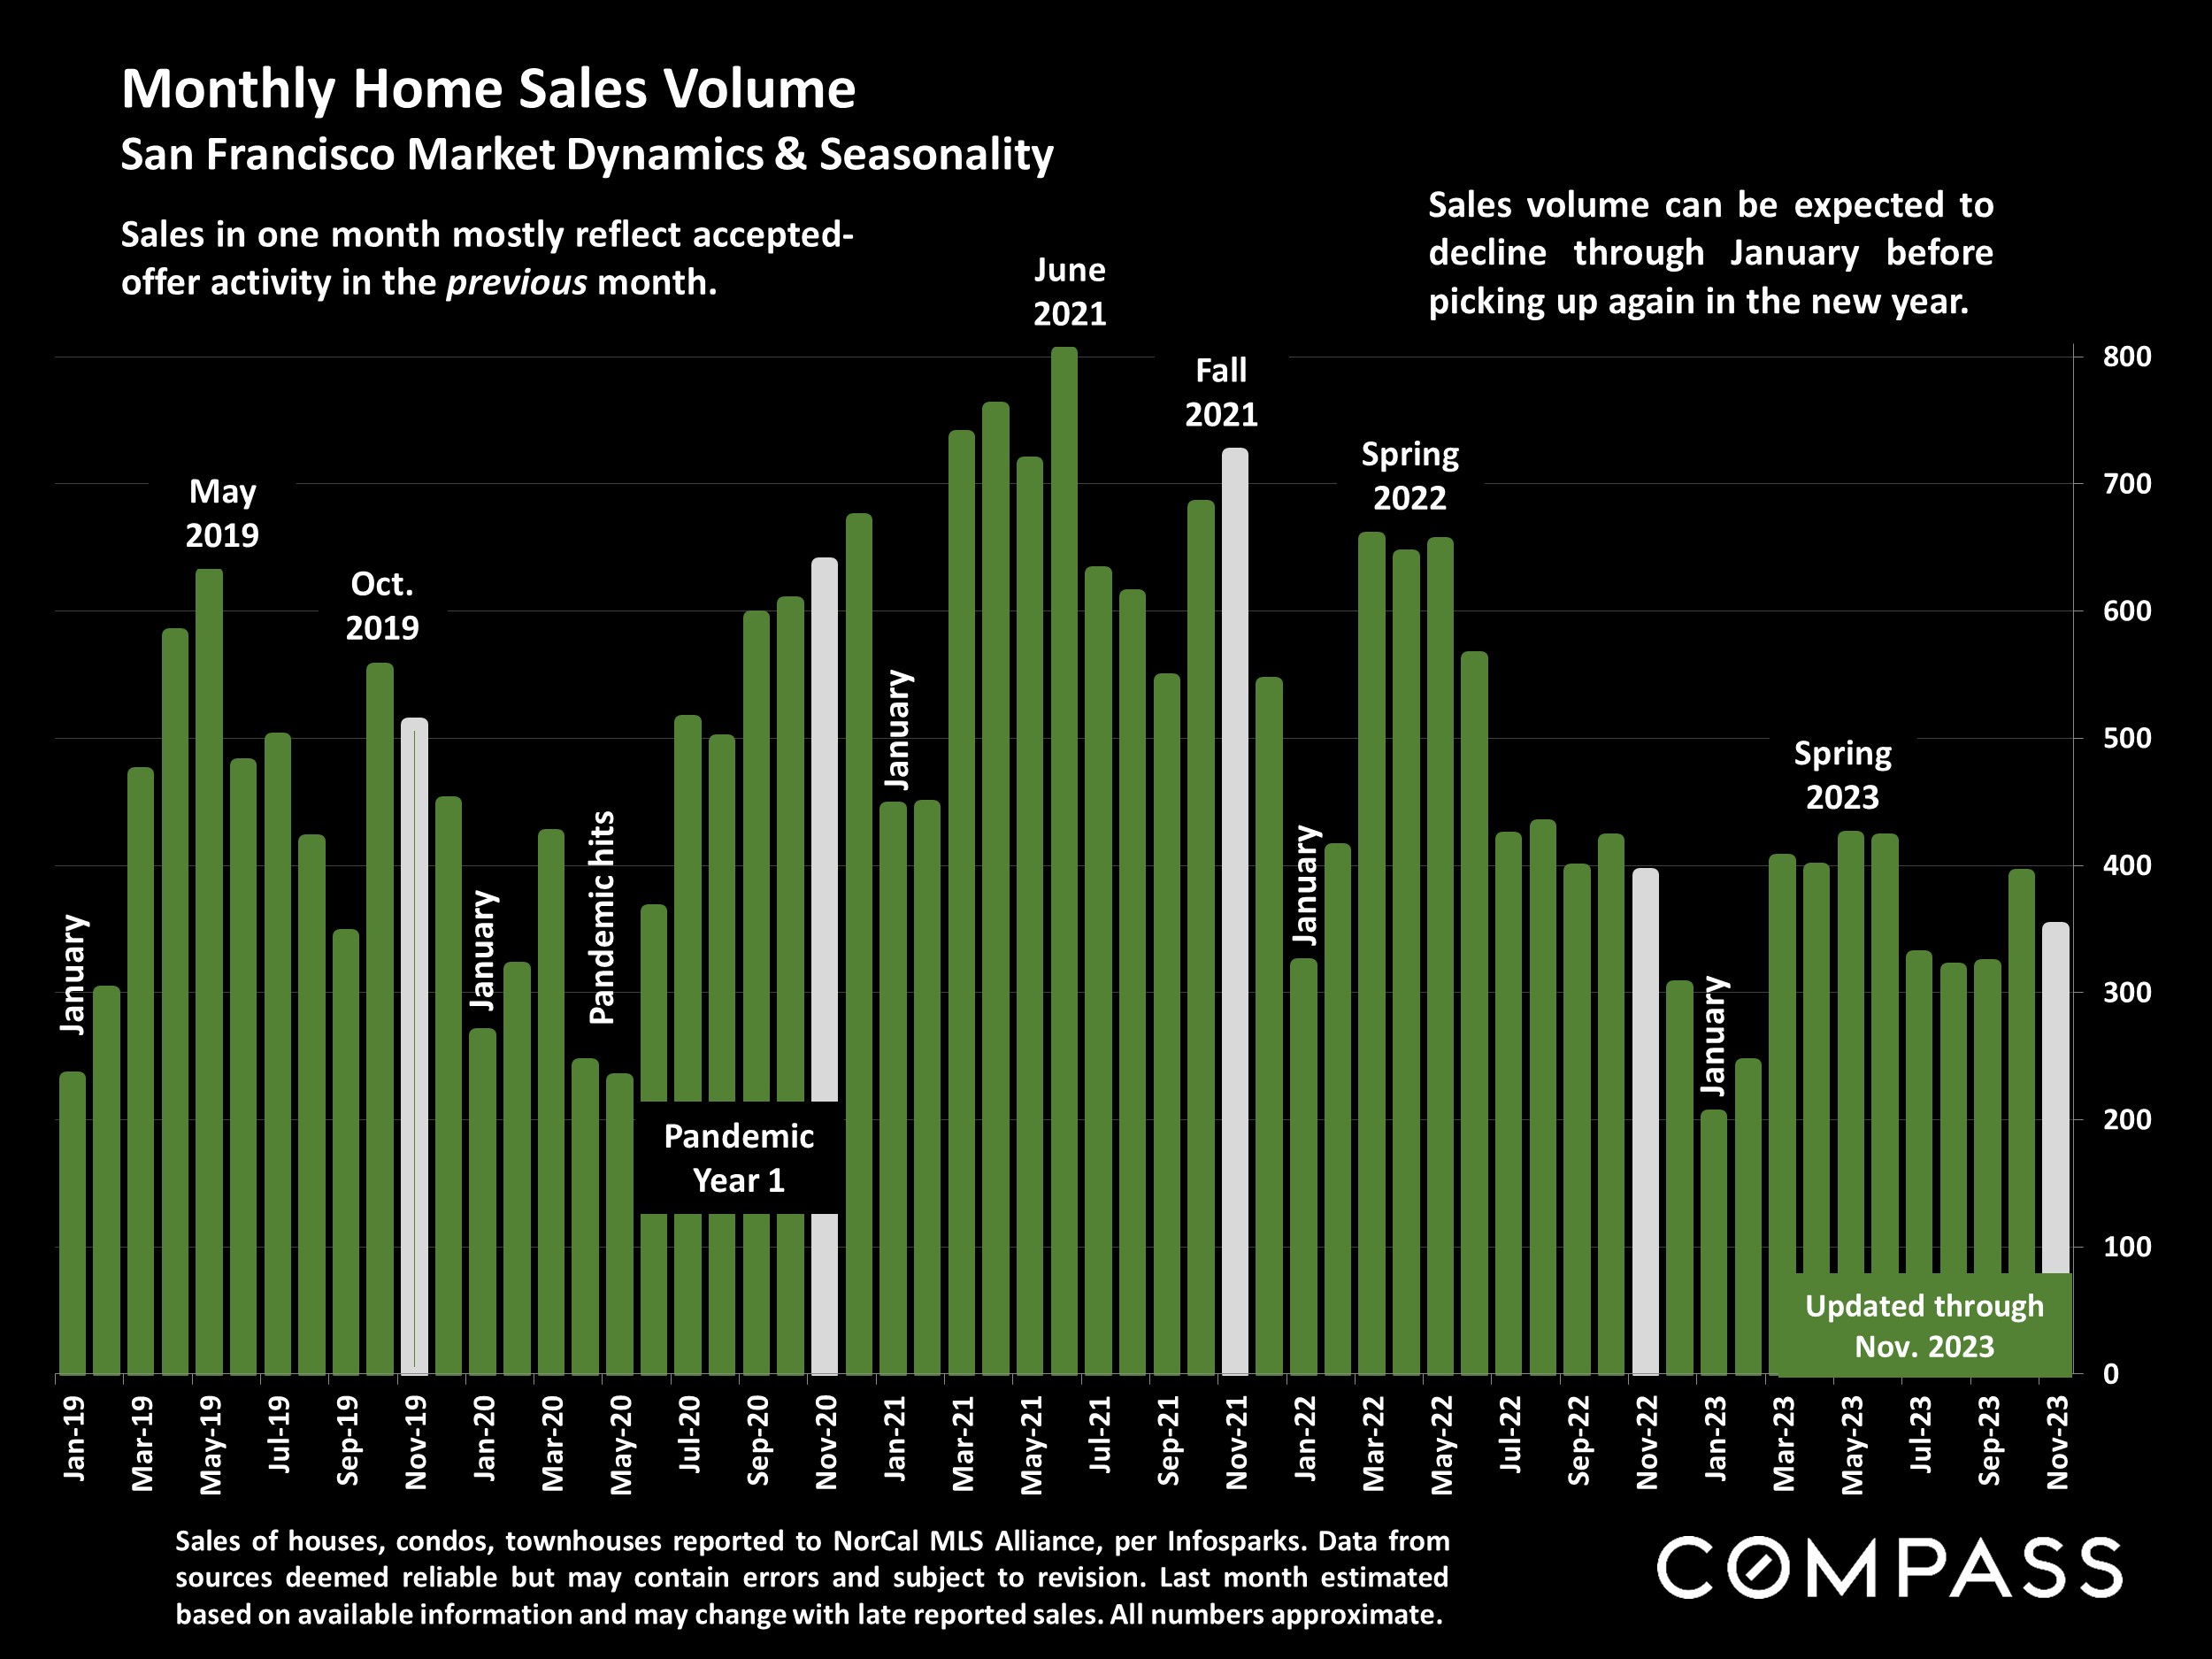
Since the home-buying process usually takes 30 to 60 days, from loan qualification and making an offer to a closed sale, sales might see a bounce in December, or– since the mid-winter holiday period typically sees the annual low point in new listing (and thus sales) activity– more likely in early 2024 (subject to these positive trends continuing).

In January 2023, buyer demand saw a substantial rebound due to a similar drop in interest rates in late 2022.

Mortgage Interest Rates, 9/1/23 – 12/6/23 30-Year Fixed-Rate Loans, Daily Average Readings*San Francisco HOUSE Price Trends since 1990 Monthly Median House Sales Prices, 3-Month RollingSan Francisco CONDO Price Trends since 2005 Median Condo Sales Price, 3-Month RollingSan Francisco CONDO Price Trends: Downtown vs. Non-Downtown 6-Month-Rolling Median Condo Sales Prices since 2005*San Francisco Home Sales Trends, 2021-2023 Year-over-Year, Year-to-Date Sales by Price Segment*New Listings Coming on Market San Francisco Market Dynamics & SeasonalityNew-Listing & Home Sales Volumes: Broad, Longer-Term Trends San Francisco, 12-Month-Rolling Data since 2005*San Francisco Homes Market Active & Coming-Soon Listings on 1st of Month*Active Listings on Market – Longer-Term Trends San Francisco Market Dynamics & SeasonalityListings Pending Sale (in Contract, Offer Accepted) San Francisco Market Dynamics & SeasonalityMonthly Home Sales Volume San Francisco Market Dynamics & SeasonalitySan Francisco Higher-Price Home Sales* Homes Selling for $3 Million+Price Reductions on Active Listings San Francisco Market Dynamics & SeasonalityAverage Days on Market – Speed of Sale San Francisco Market Dynamics & Seasonality Spring 2022 Pandemic hits Jan. 2019 Jan. 2021 Jan. 2022 Jan. 2020 Condos HousesOverbidding List Prices in San Francisco Percentage of Home Sales Closing over List Price, since 2018Average Sales Price to Original List Price Percentage San Francisco Over/Under Bidding: Market Dynamics & Seasonality4-Year M e d i a n H o u s e S a l e s Price Appreciation R a t e s Comparing August-October Median Sales Prices, 2023 vs. 2019, by County*Highlights from the "2023 Profile of Home Buyers and Sellers" Published by the National Association of Realtors®, 11/13/23U.S. Homeowner: "Probability of Moving" in Next 12 Months Federal Reserve Bank of New York, Survey of Consumer Expectations*Mortgage-Free Homes National Percentage: Homes Owned Free & Clear*


Want to learn more about Bay Area market trends?

Let’s connect! With relationships and networks across the city, there are a variety of ways I can help you make informed real estate decisions. Call, email, or text – I’m here to help.


Contact