
September 12, 2025
Marin: September 2025 Market Stats
By Compass
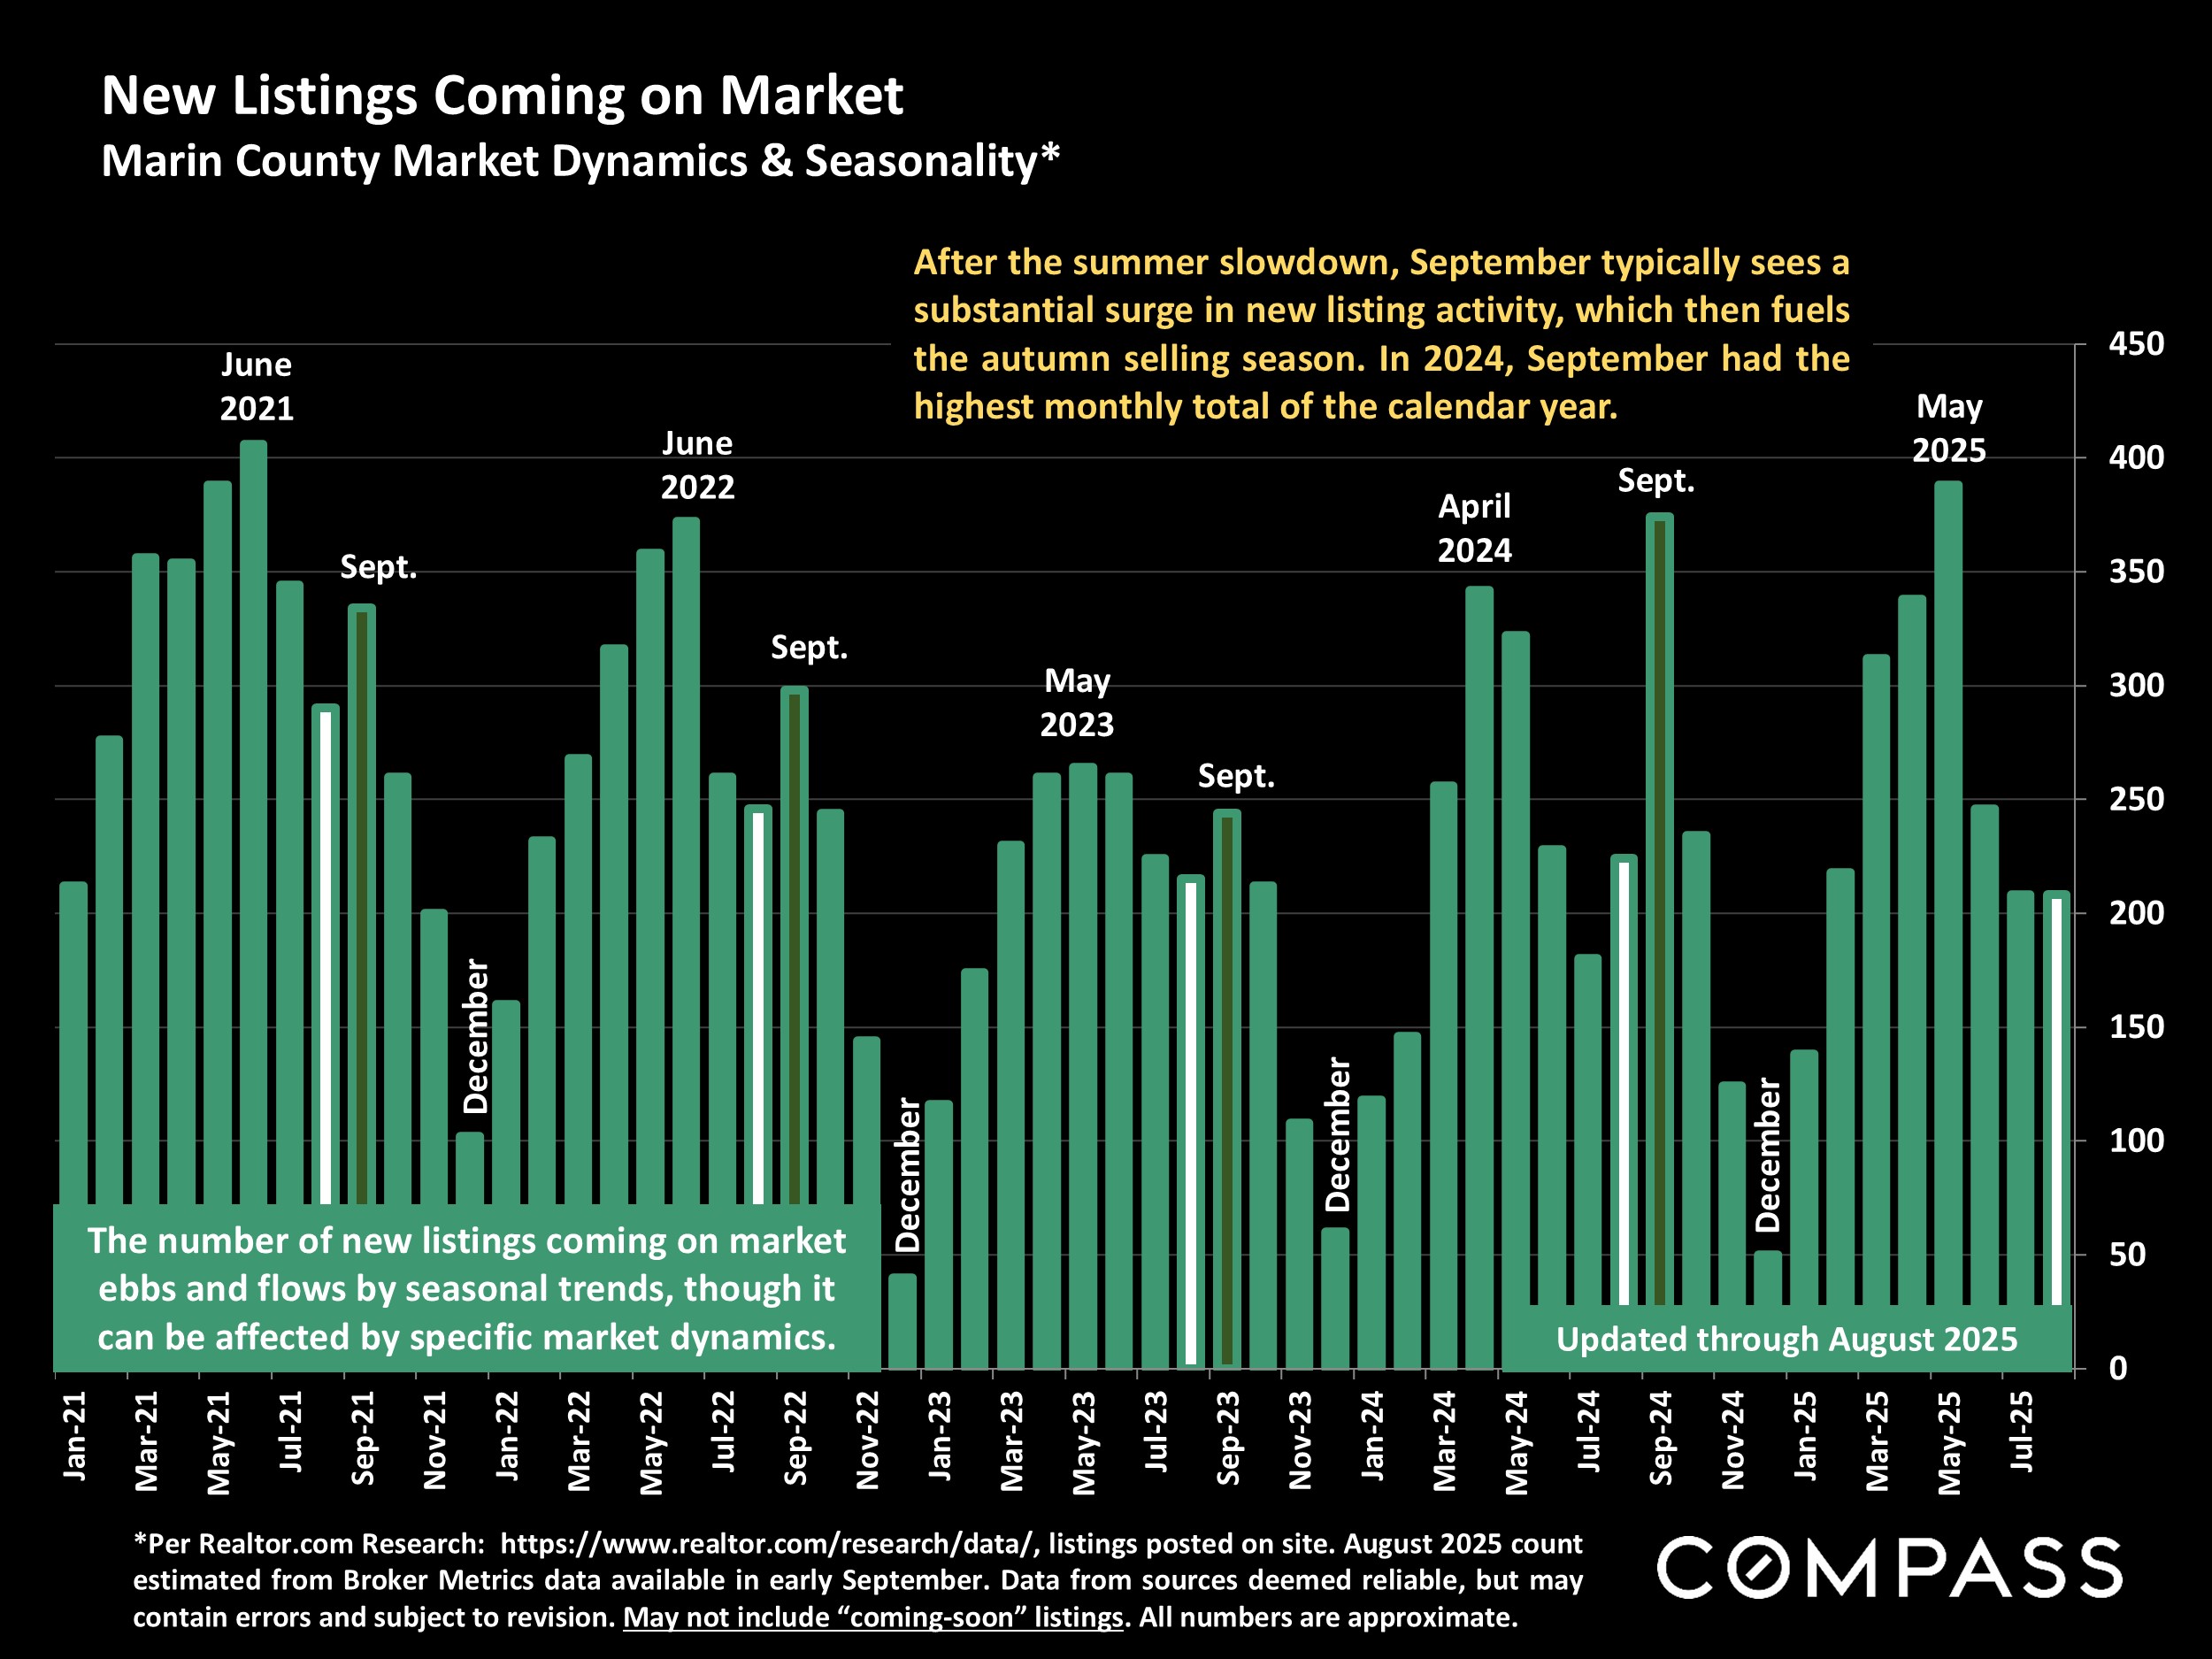
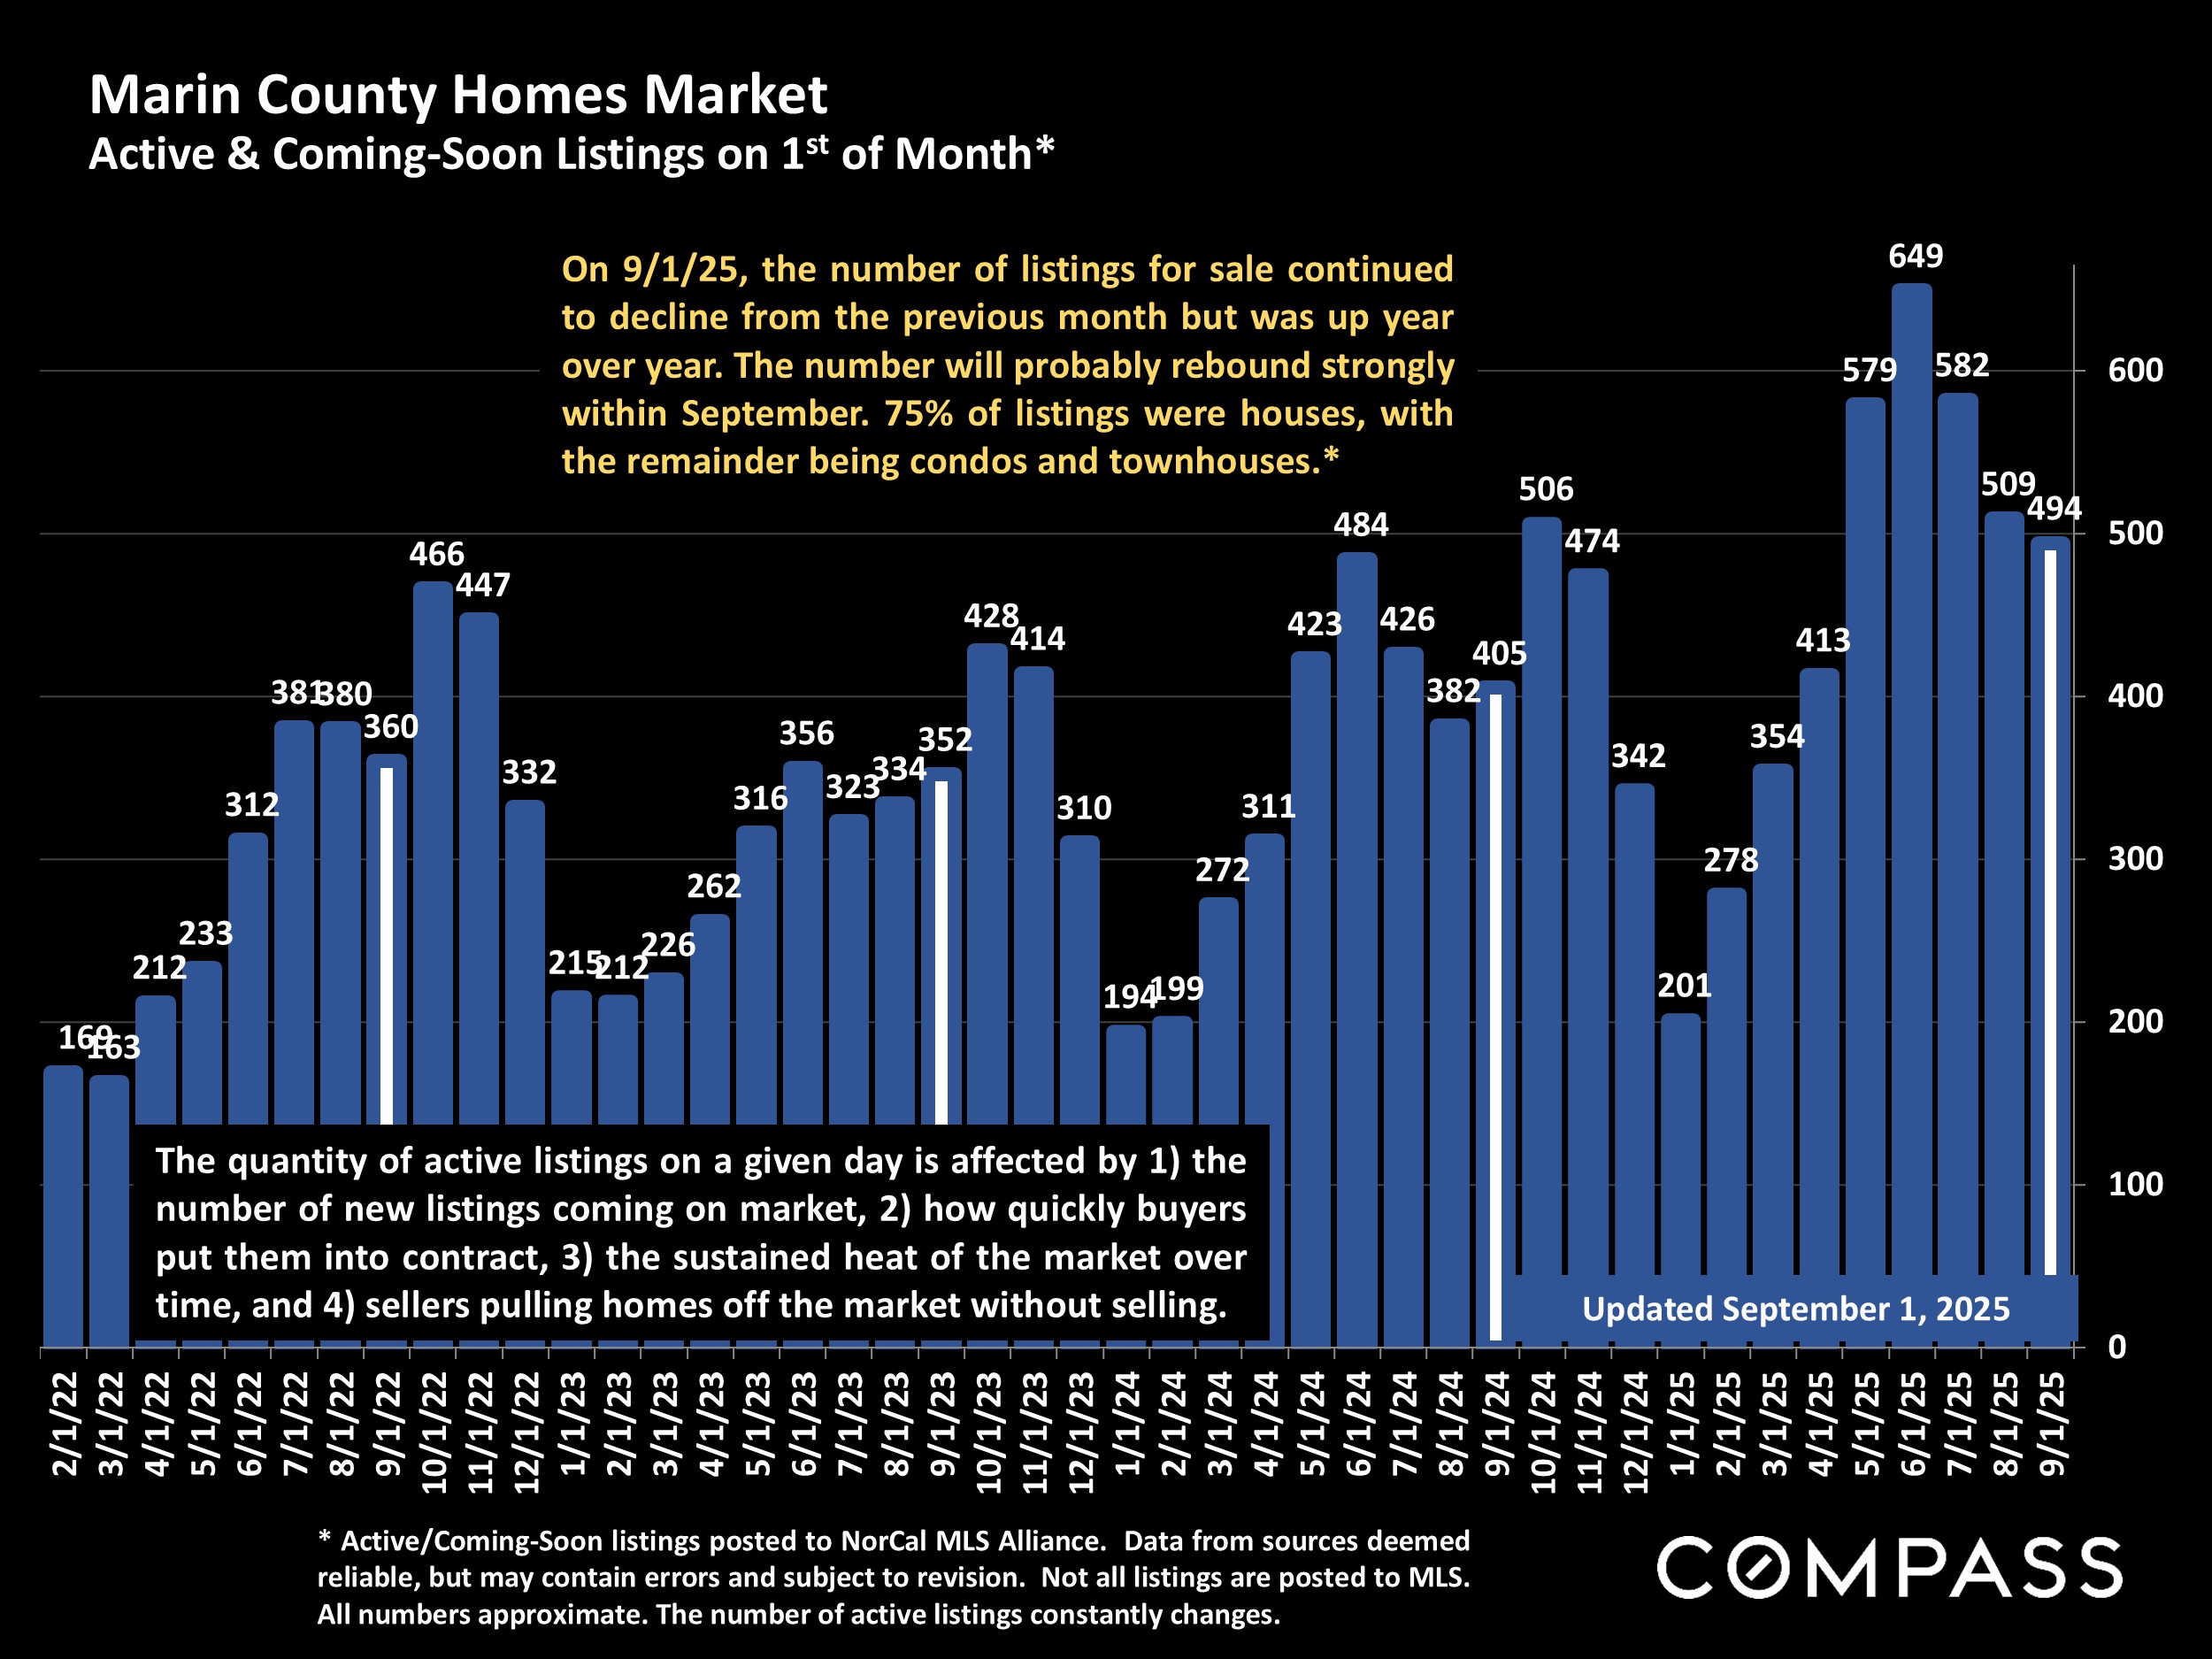
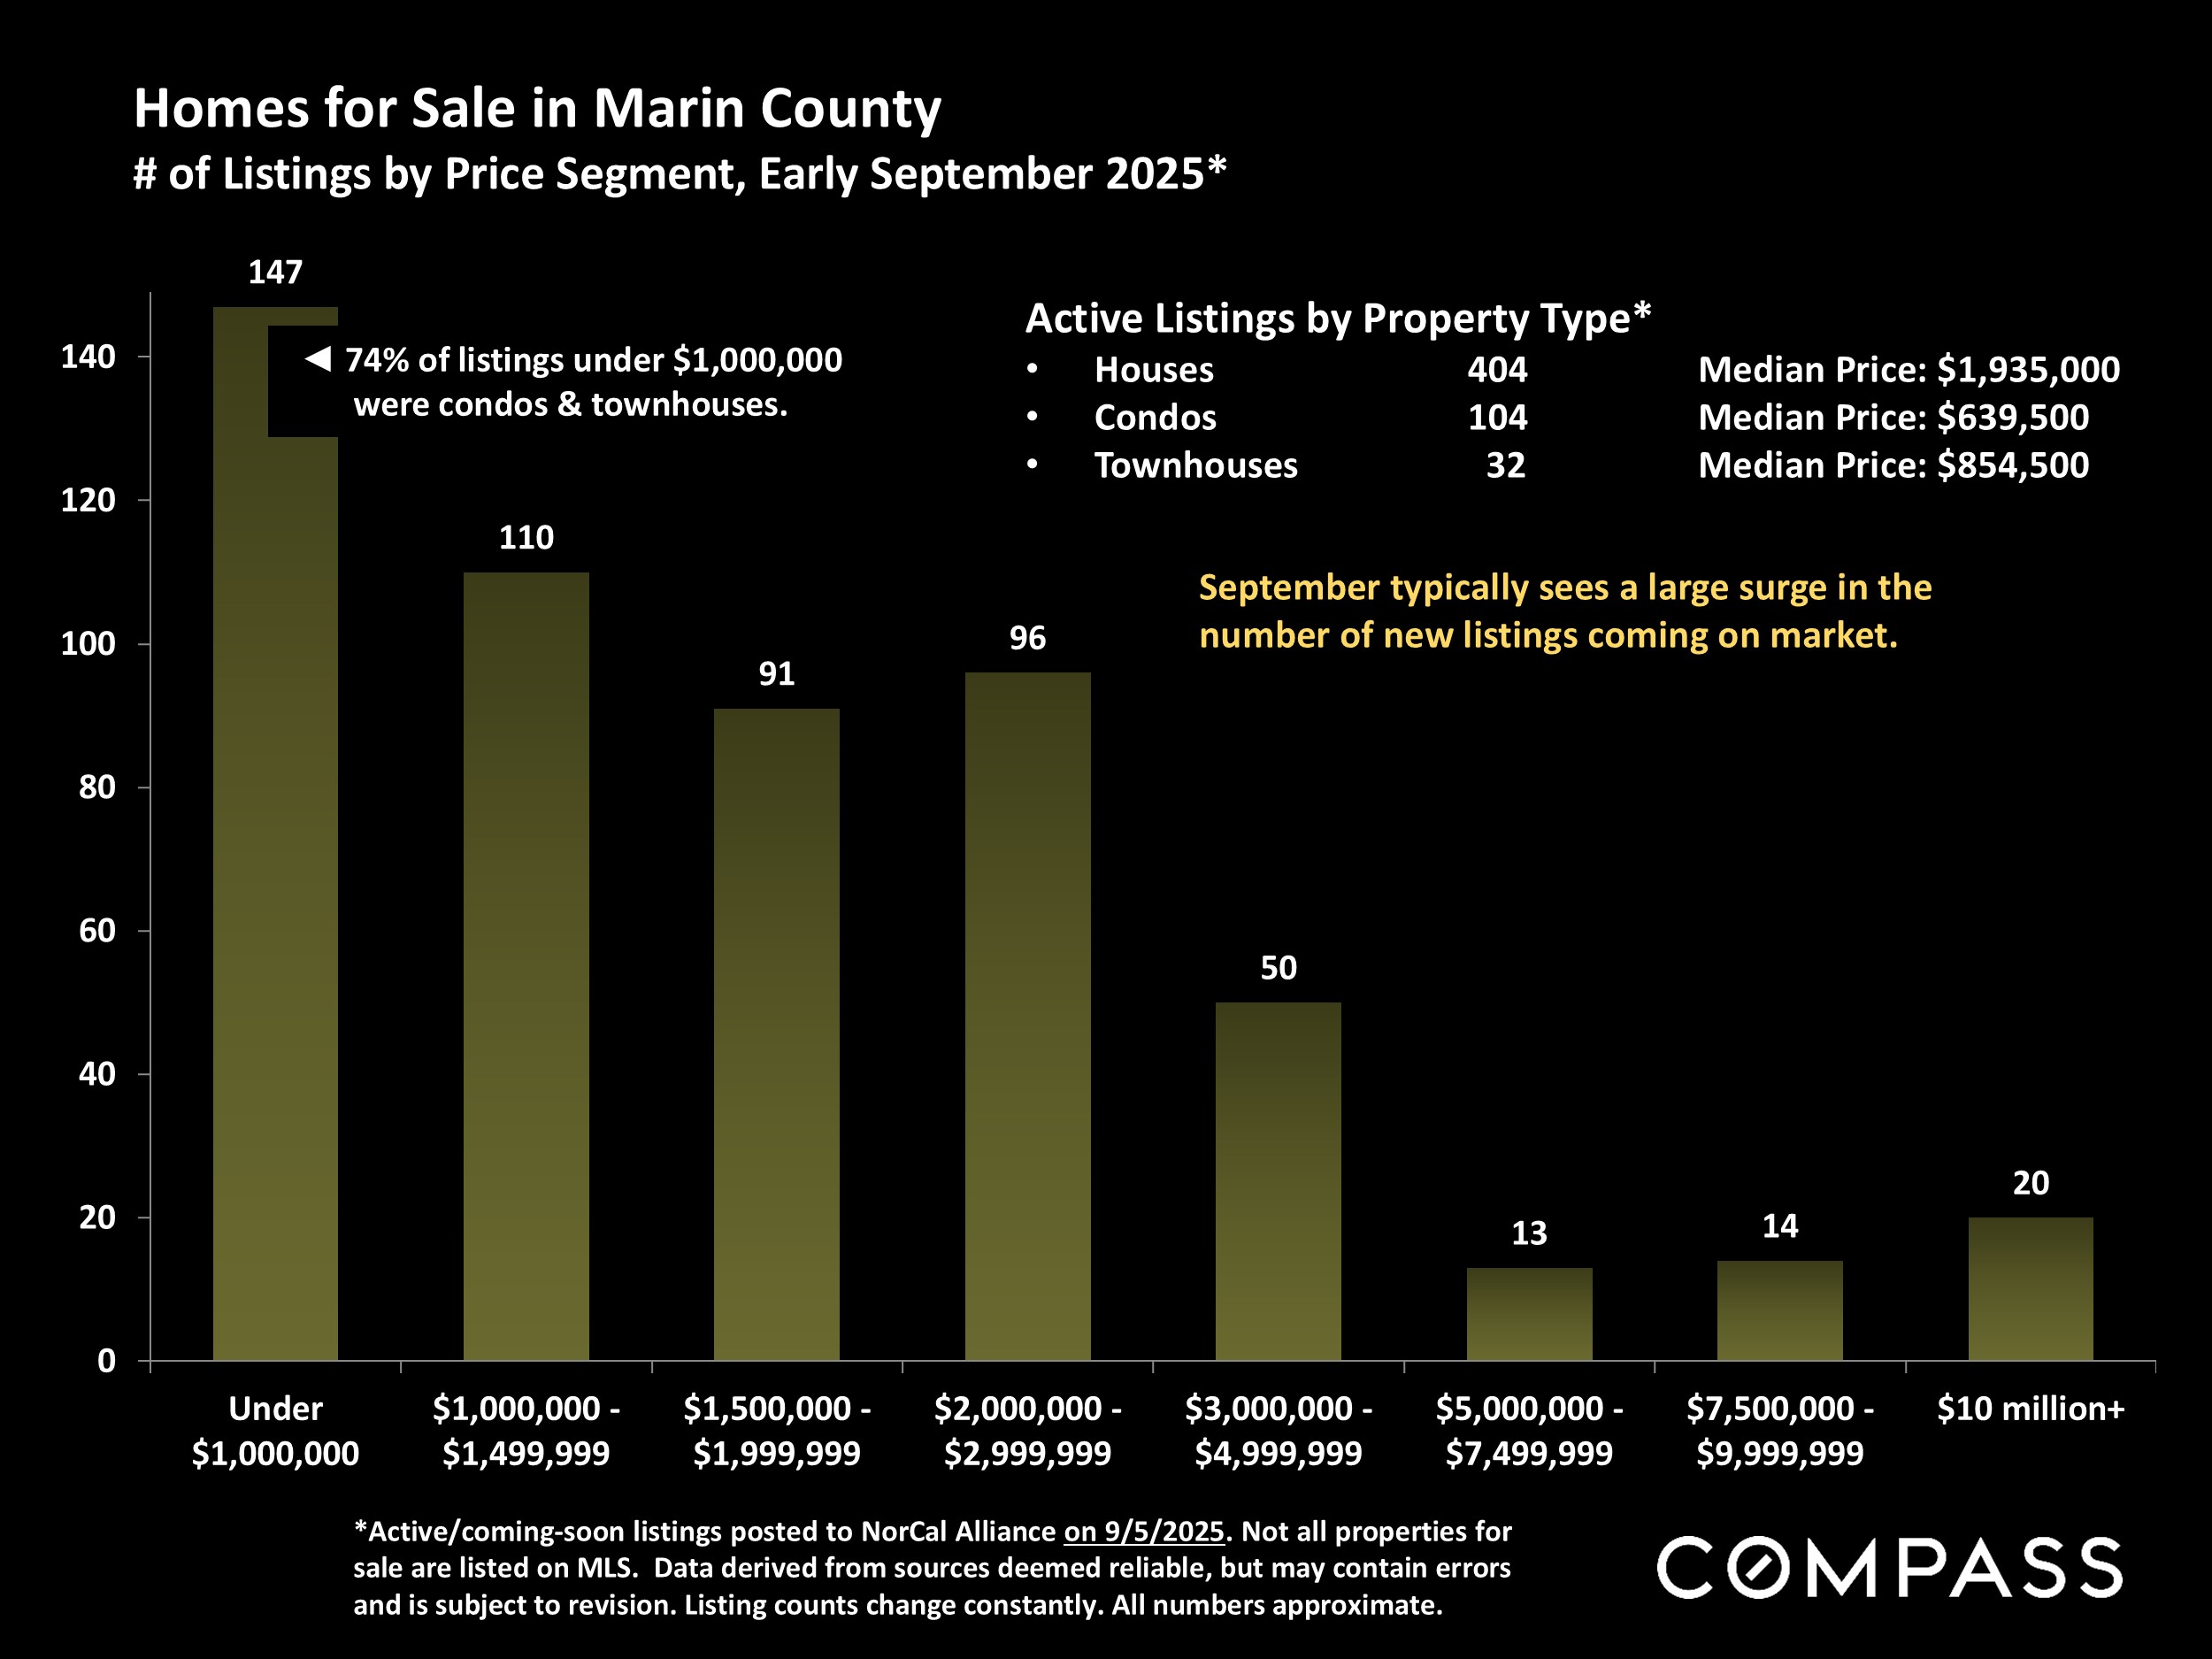
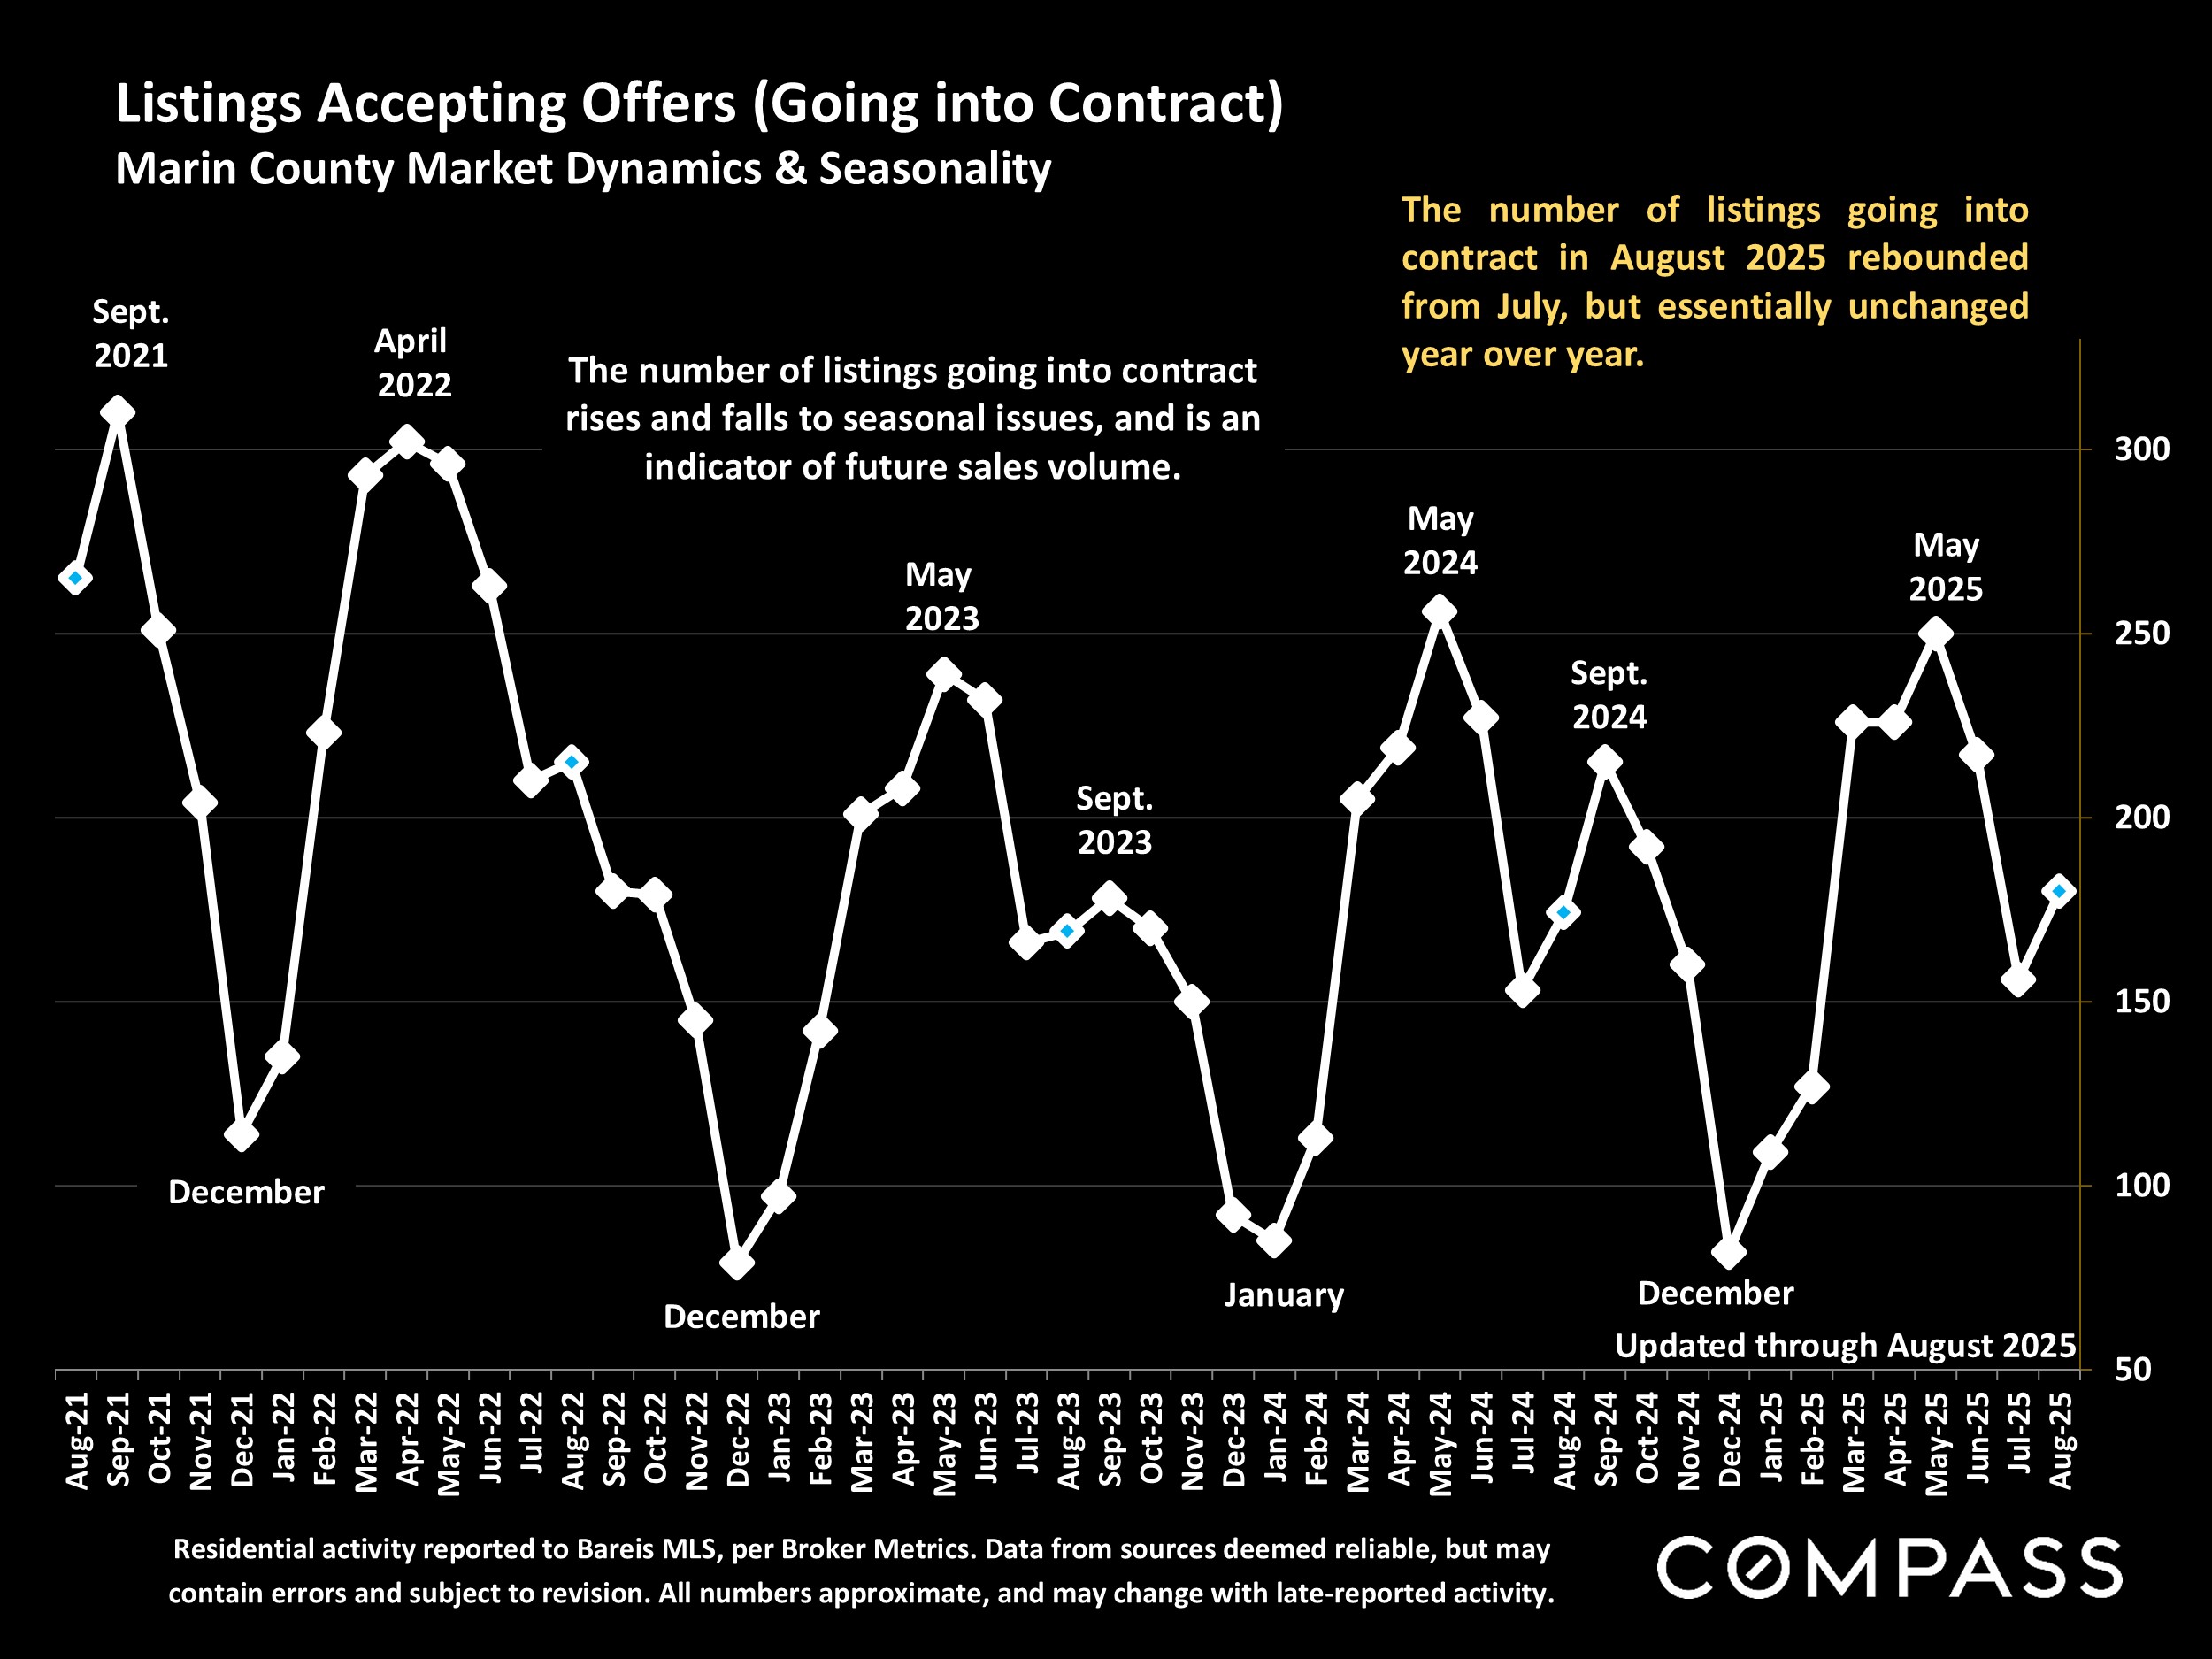
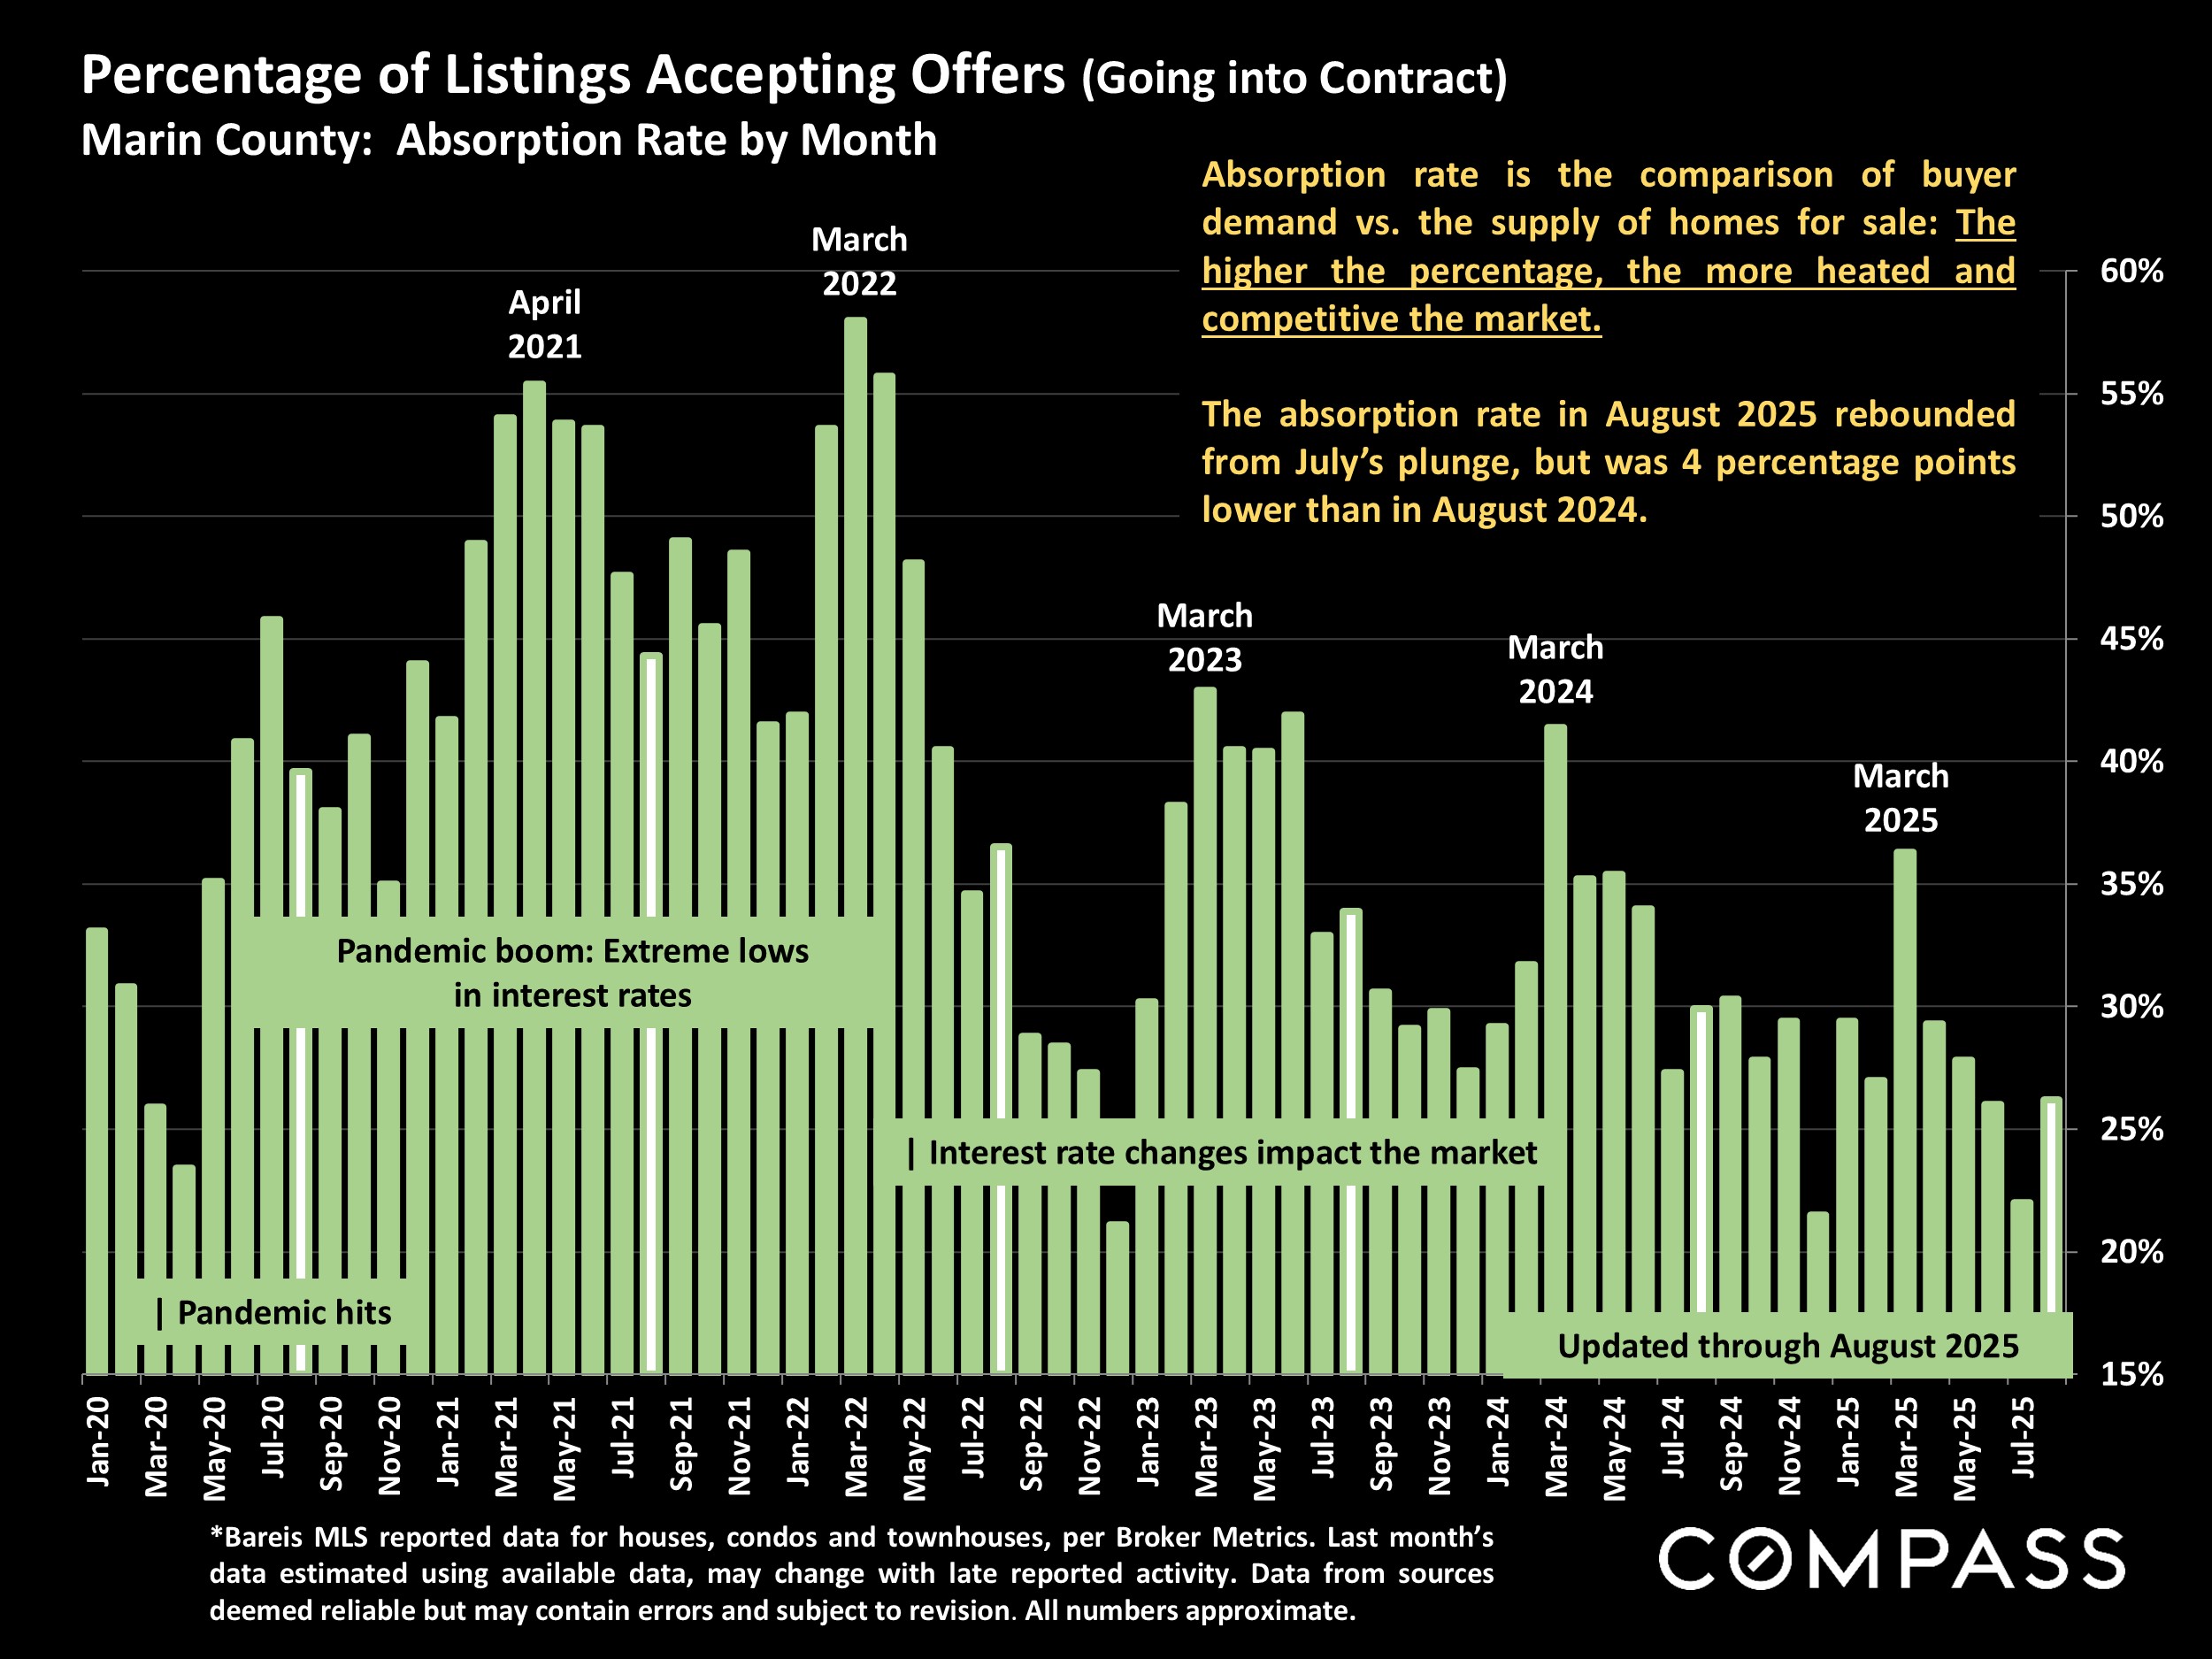
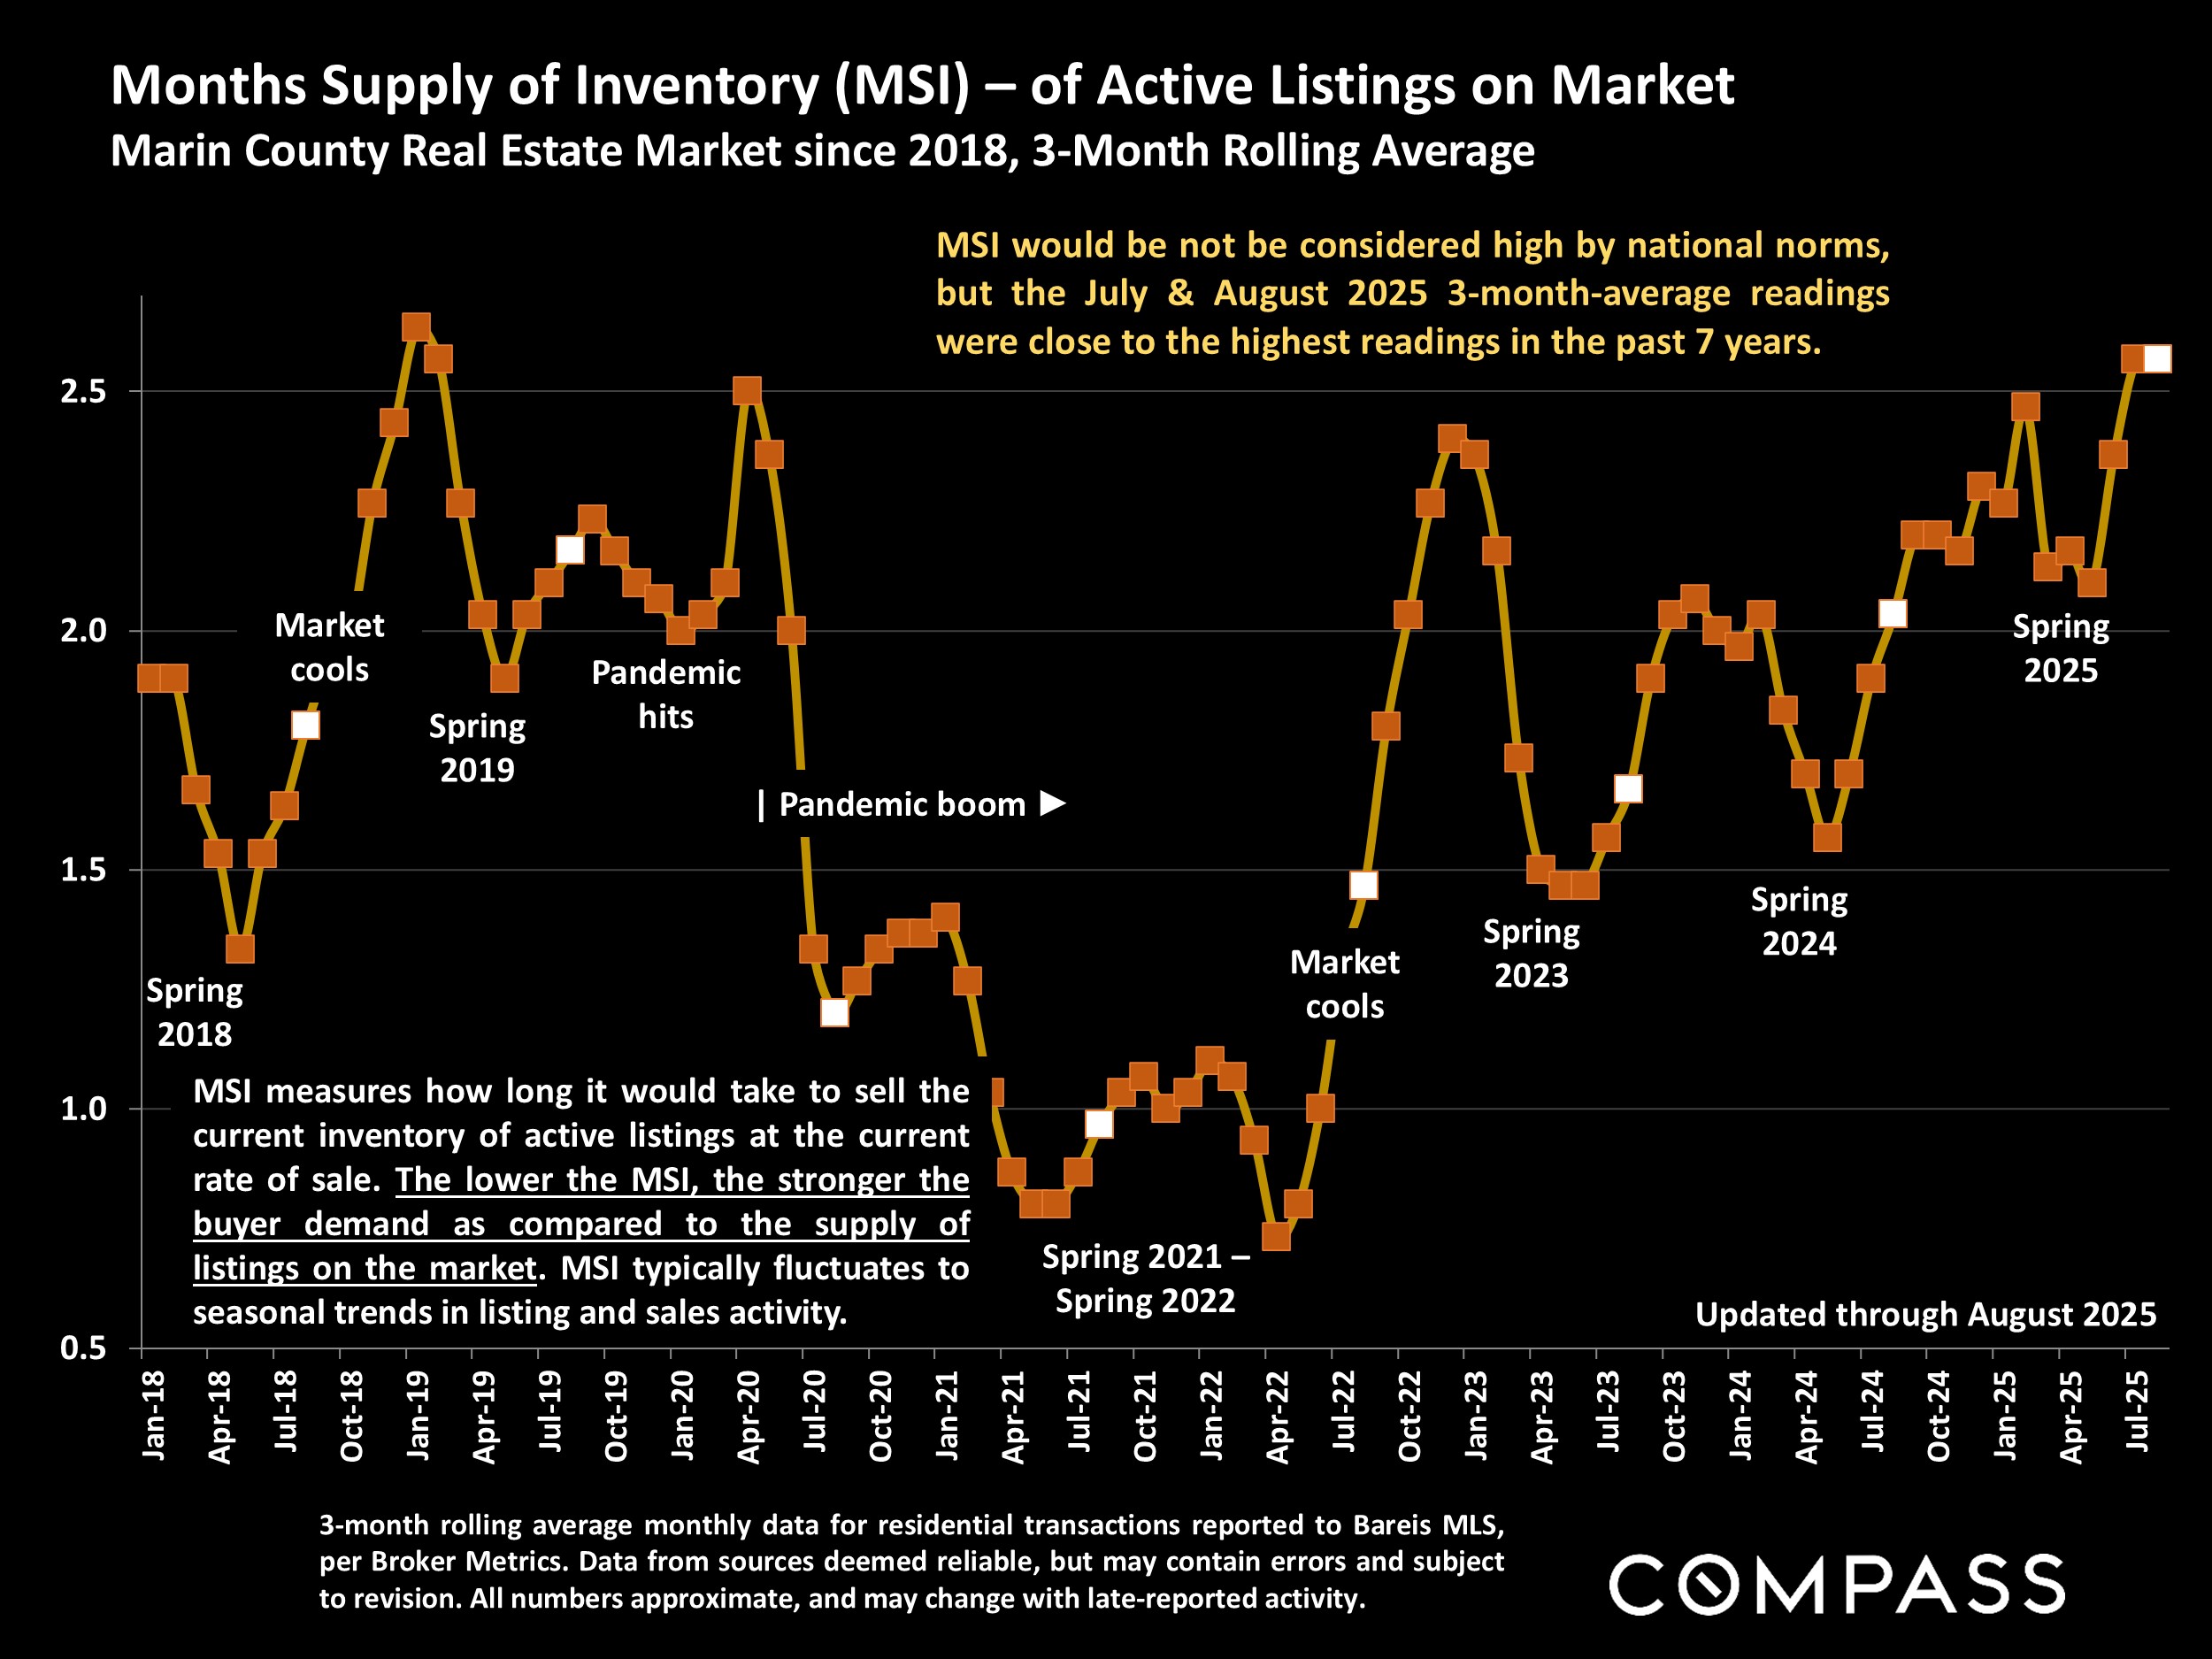
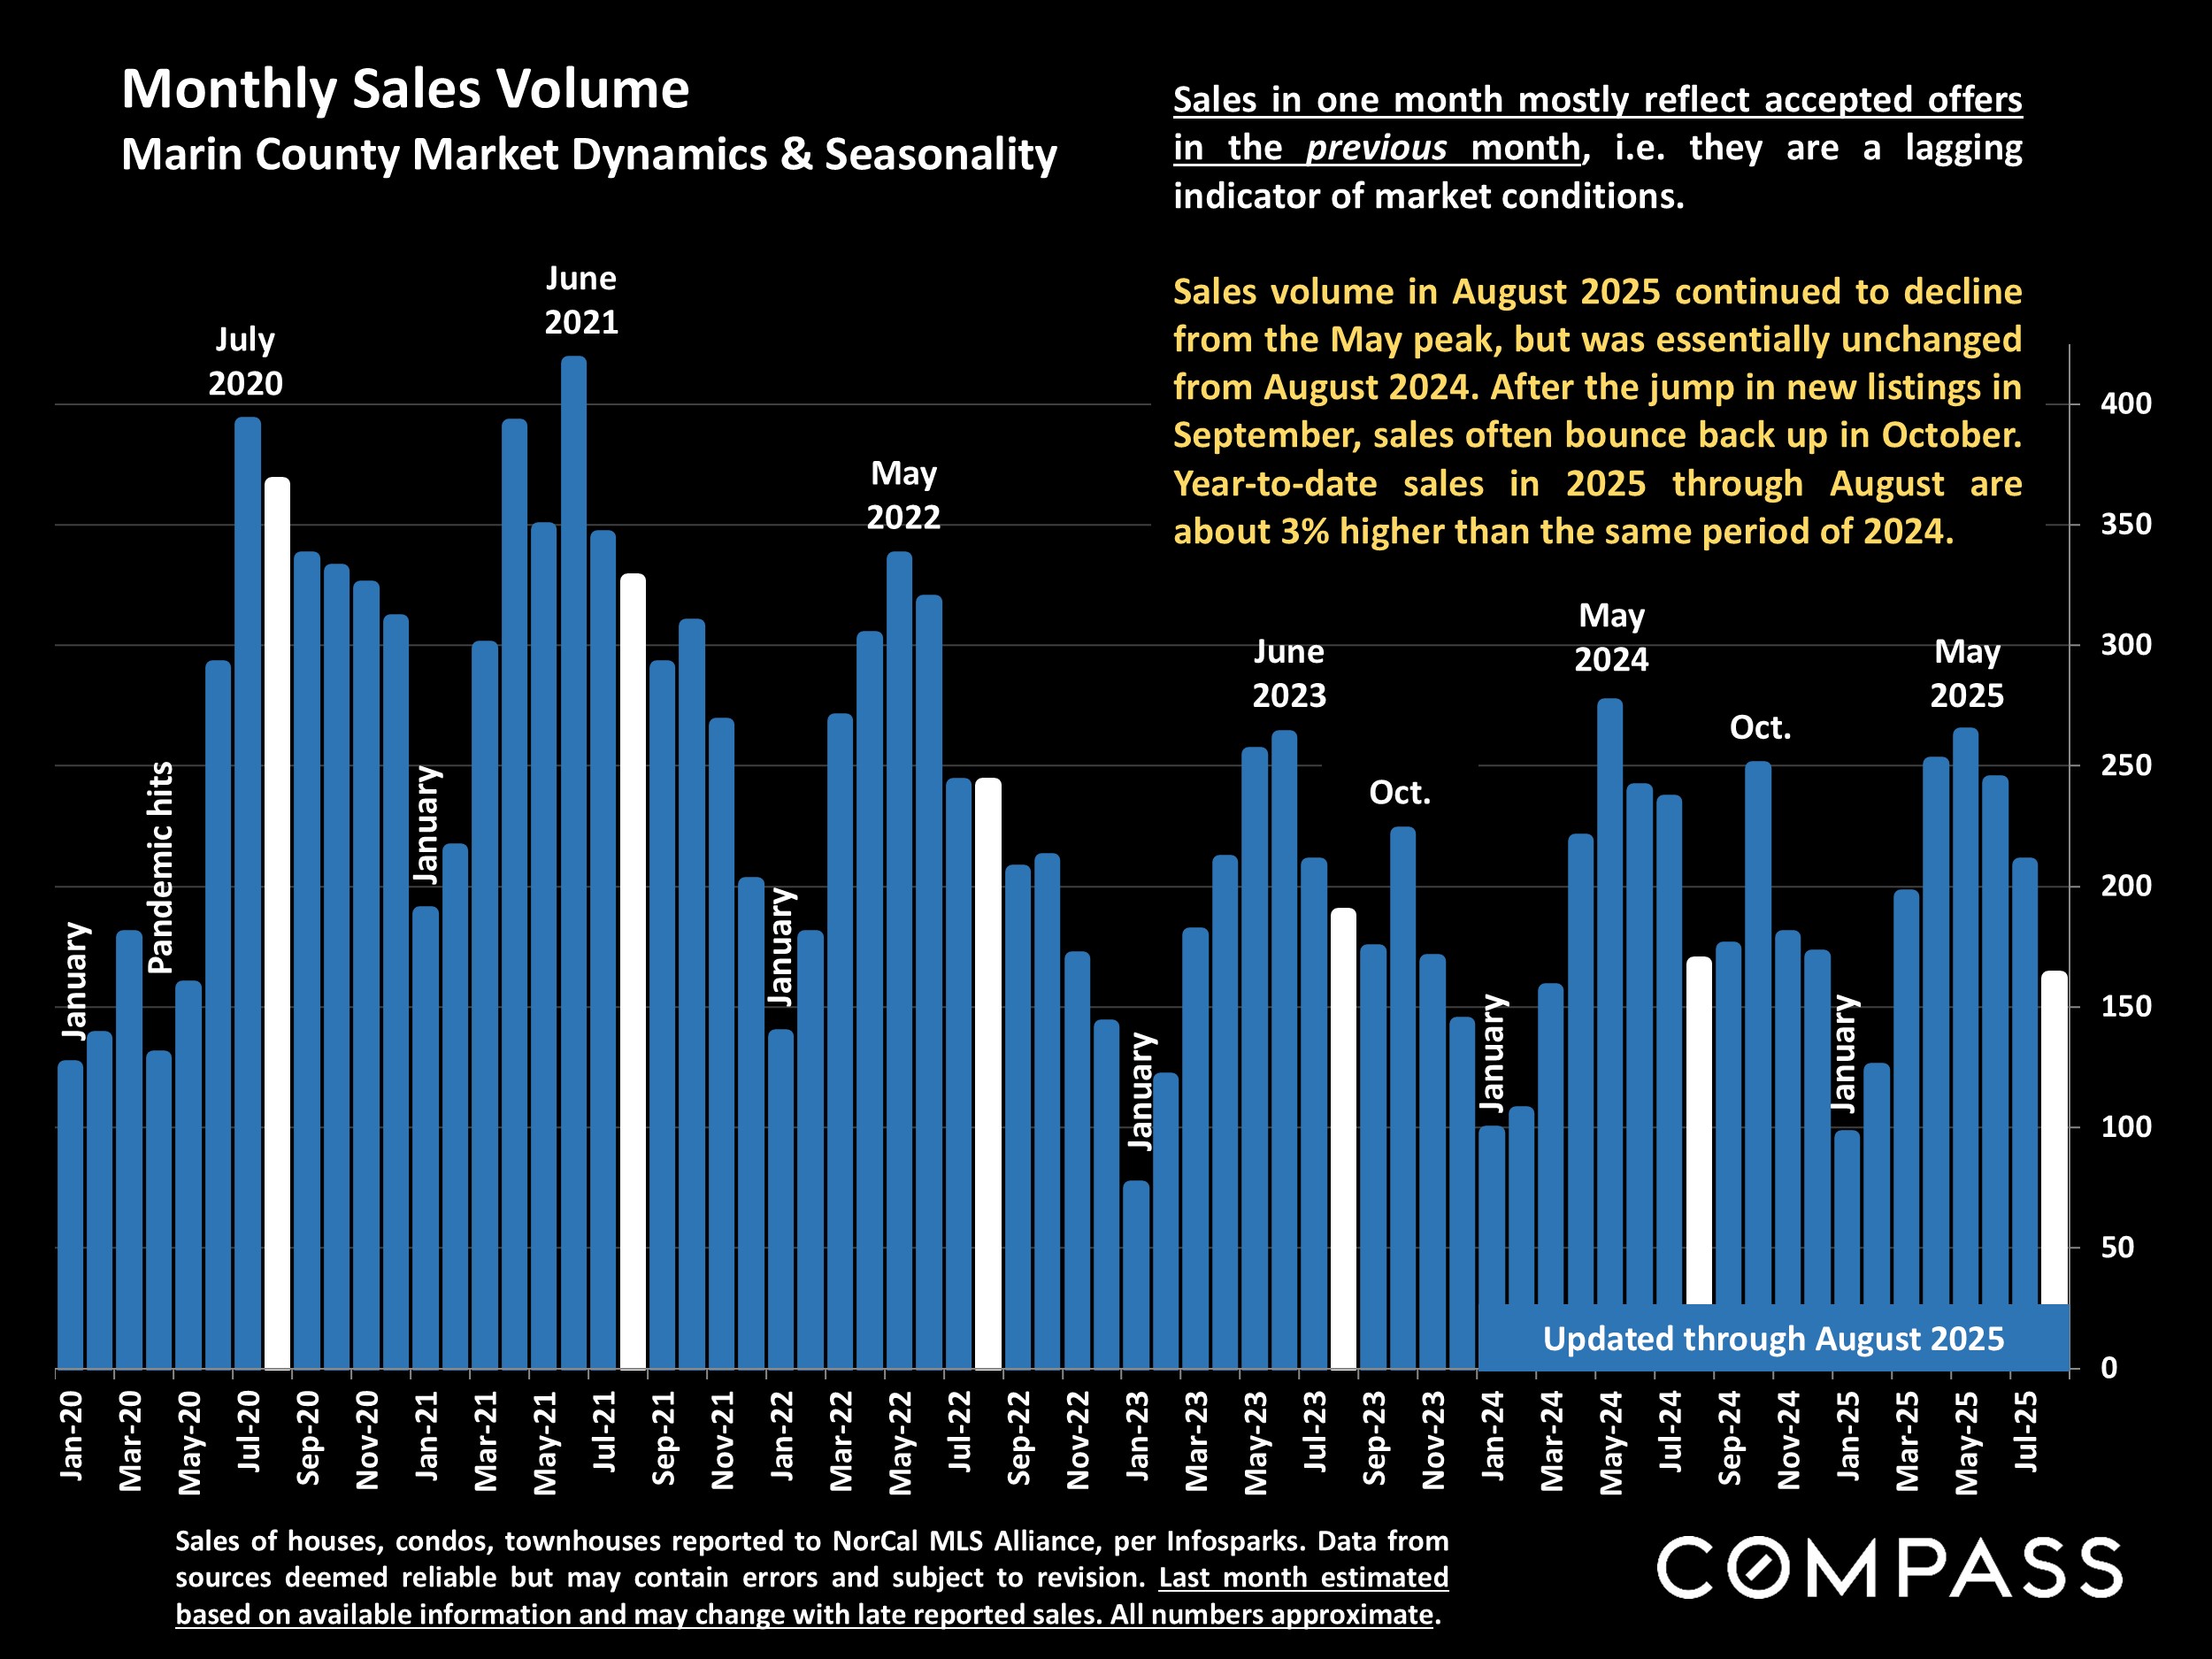
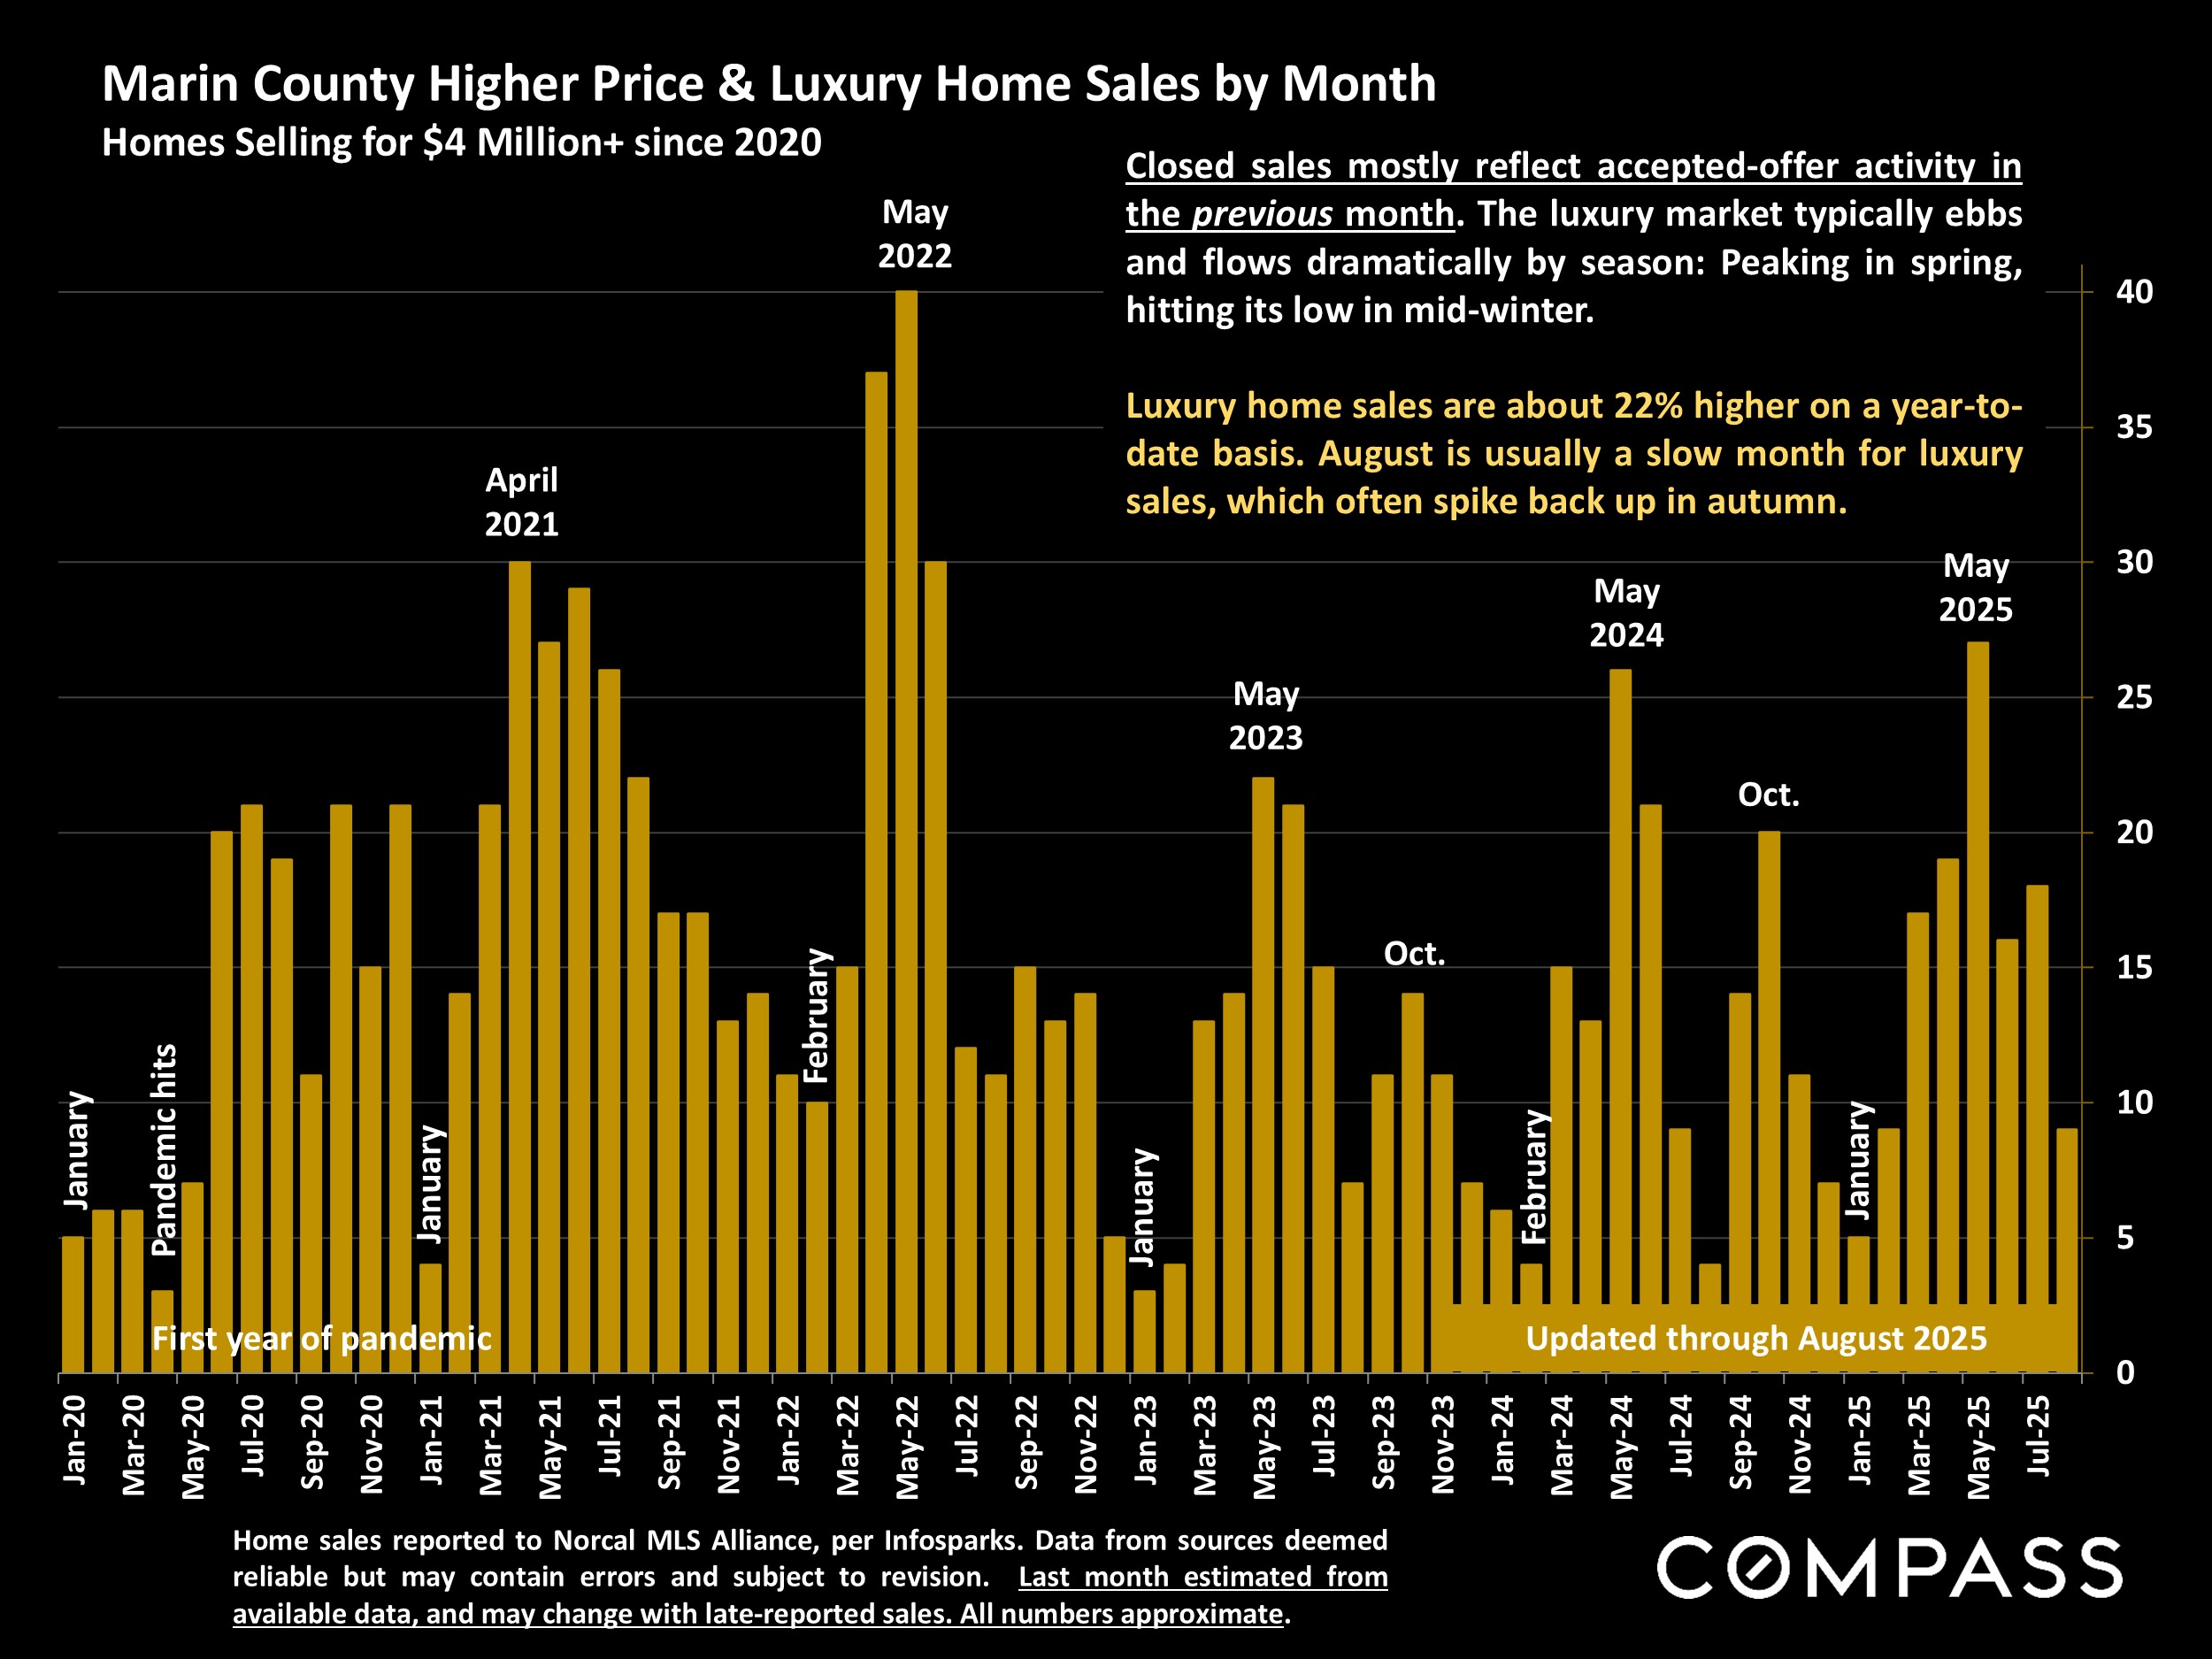
Generally speaking, this summer's market saw no large shifts in market dynamics beyond typical seasonal changes, and the focus now shifts to the fall selling season. This runs from early September to early-mid November, before listing and sales activity rapidly slows for the mid-winter holidays. Early fall typically begins with a big surge in new listings, which then provides a substantial boost to sales activity, especially in higher-price segments. Probably the biggest wild card right now is what is going to happen to interest rates, but economic indicators present a surprisingly wide range of mixed messages.
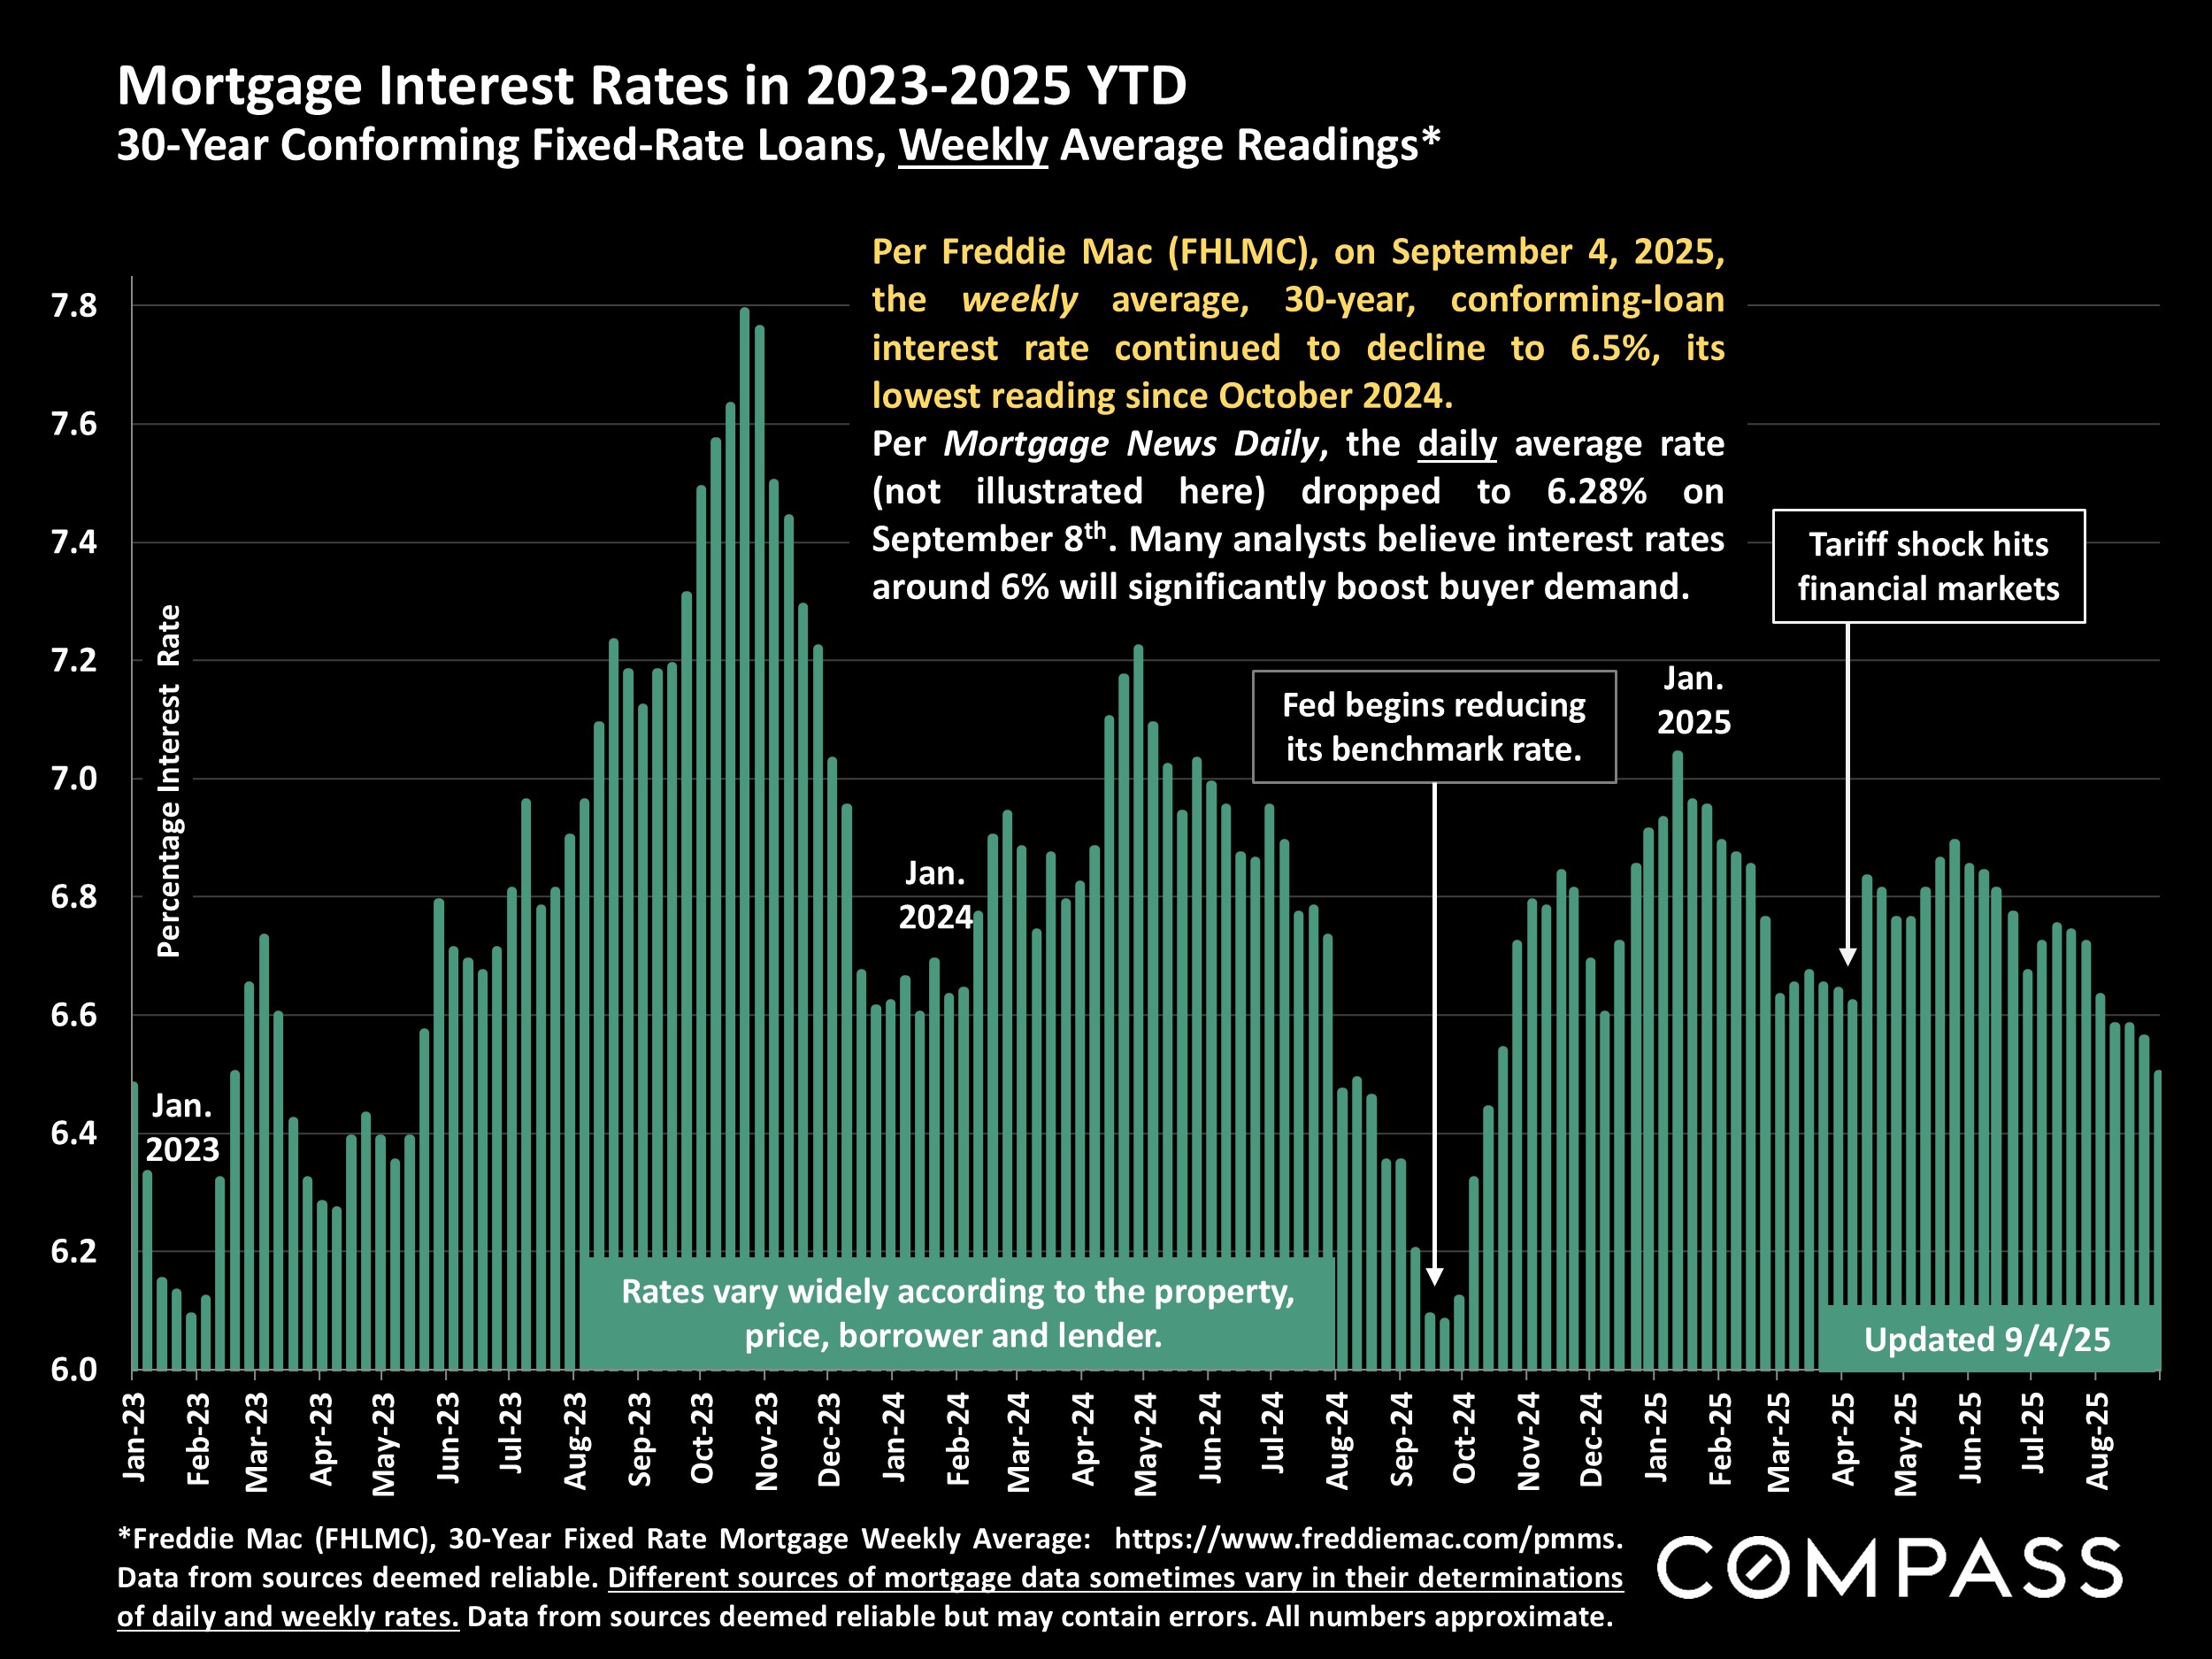
As of the first week of September, mortgage rates, at slightly below 6.3%, are suddenly getting close to the 6% range many analysts believe is required to significantly boost buyer demand.
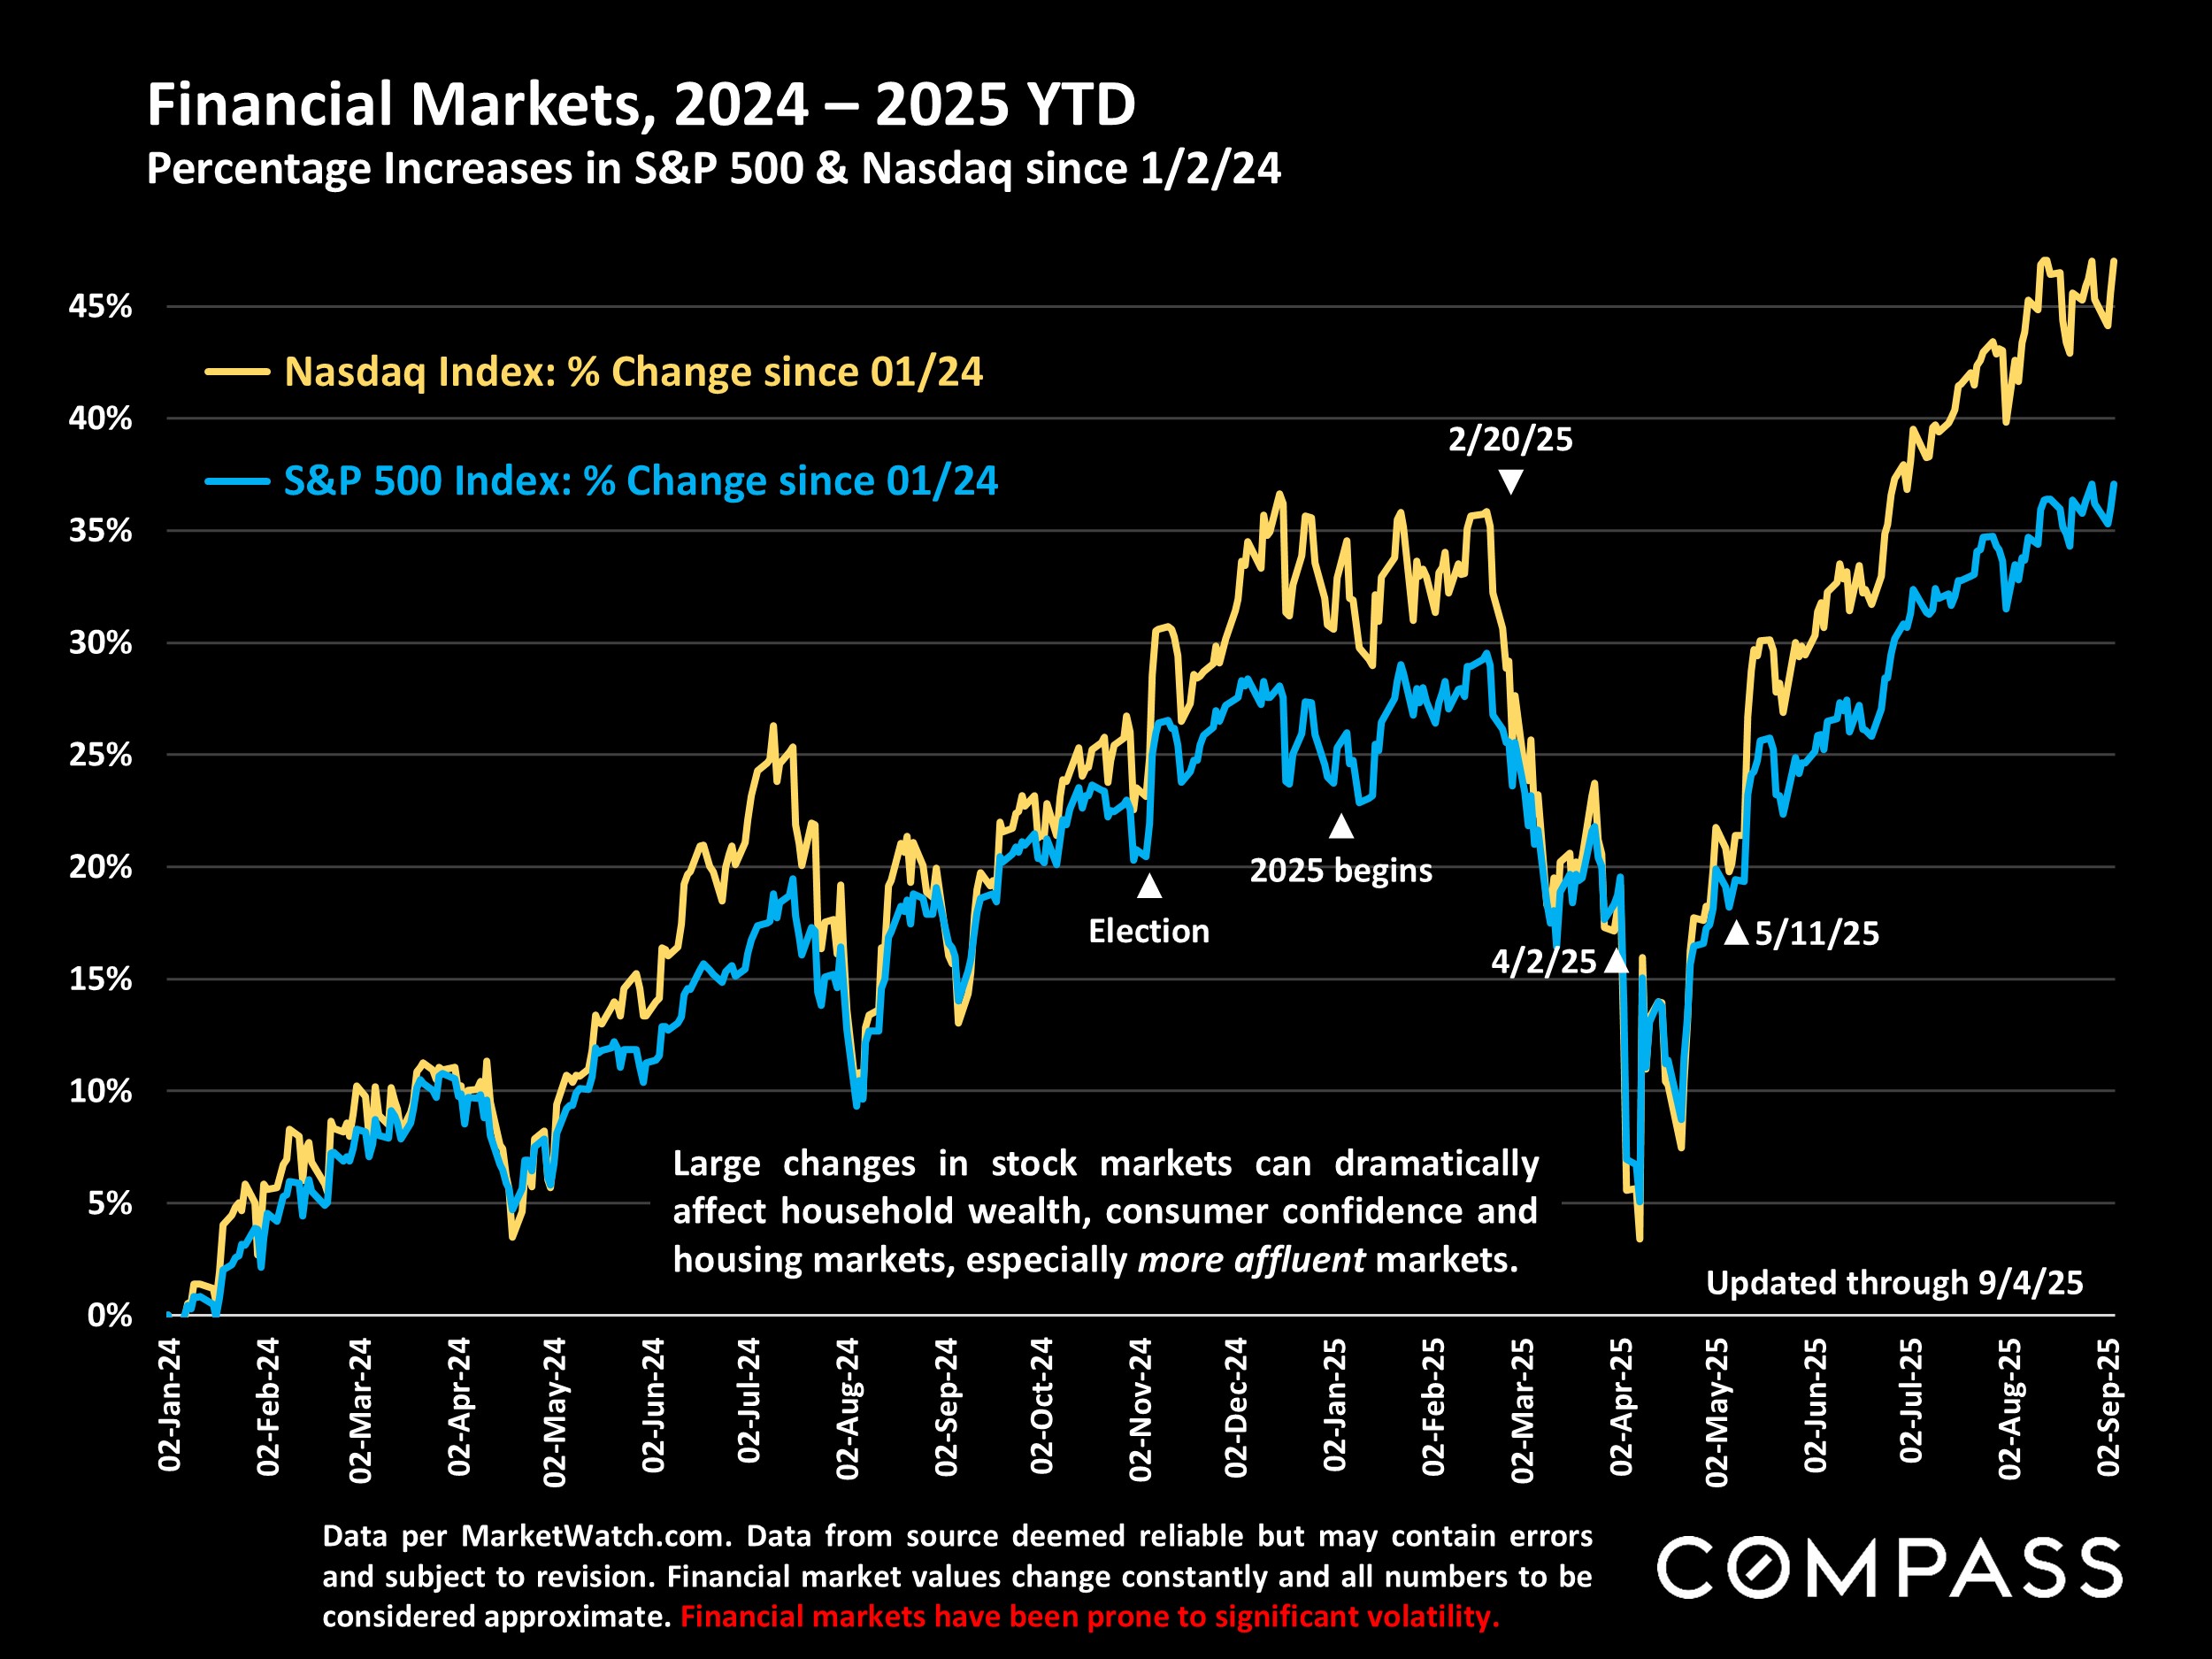
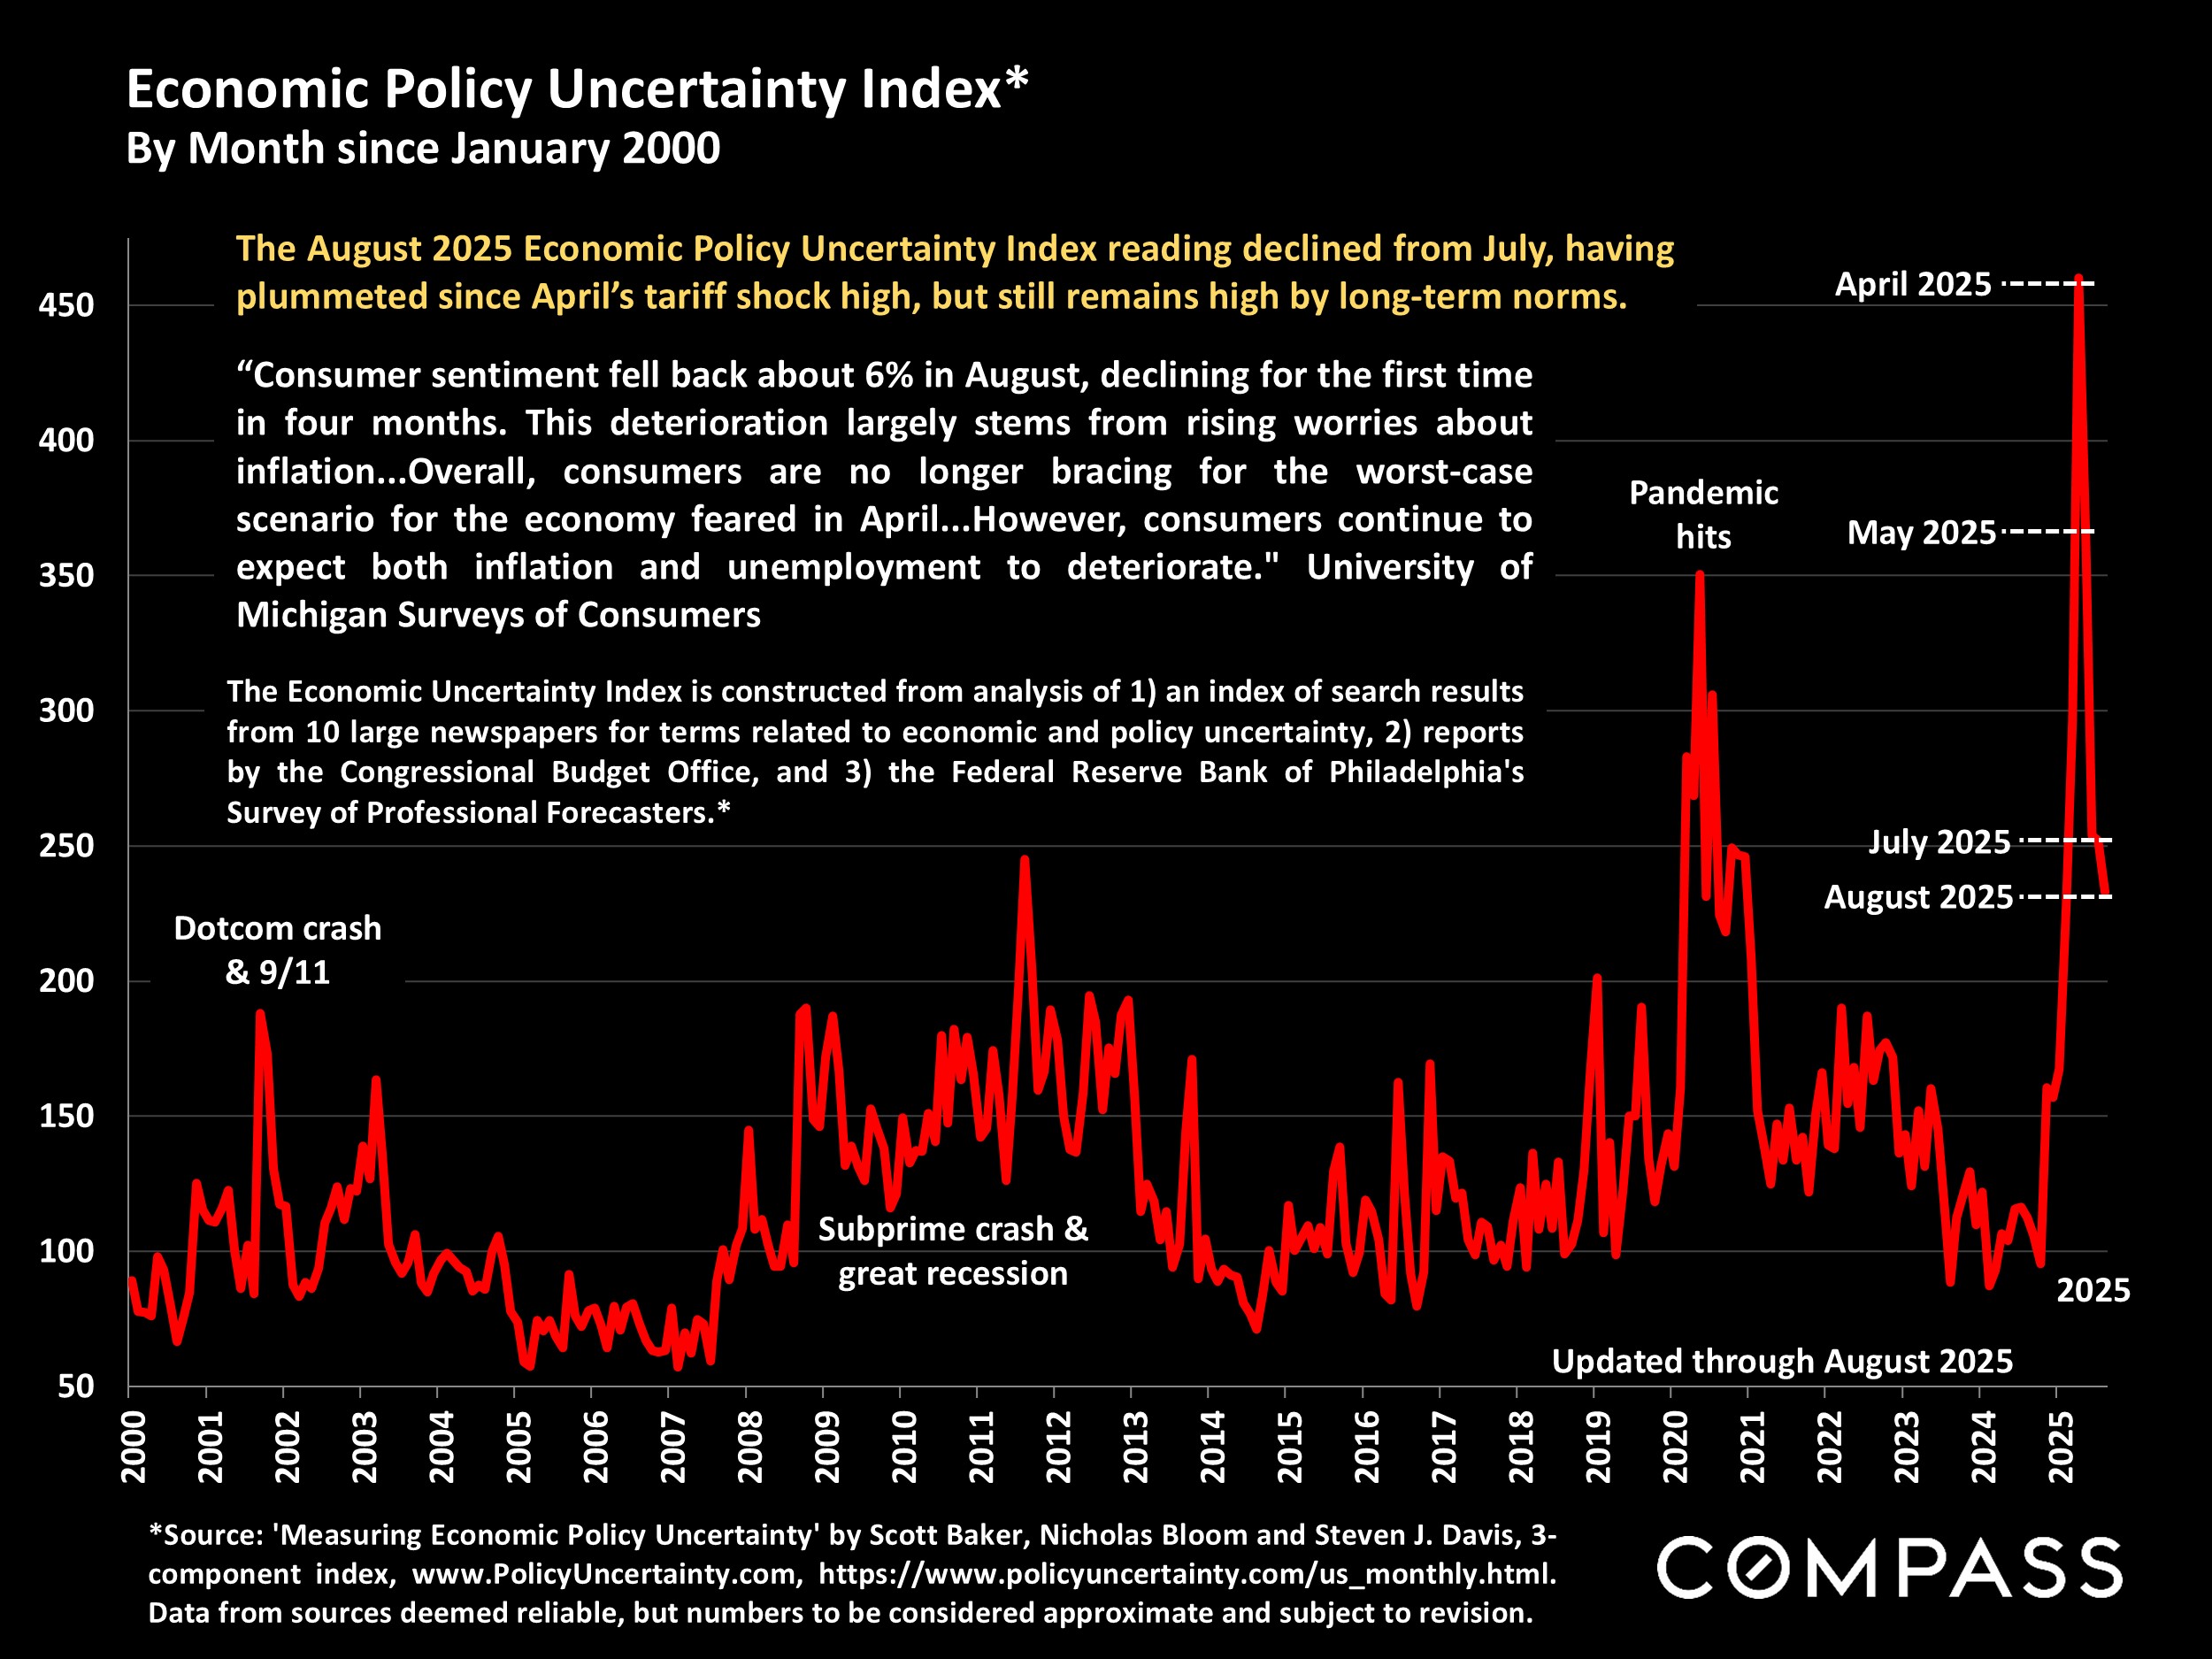
But interest rates have been extremely volatile in recent years, with big, sudden changes in direction common - as occurred last year in late summer/early autumn. Stock markets have hit new all-time highs in the past month, a major factor in very affluent real estate markets like Marin. The last inflation reading was unchanged at 2.7%, but the more recent Producer Price Index saw its largest monthly increase in over 3 years. Consumer confidence readings remain low; measures of economic uncertainty and political volatility - both national and international - remain high; and the latest jobs report was generally considered relatively dismal. Consensus opinion is predicting the Fed will drop its benchmark rate this month - for the first time in 2025 - but much depends on inflation reports due in coming weeks.
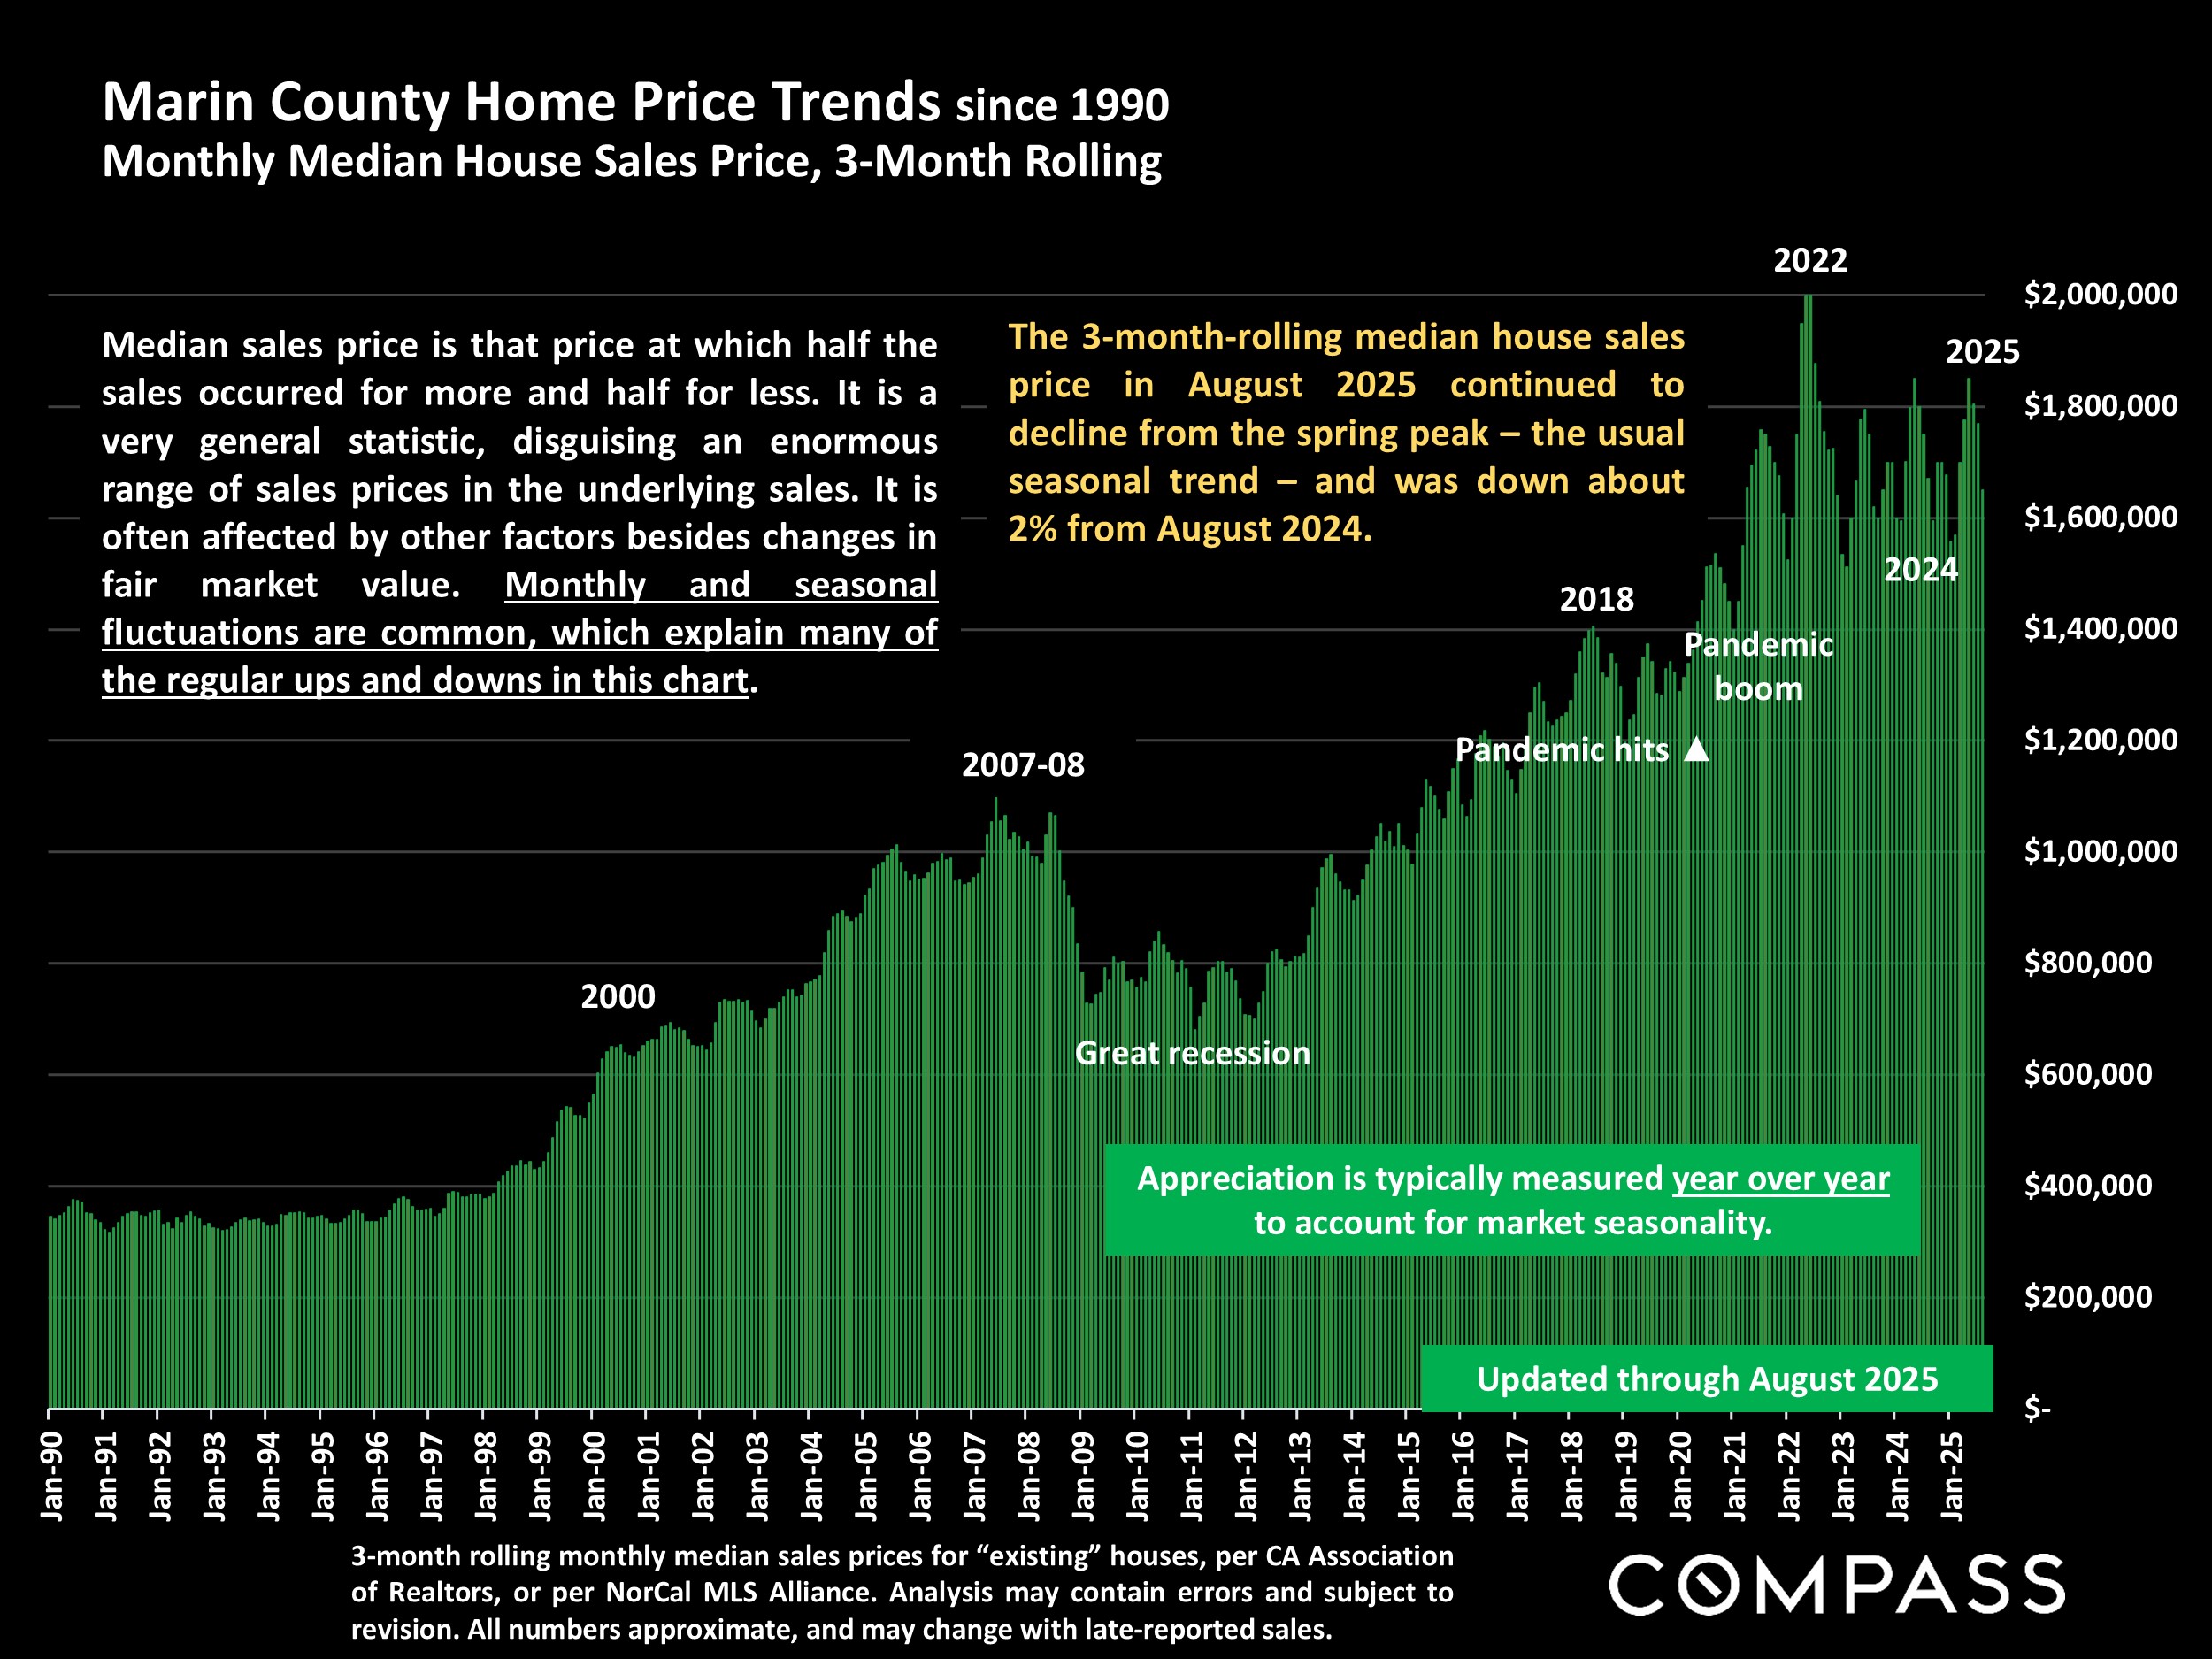
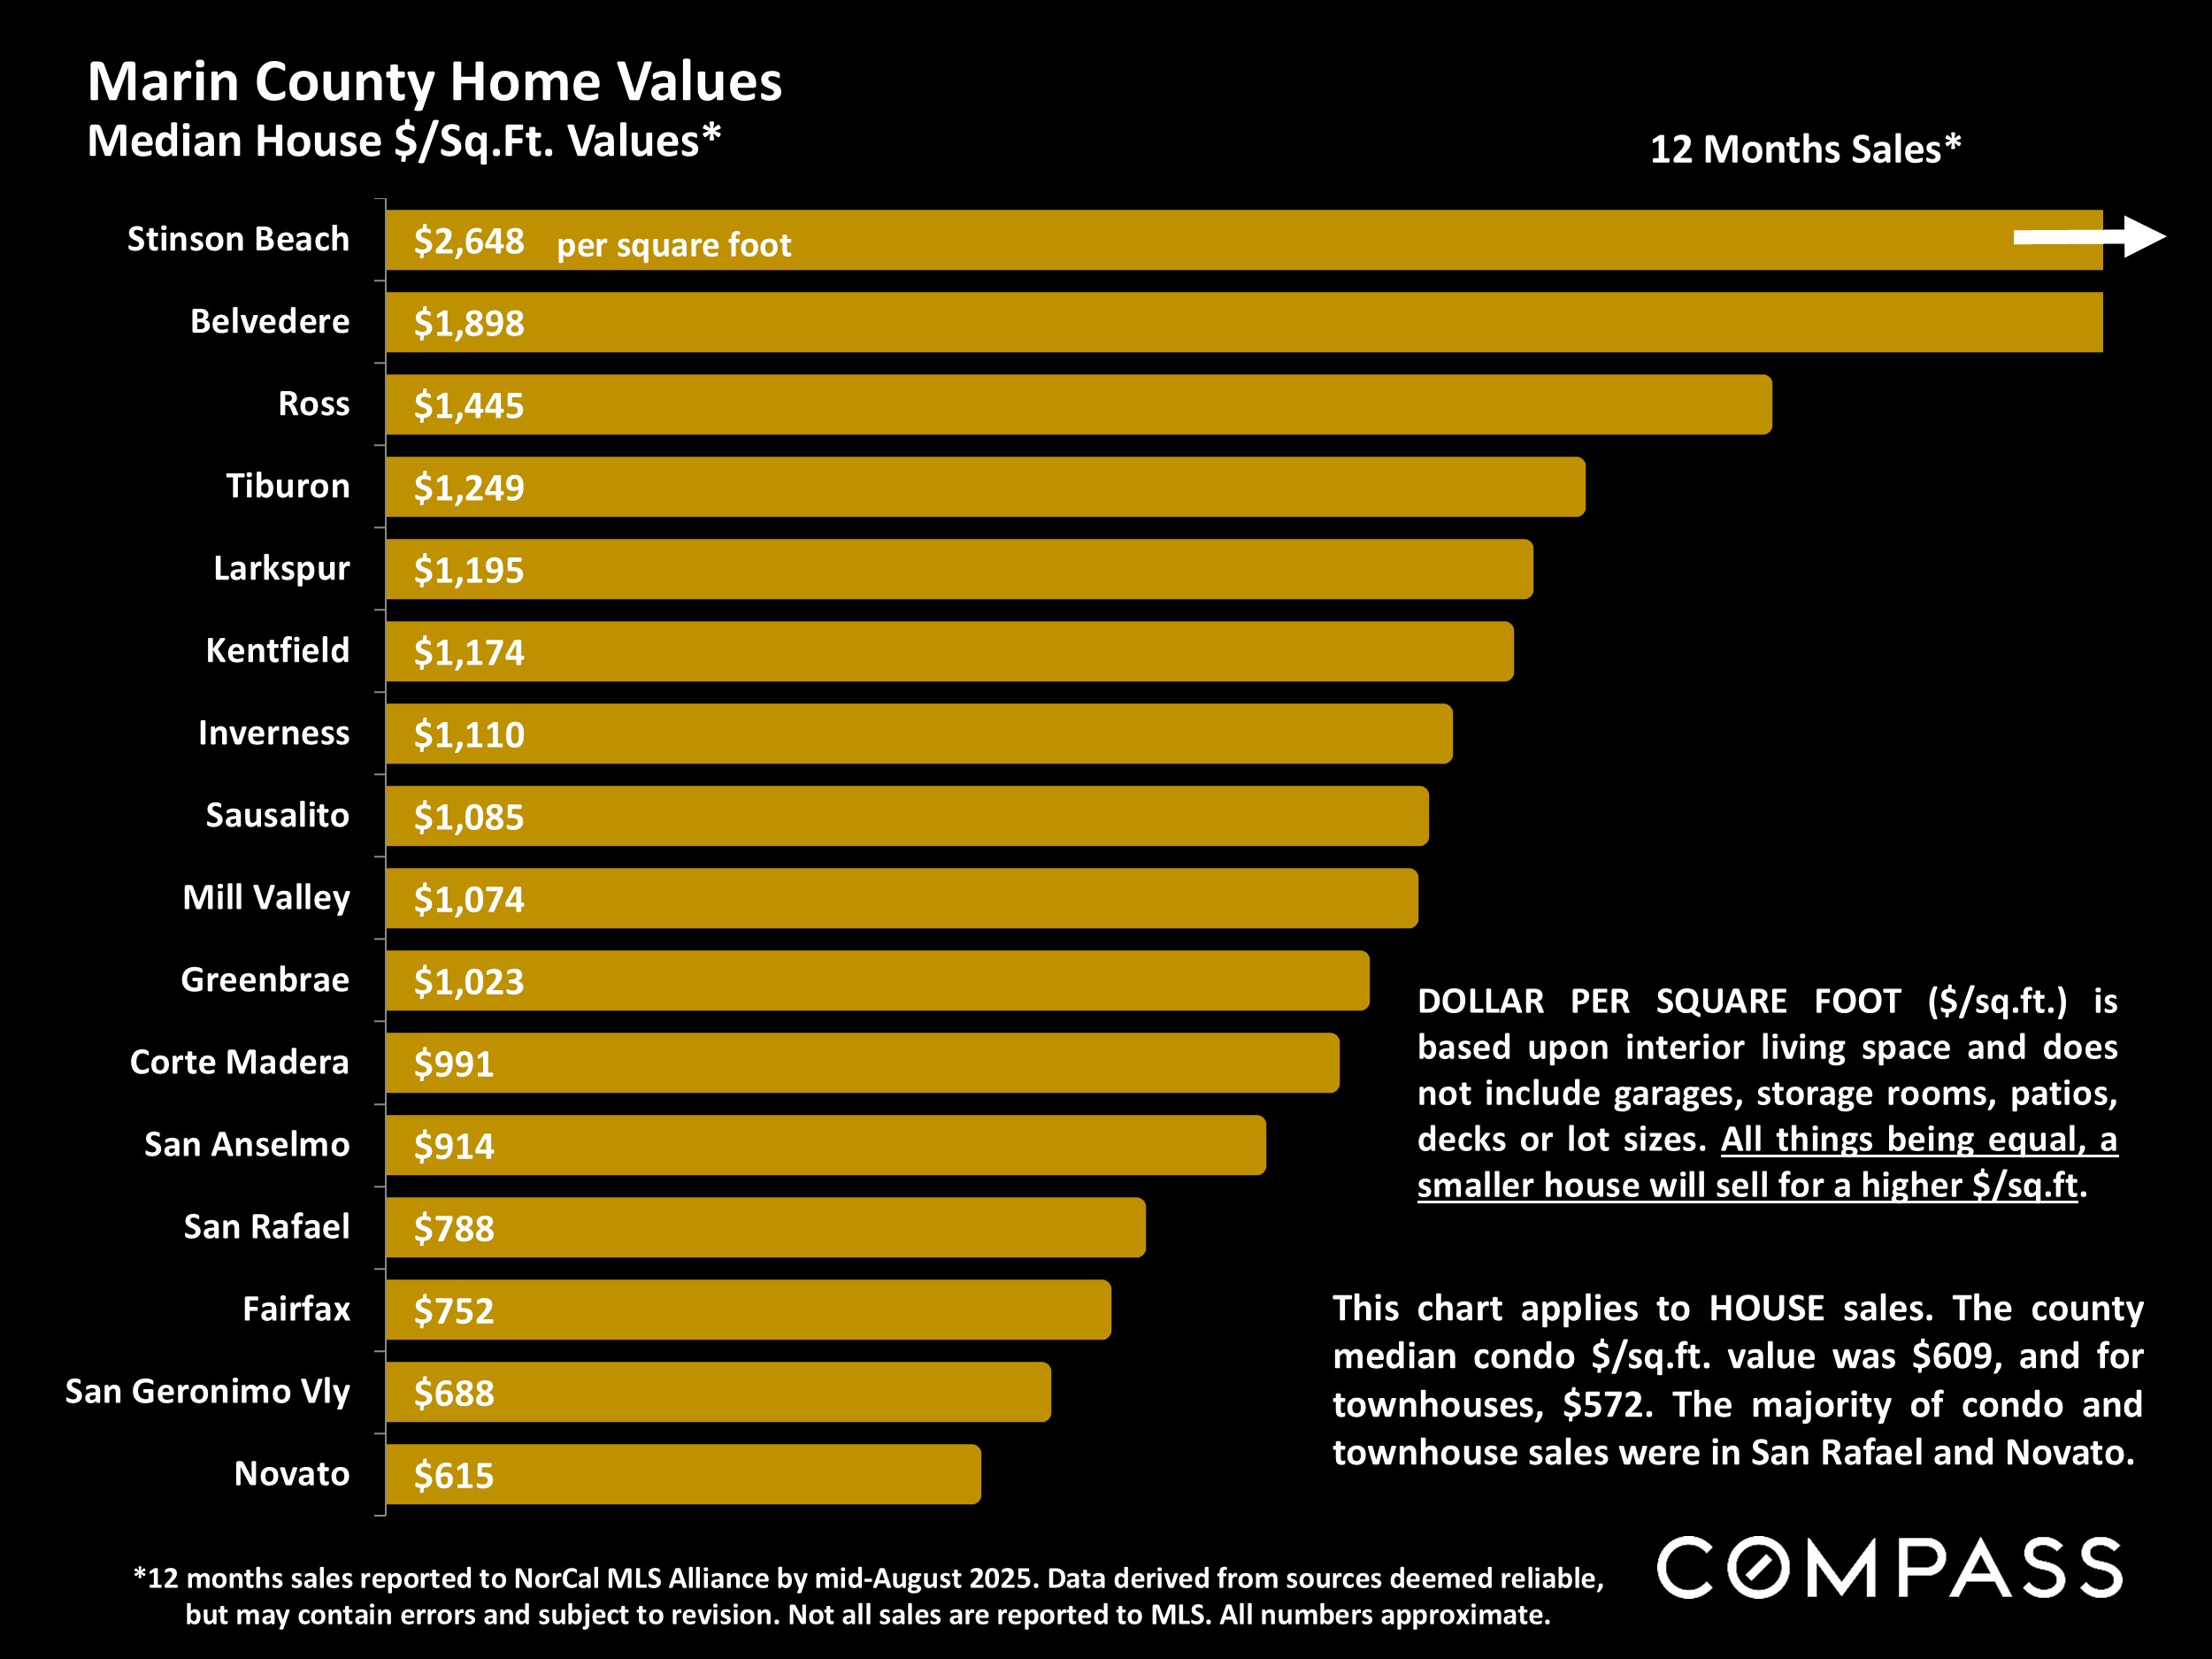
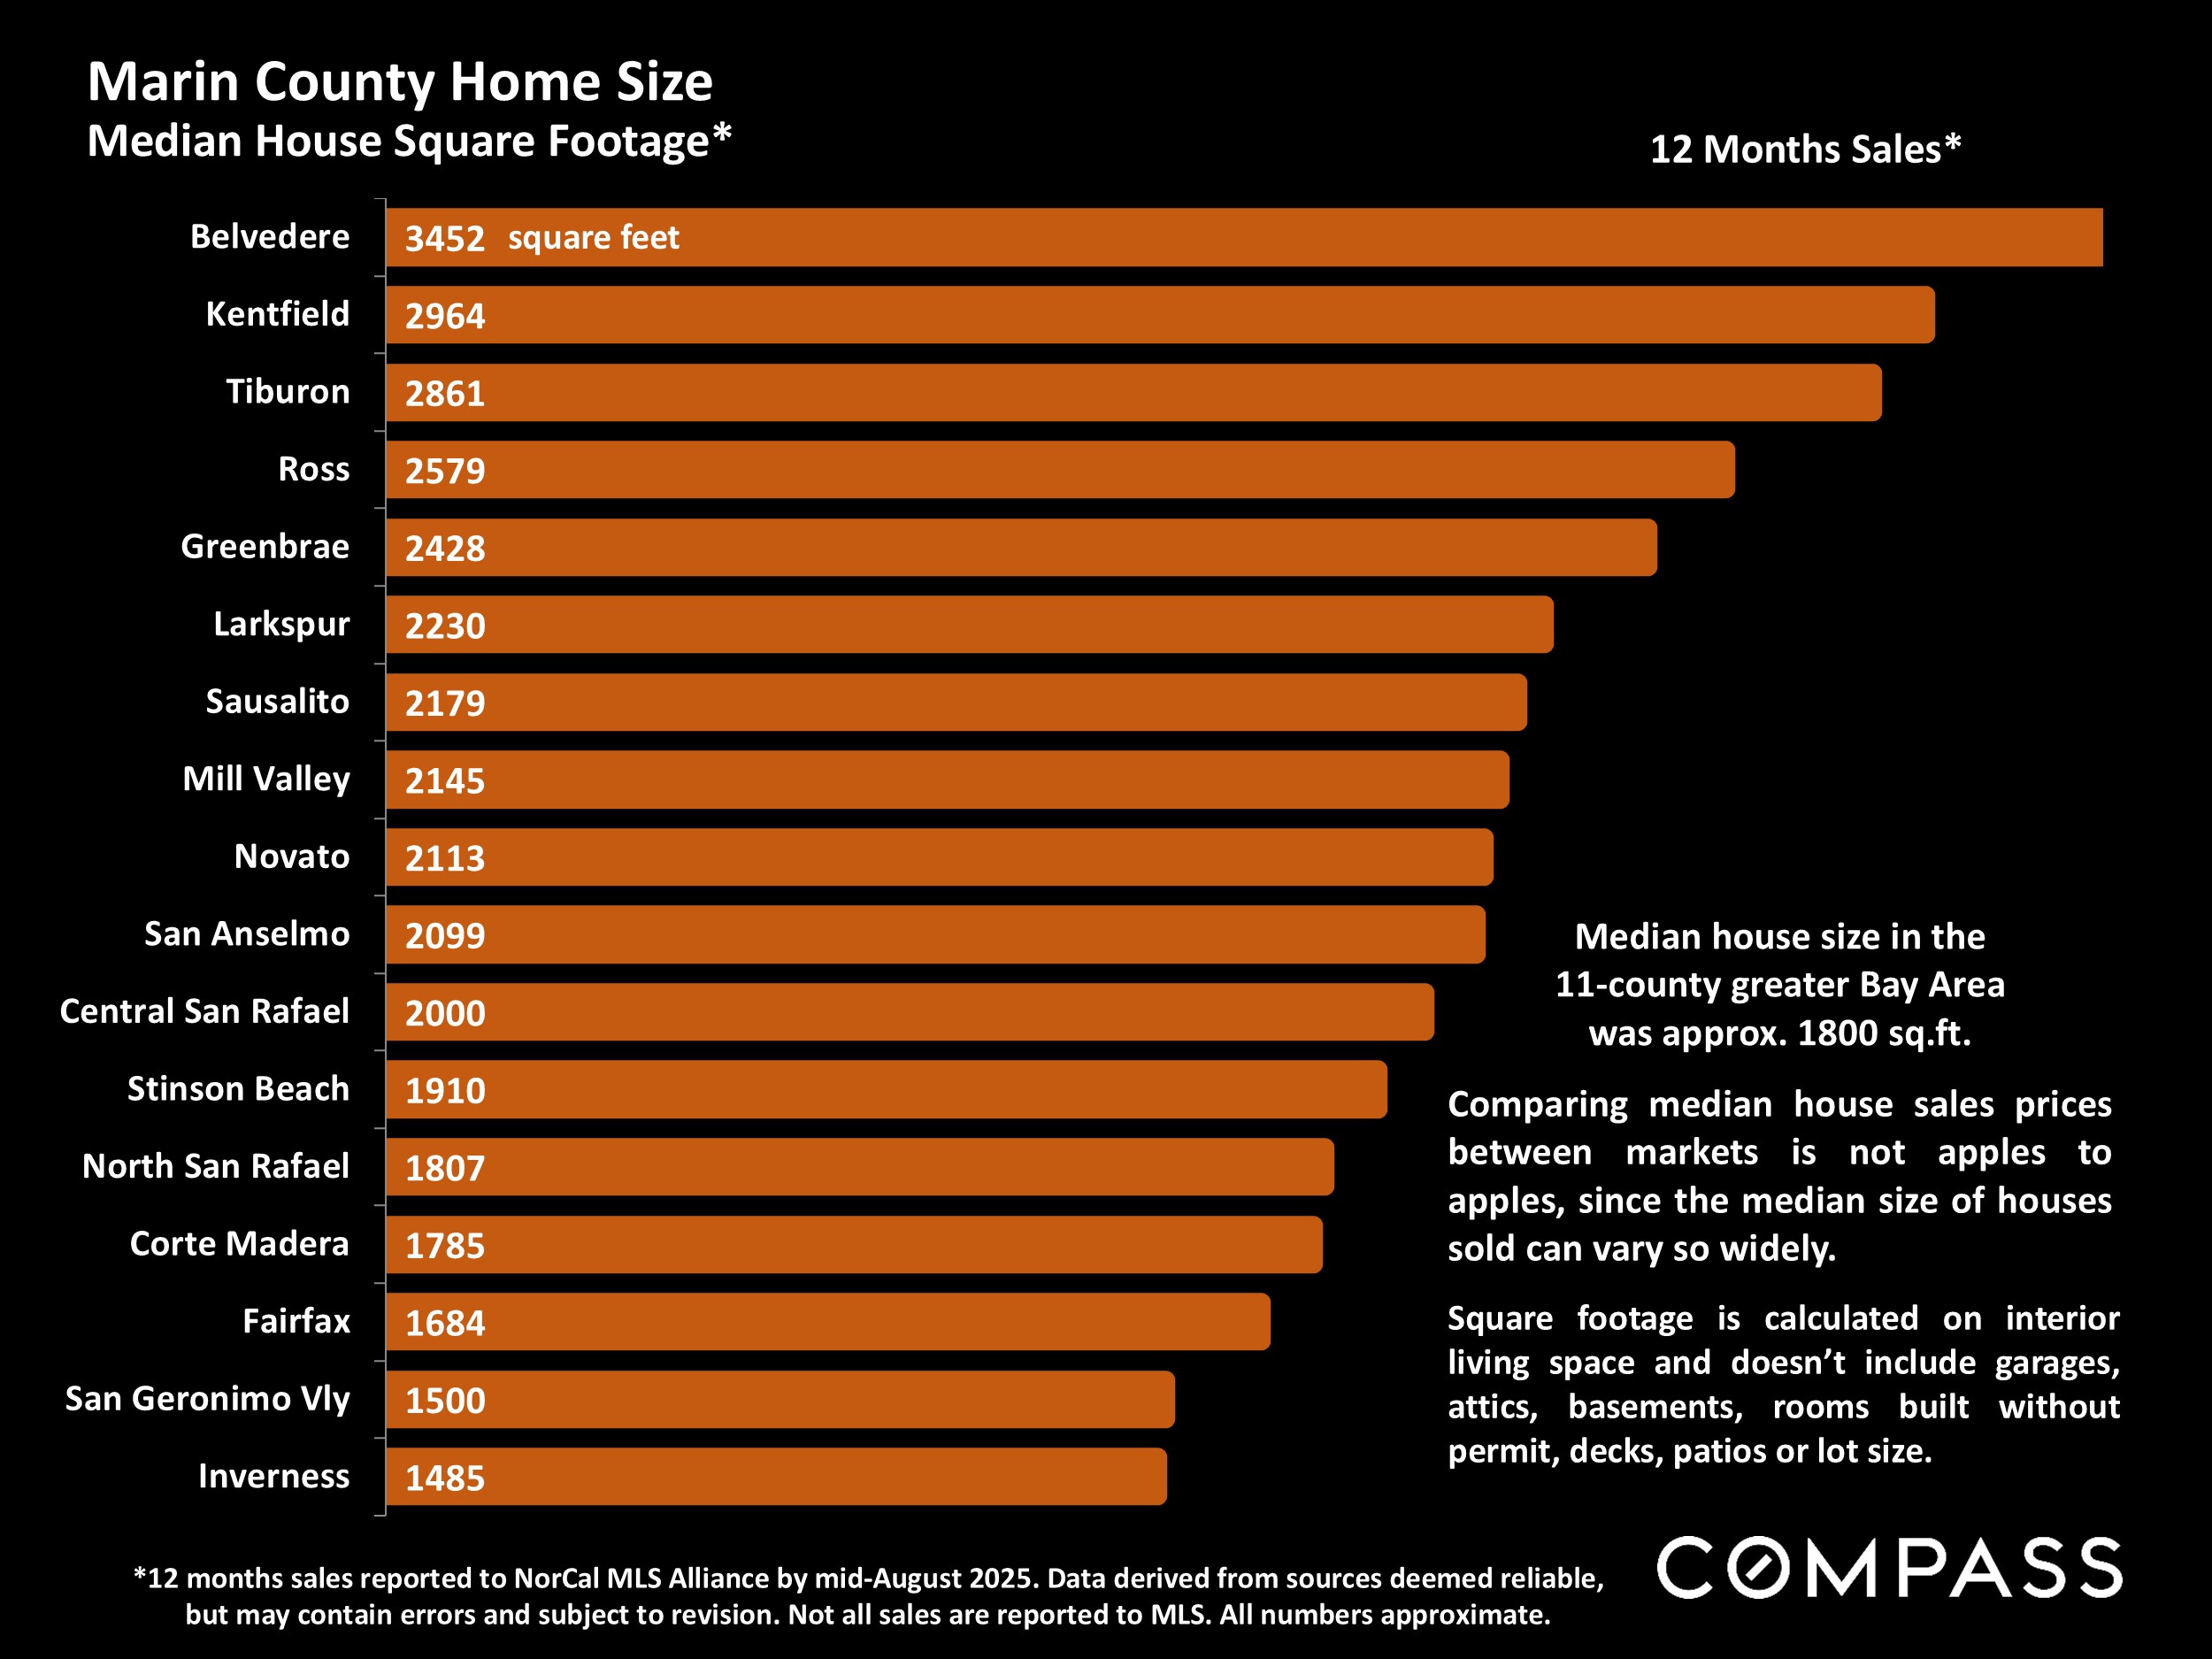
Besides the usual review of standard measurements of supply and demand, this report also contains detailed information regarding the county's cities and towns.
Want to learn more about Bay Area market trends?
Let’s connect! With relationships and networks across the city, there are a variety of ways I can help you make informed real estate decisions. Call, email, or text – I’m here to help.
Contact