June 15, 2022
SF: June 2022 Market Stats
By Compass
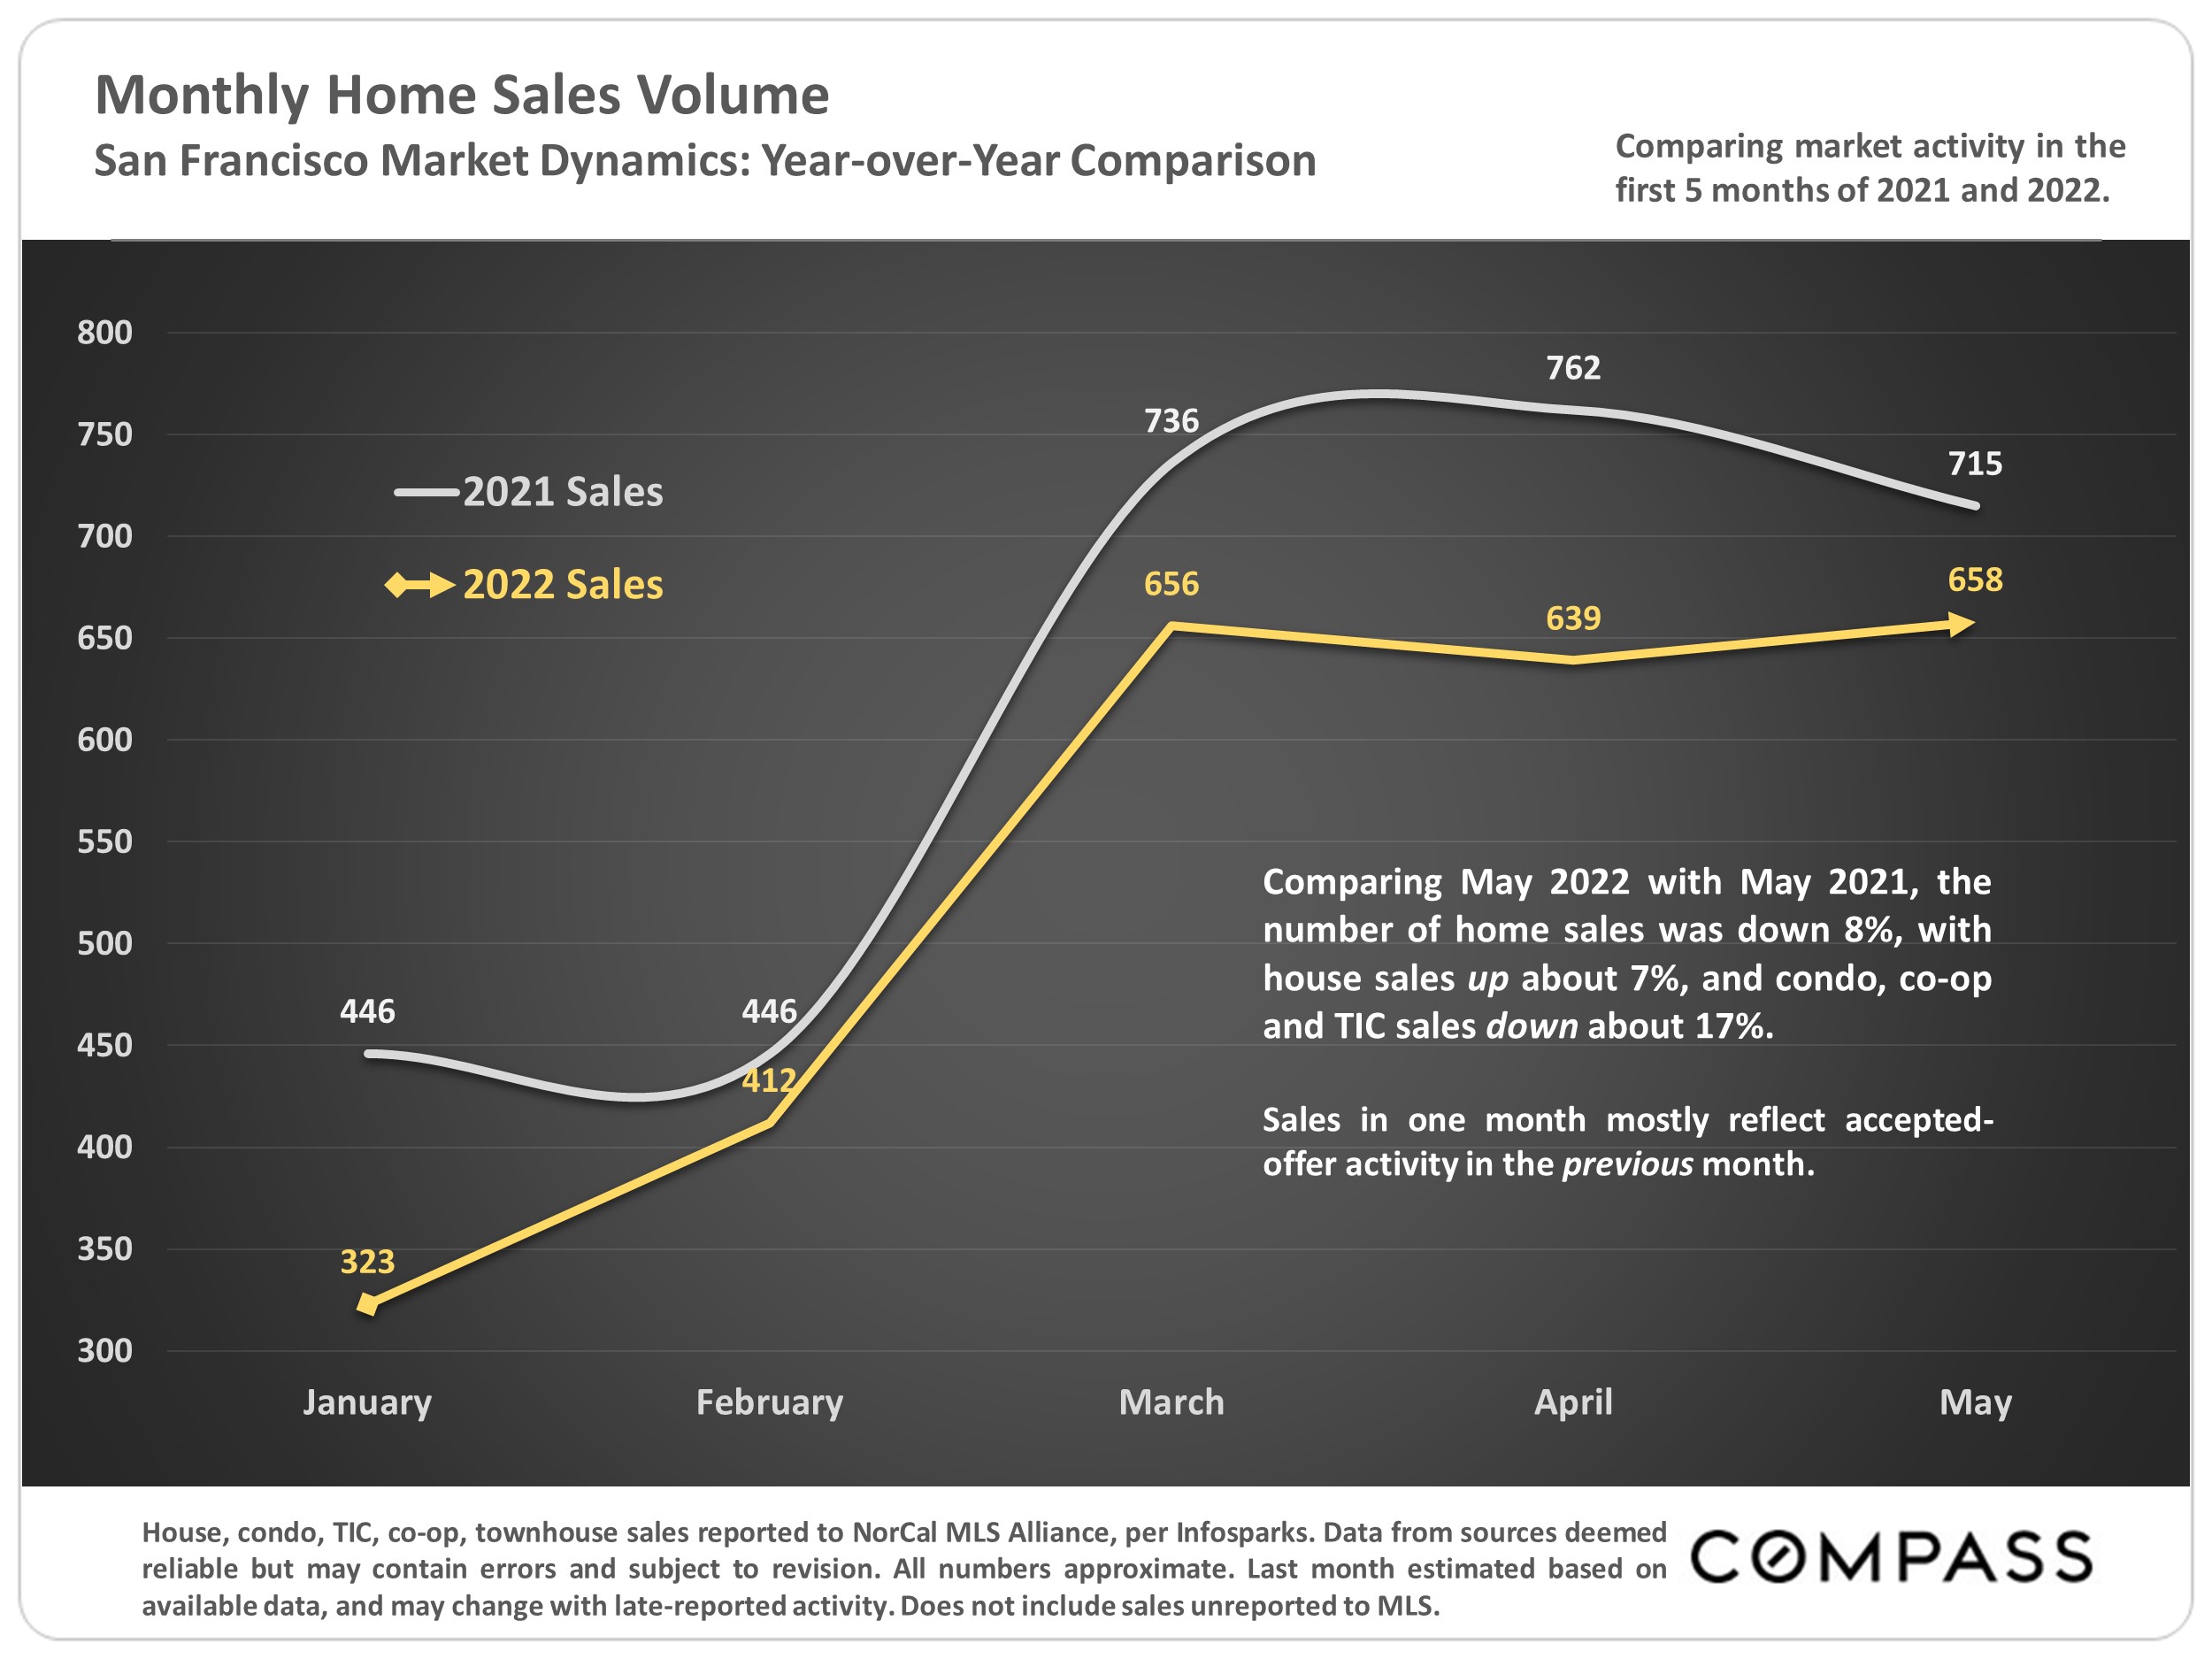
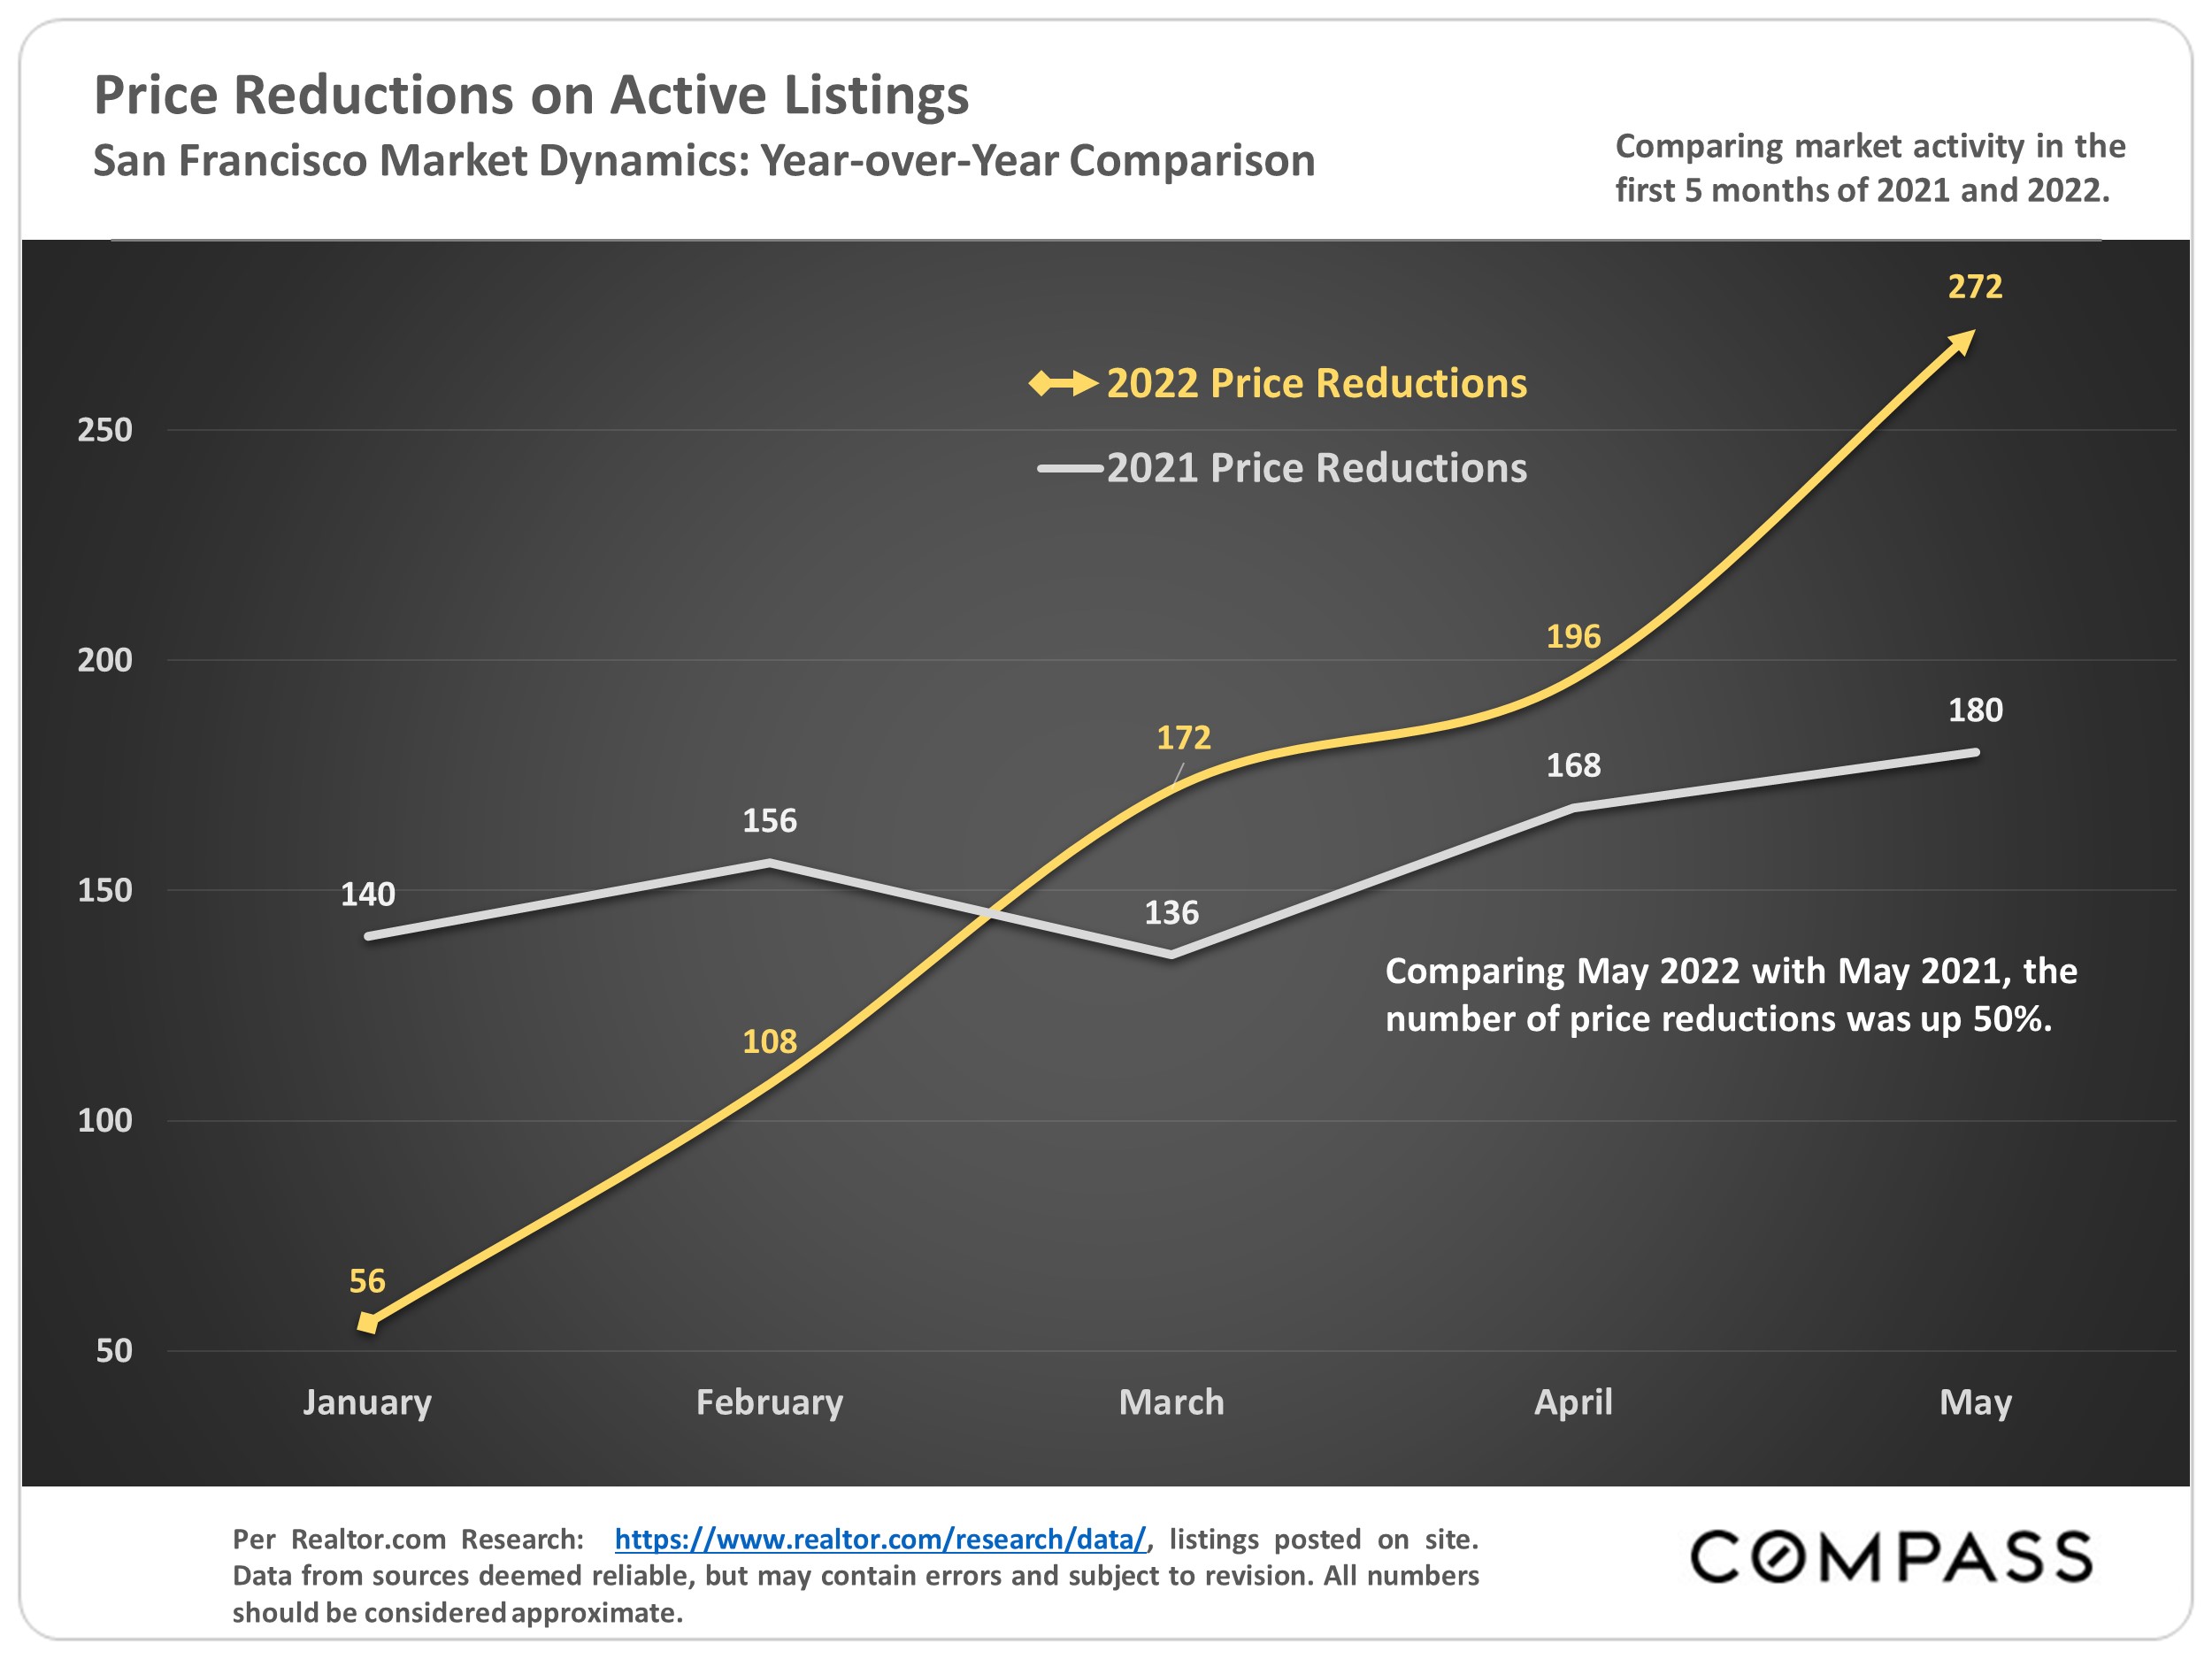
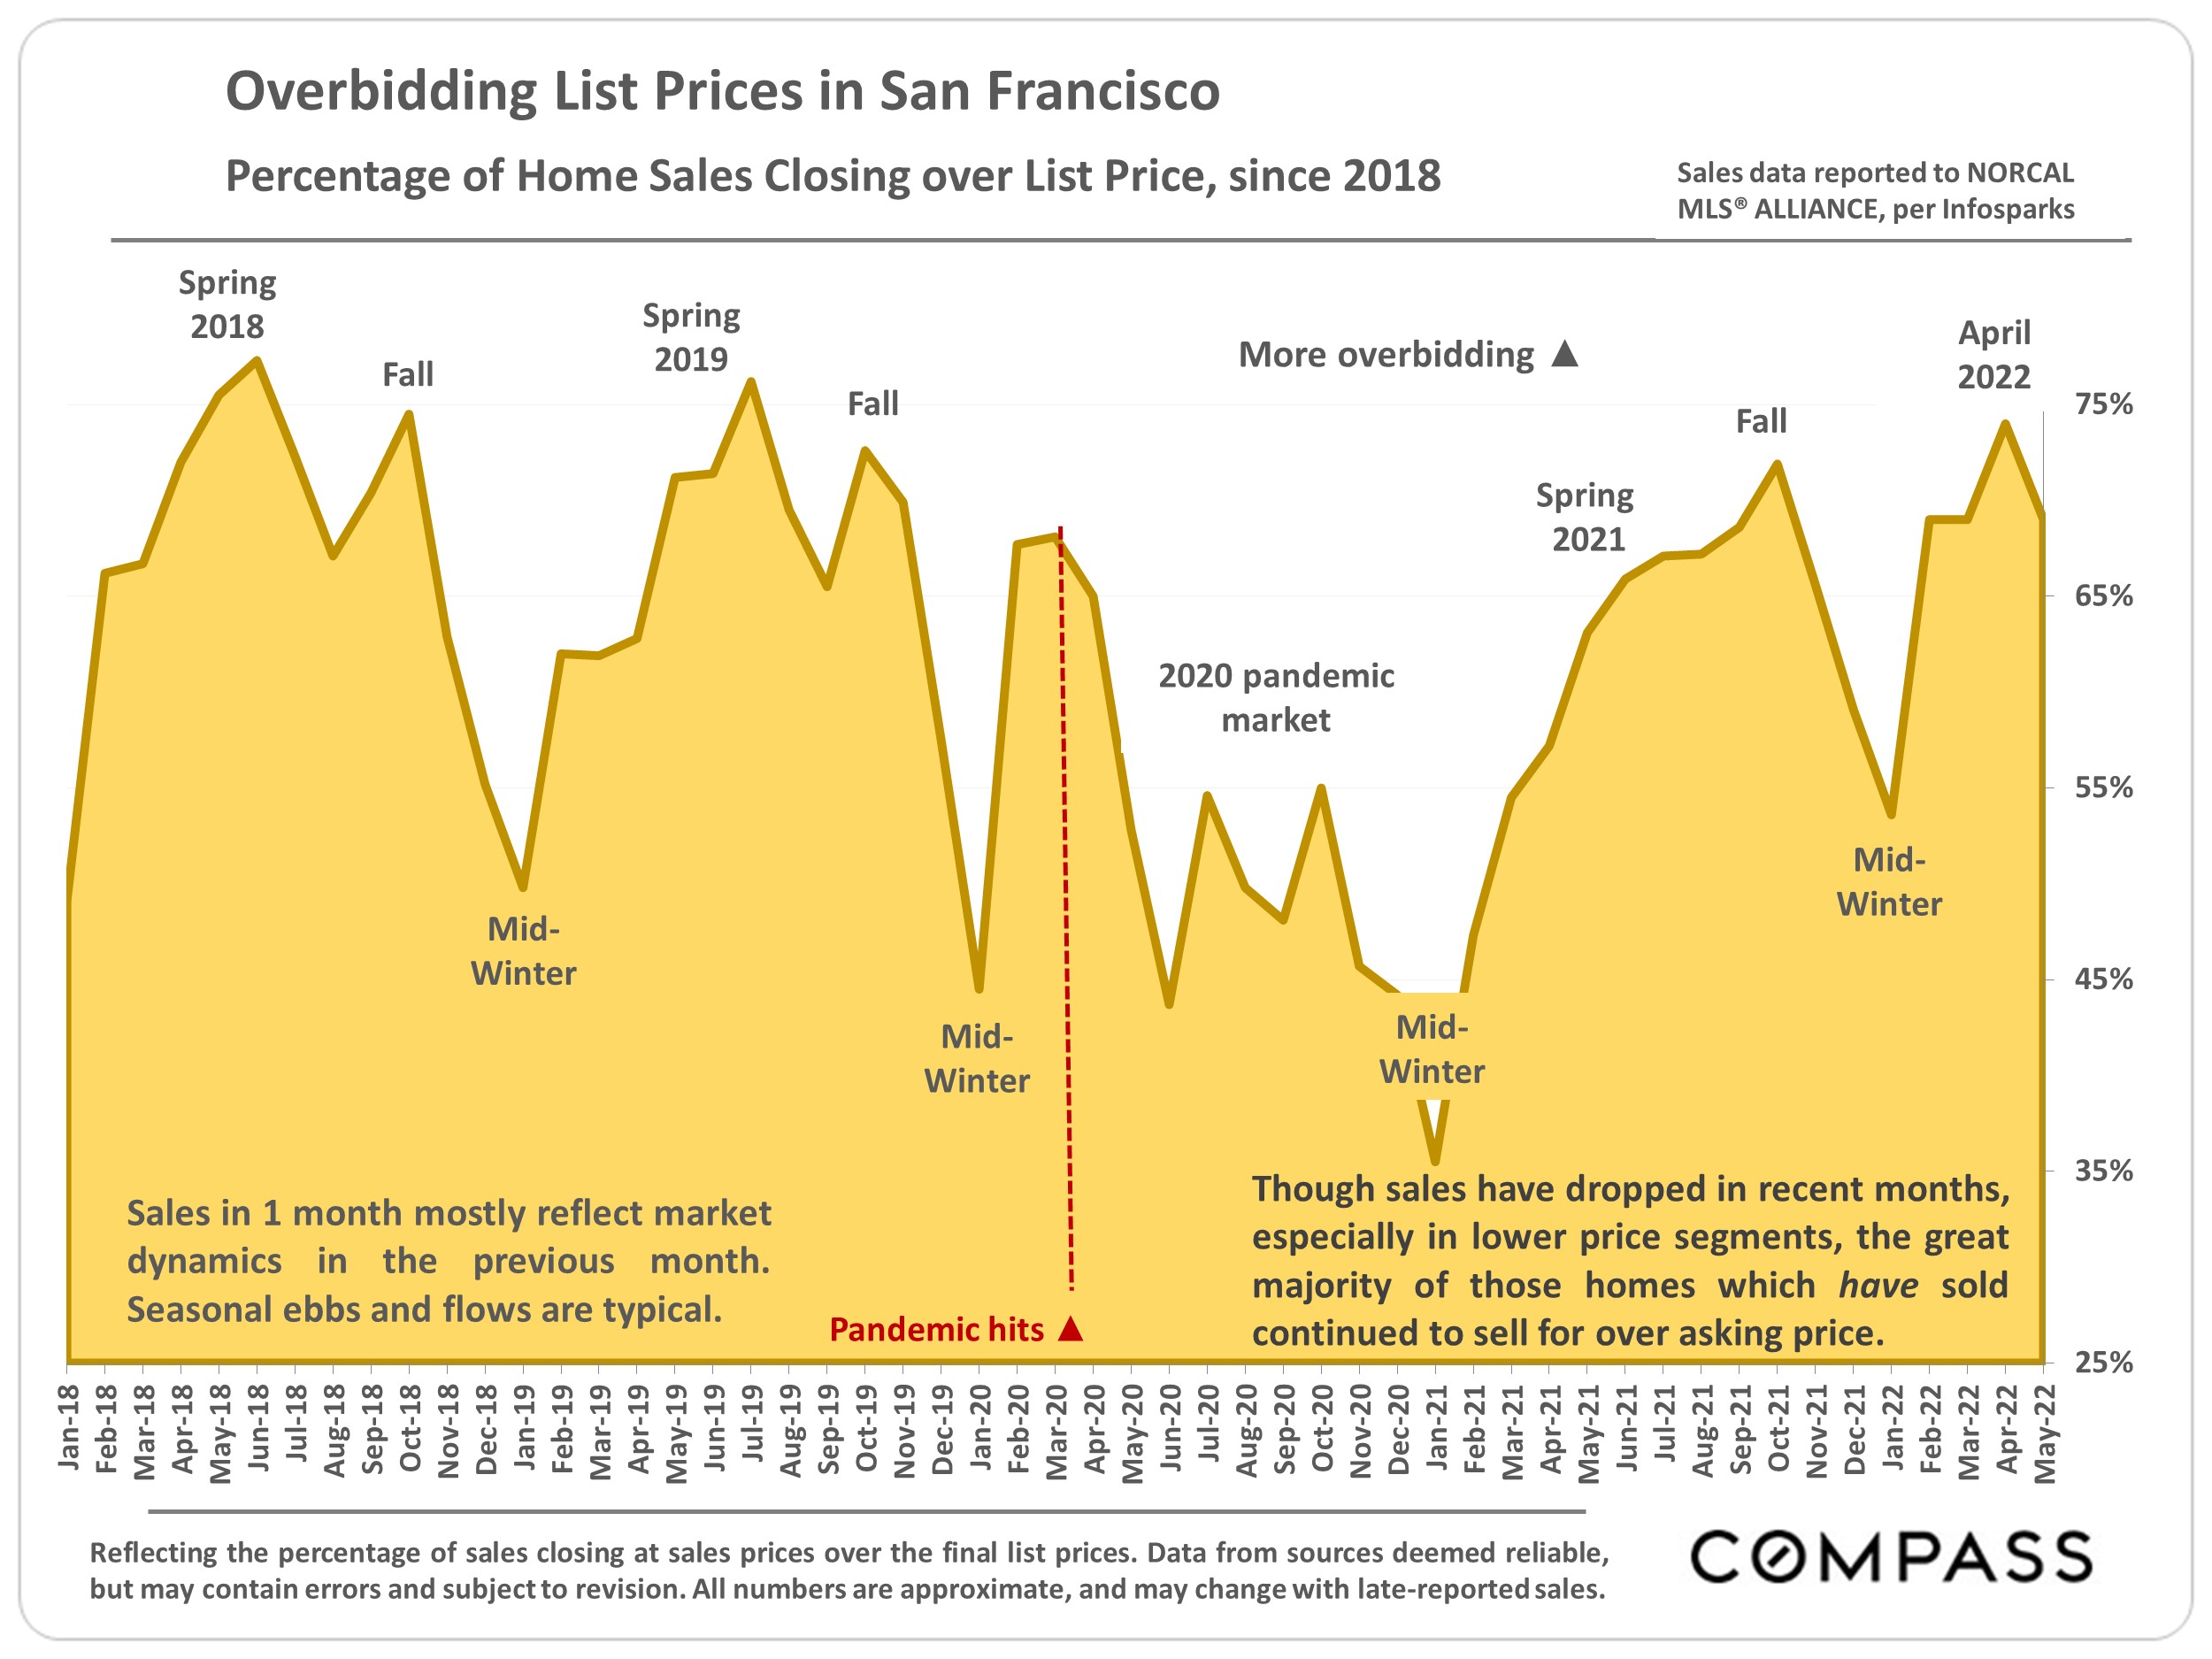
Clear Indications of Cooling Market Dynamics: Sales are declining, and the numbers of active listings and price reductions are increasing. But the homes that are selling are still, on average, selling quickly for well over asking: Median sales prices and year-over-year appreciation rates remain high. When an overheated market cools, the change is typically gradual (absent a disaster event), and does not mean the market is weak by any normal standard. As an analogy, if traffic is going 100 miles per hour and drops to 65, it feels a lot slower but cannot reasonably be described as slow.
People will continue to have excellent personal and financial reasons to buy and sell homes.
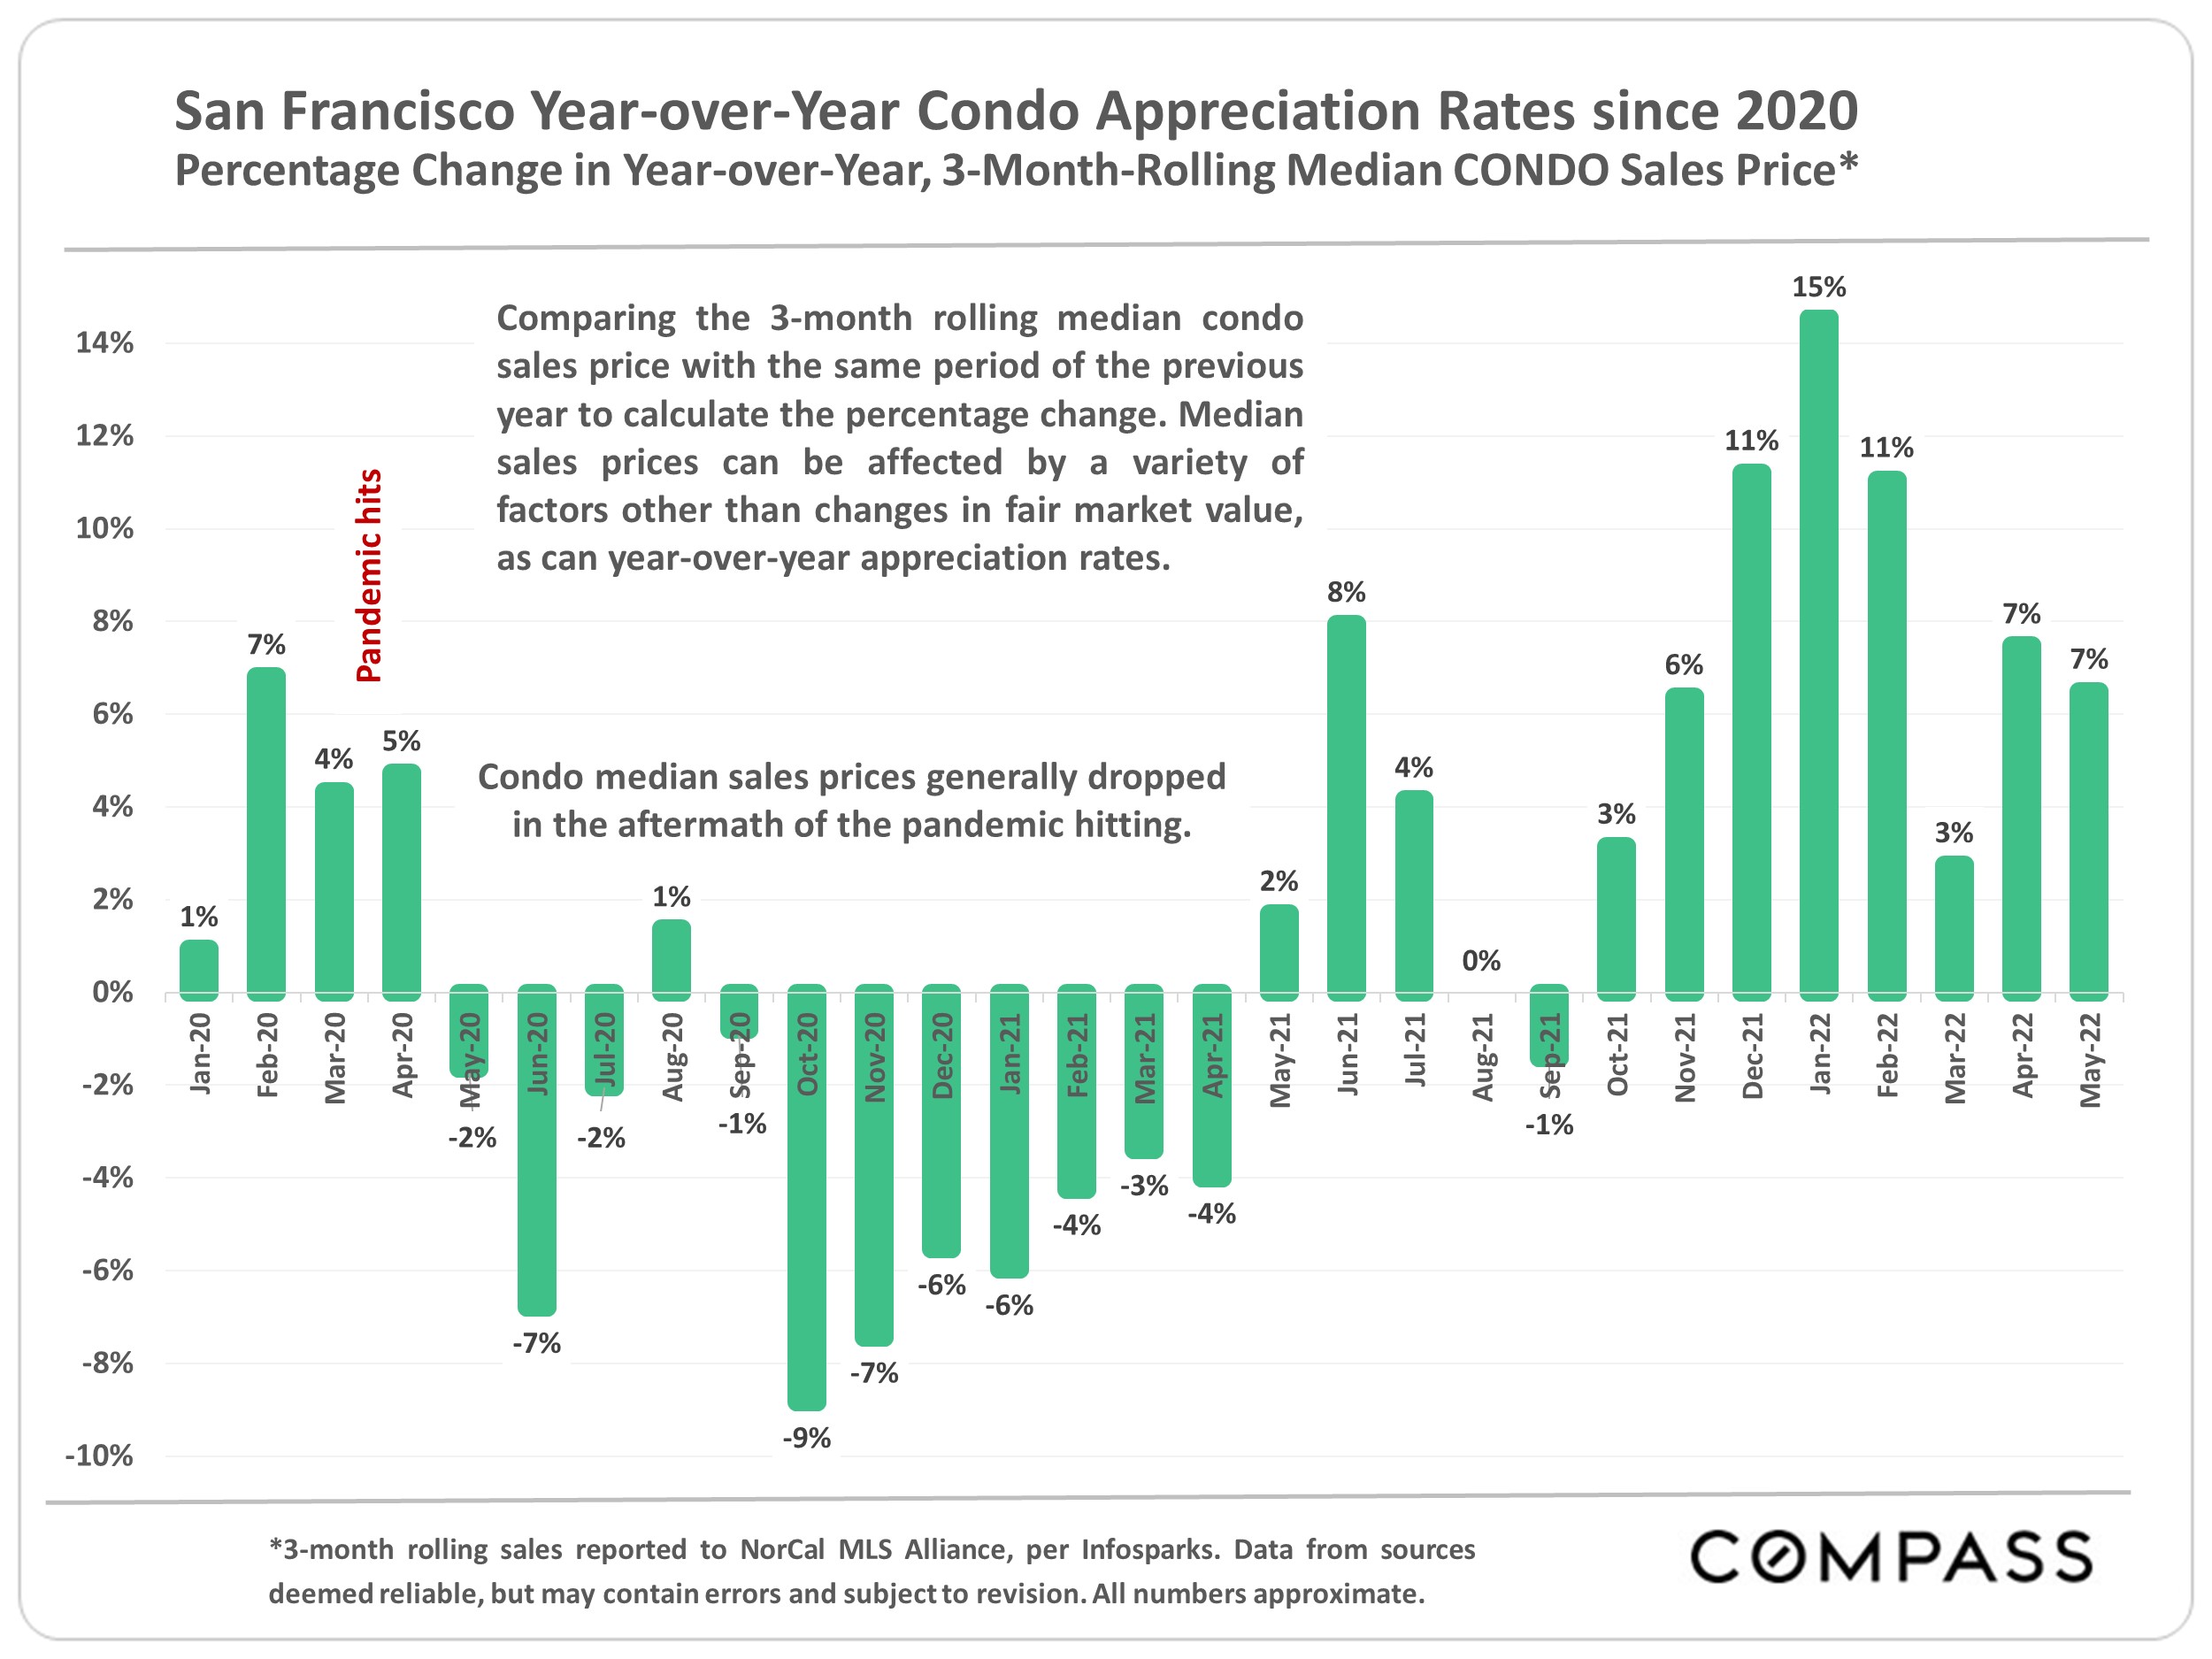
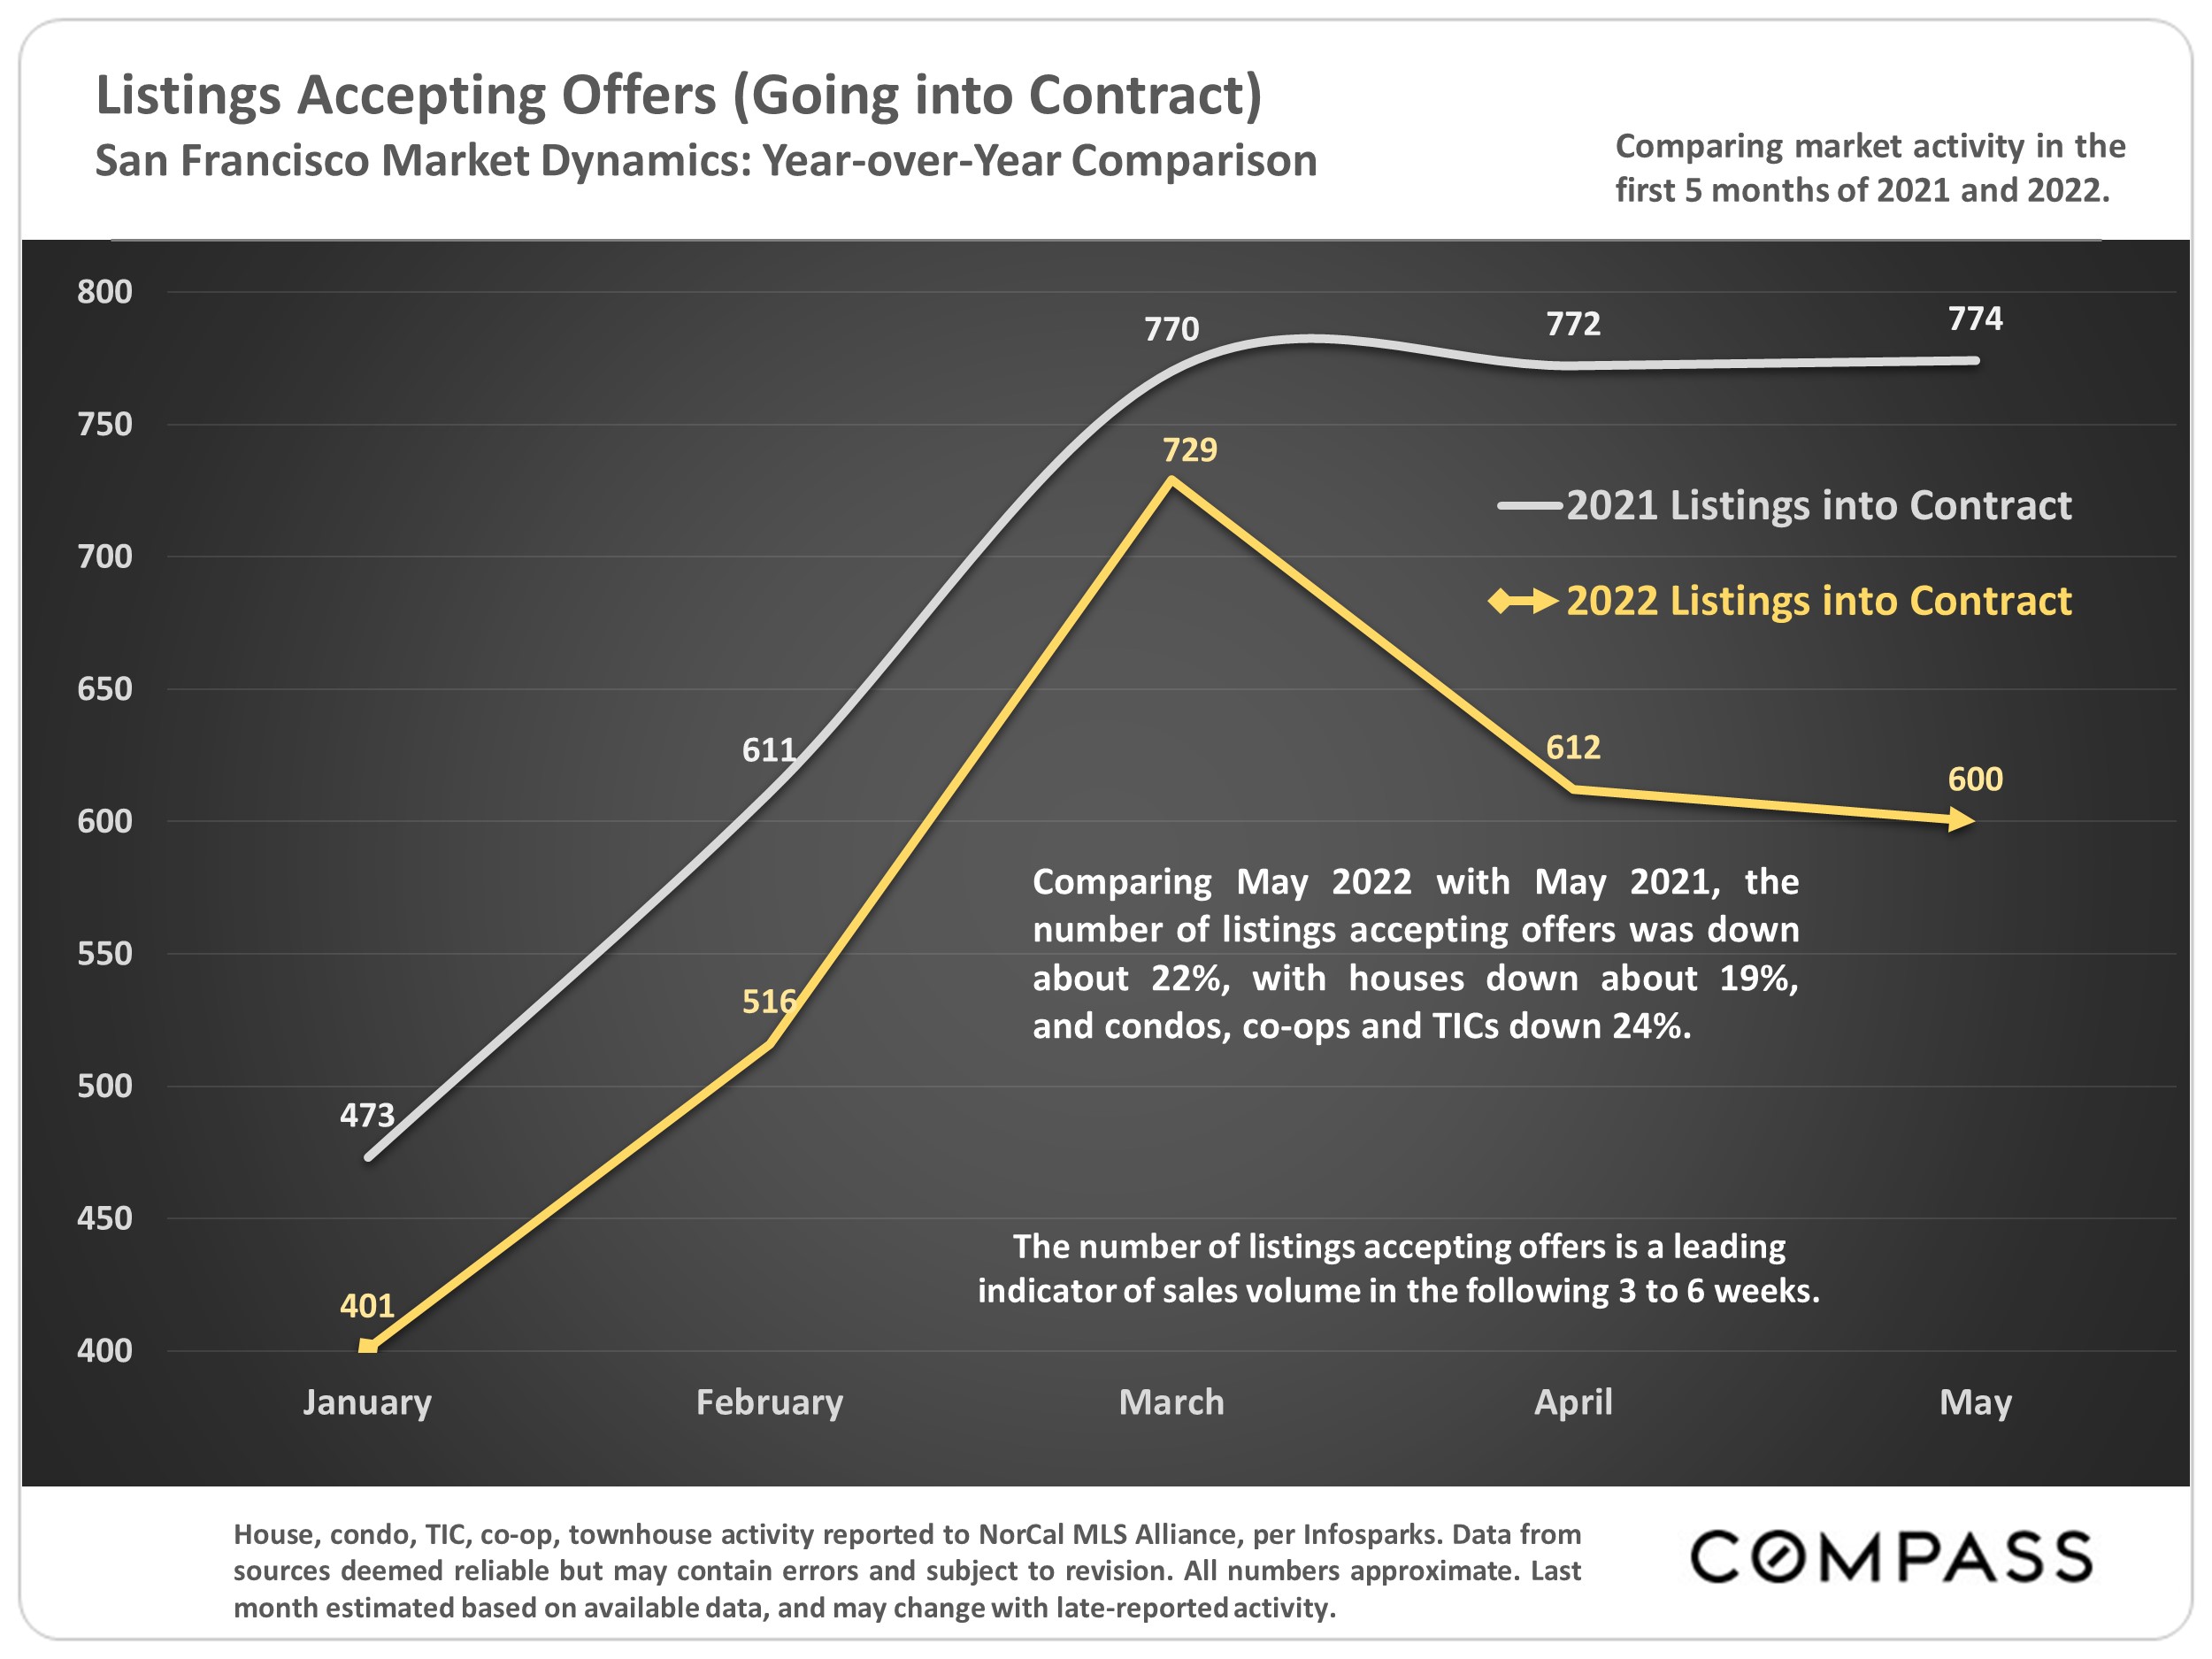
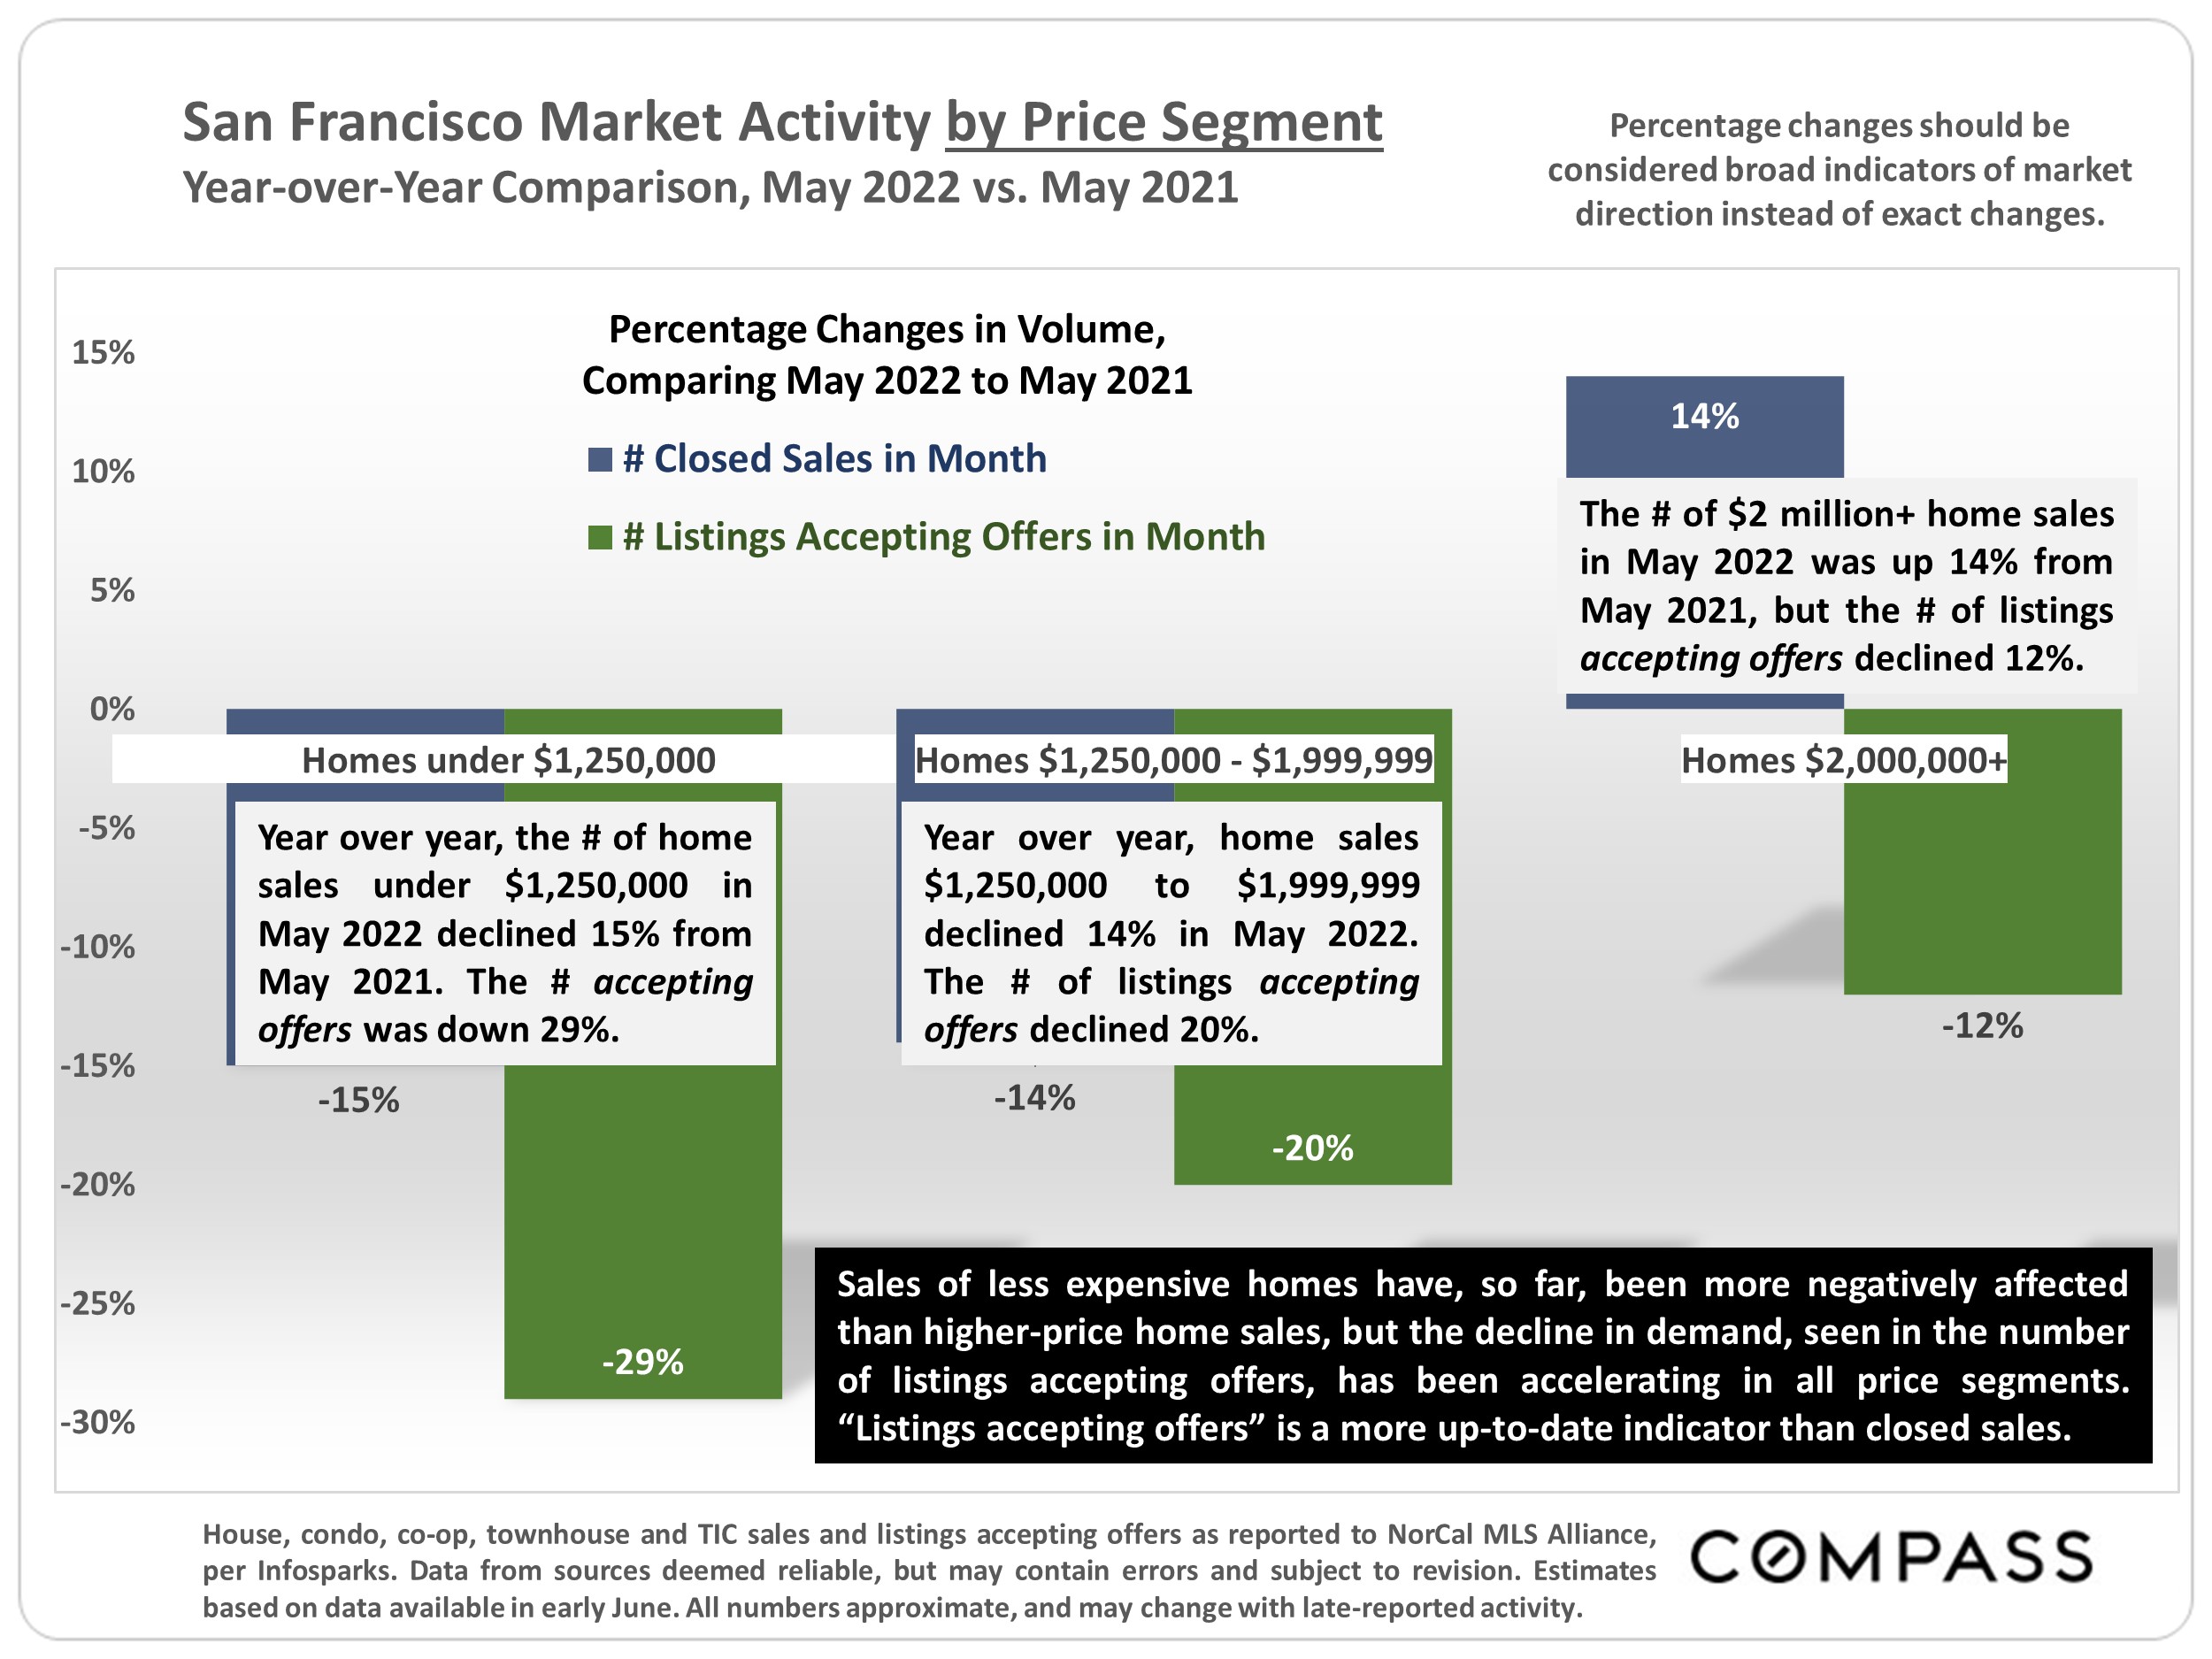
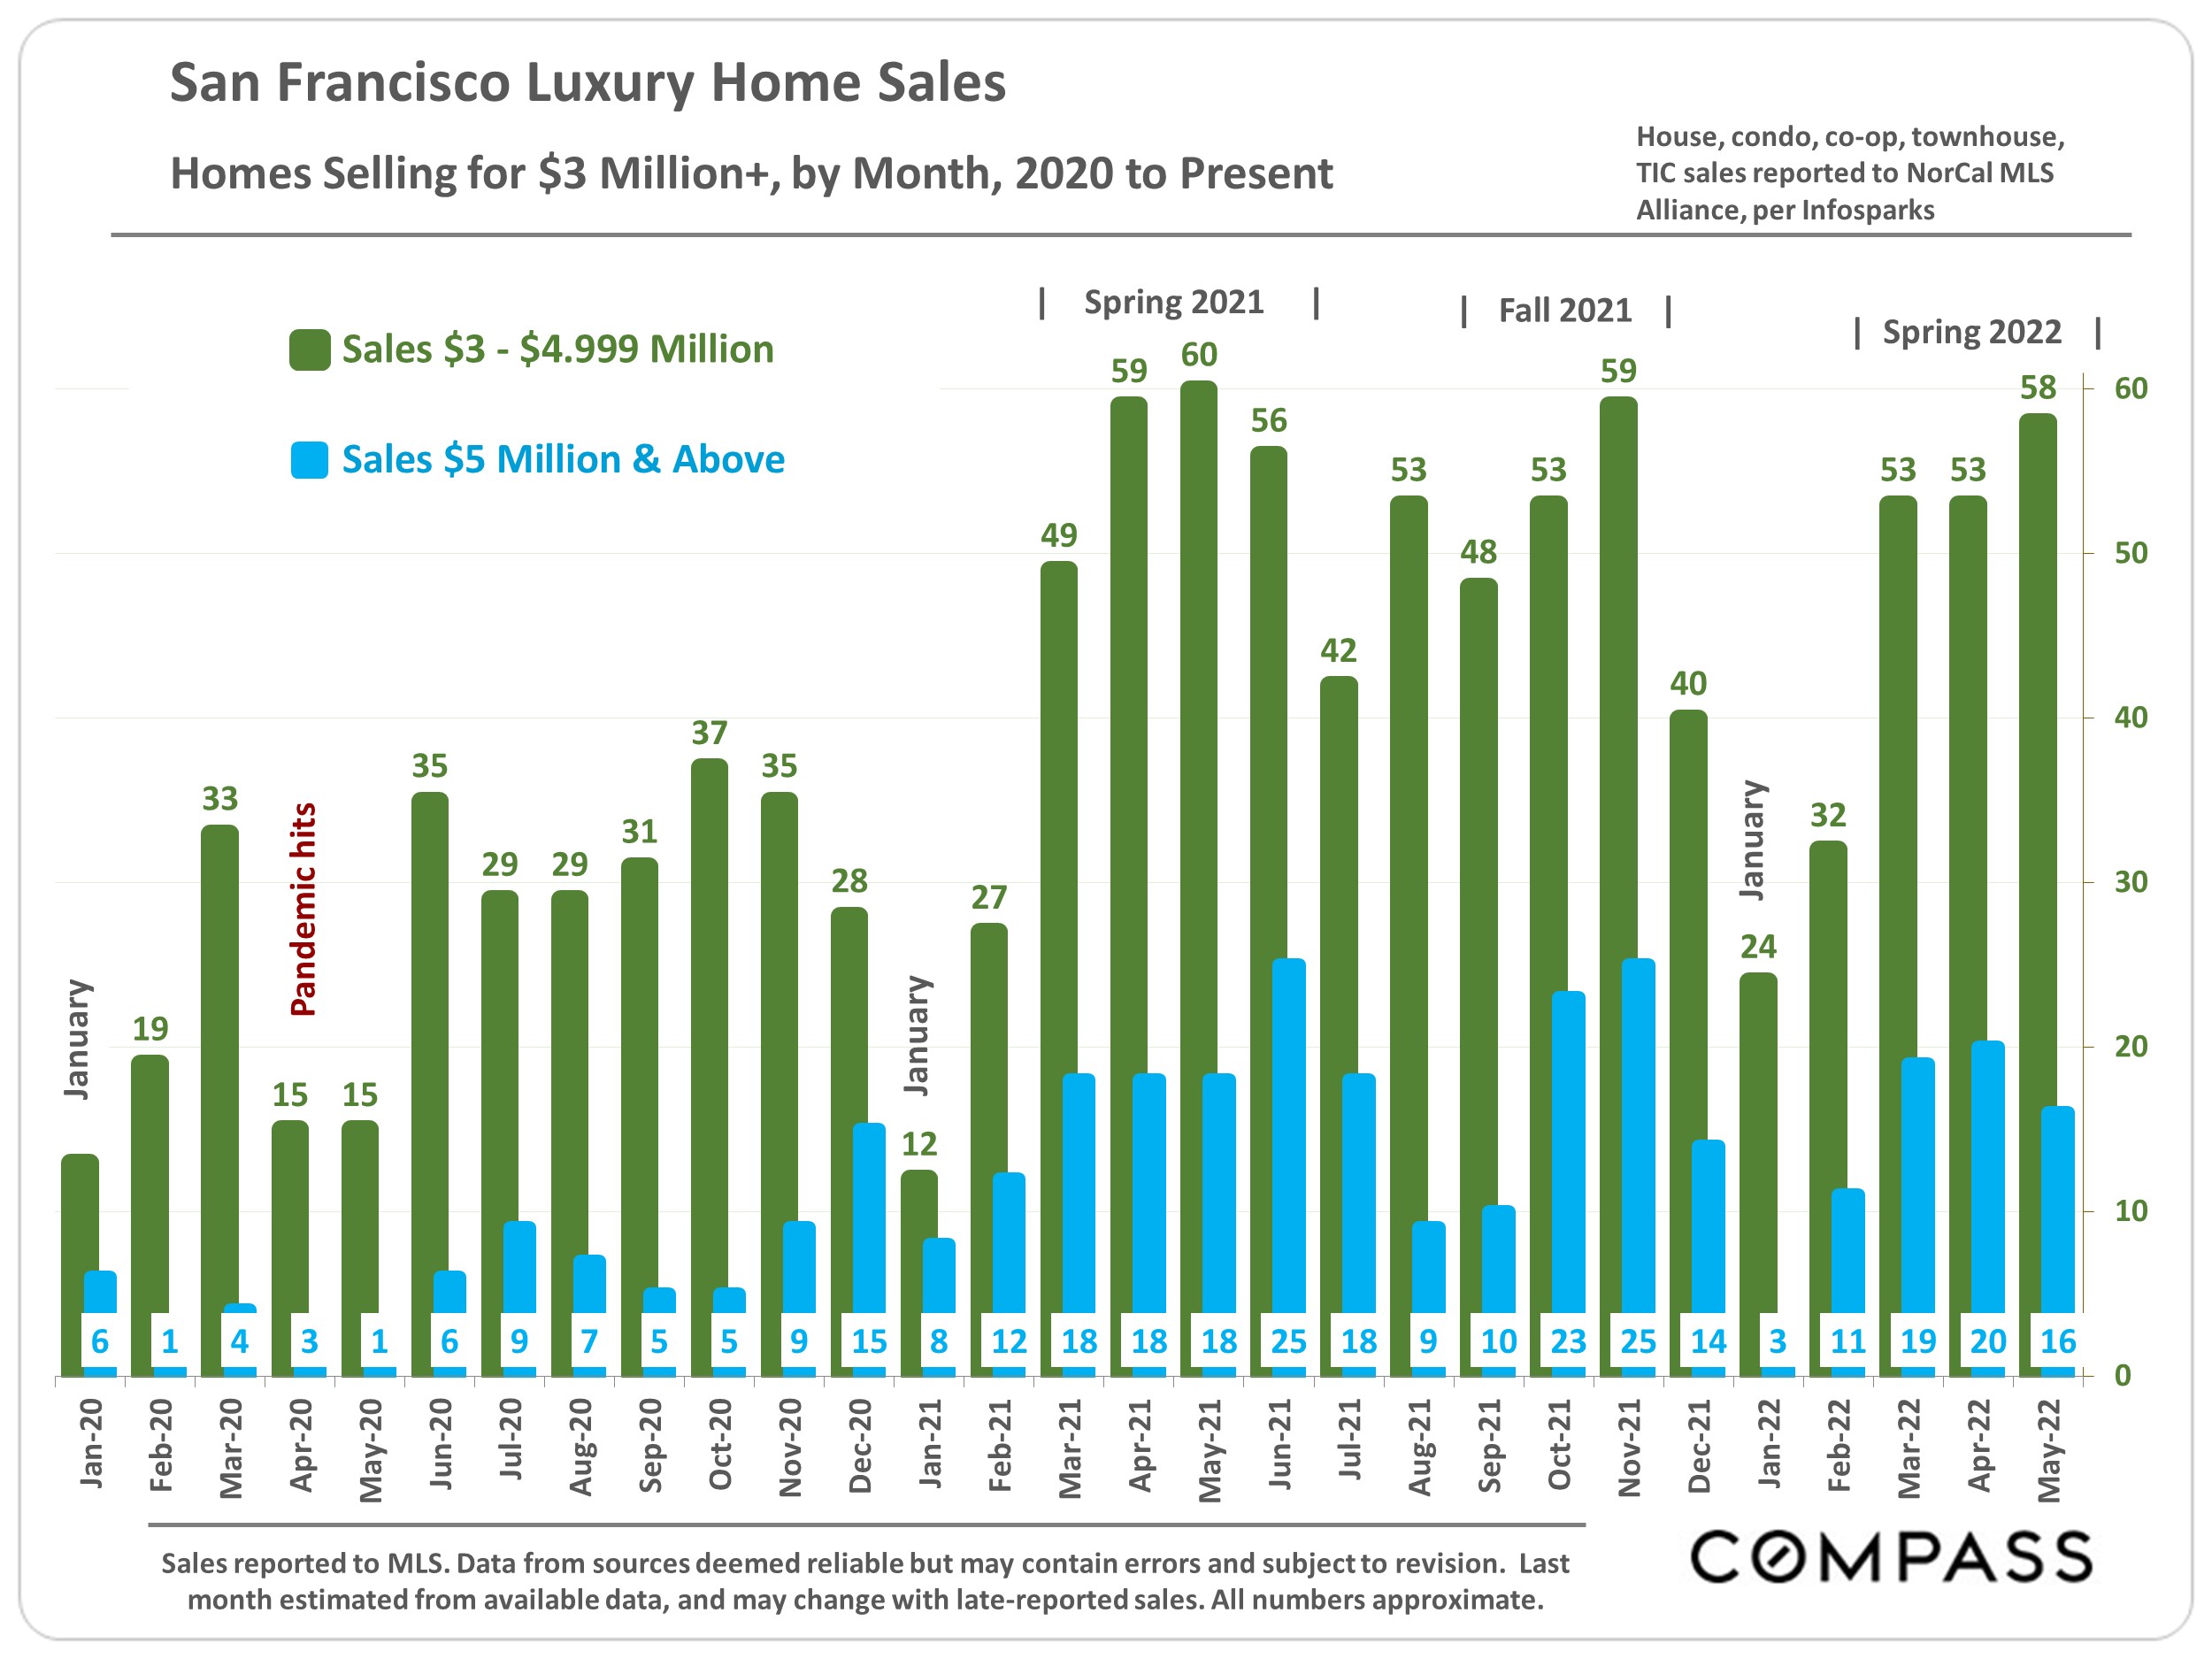
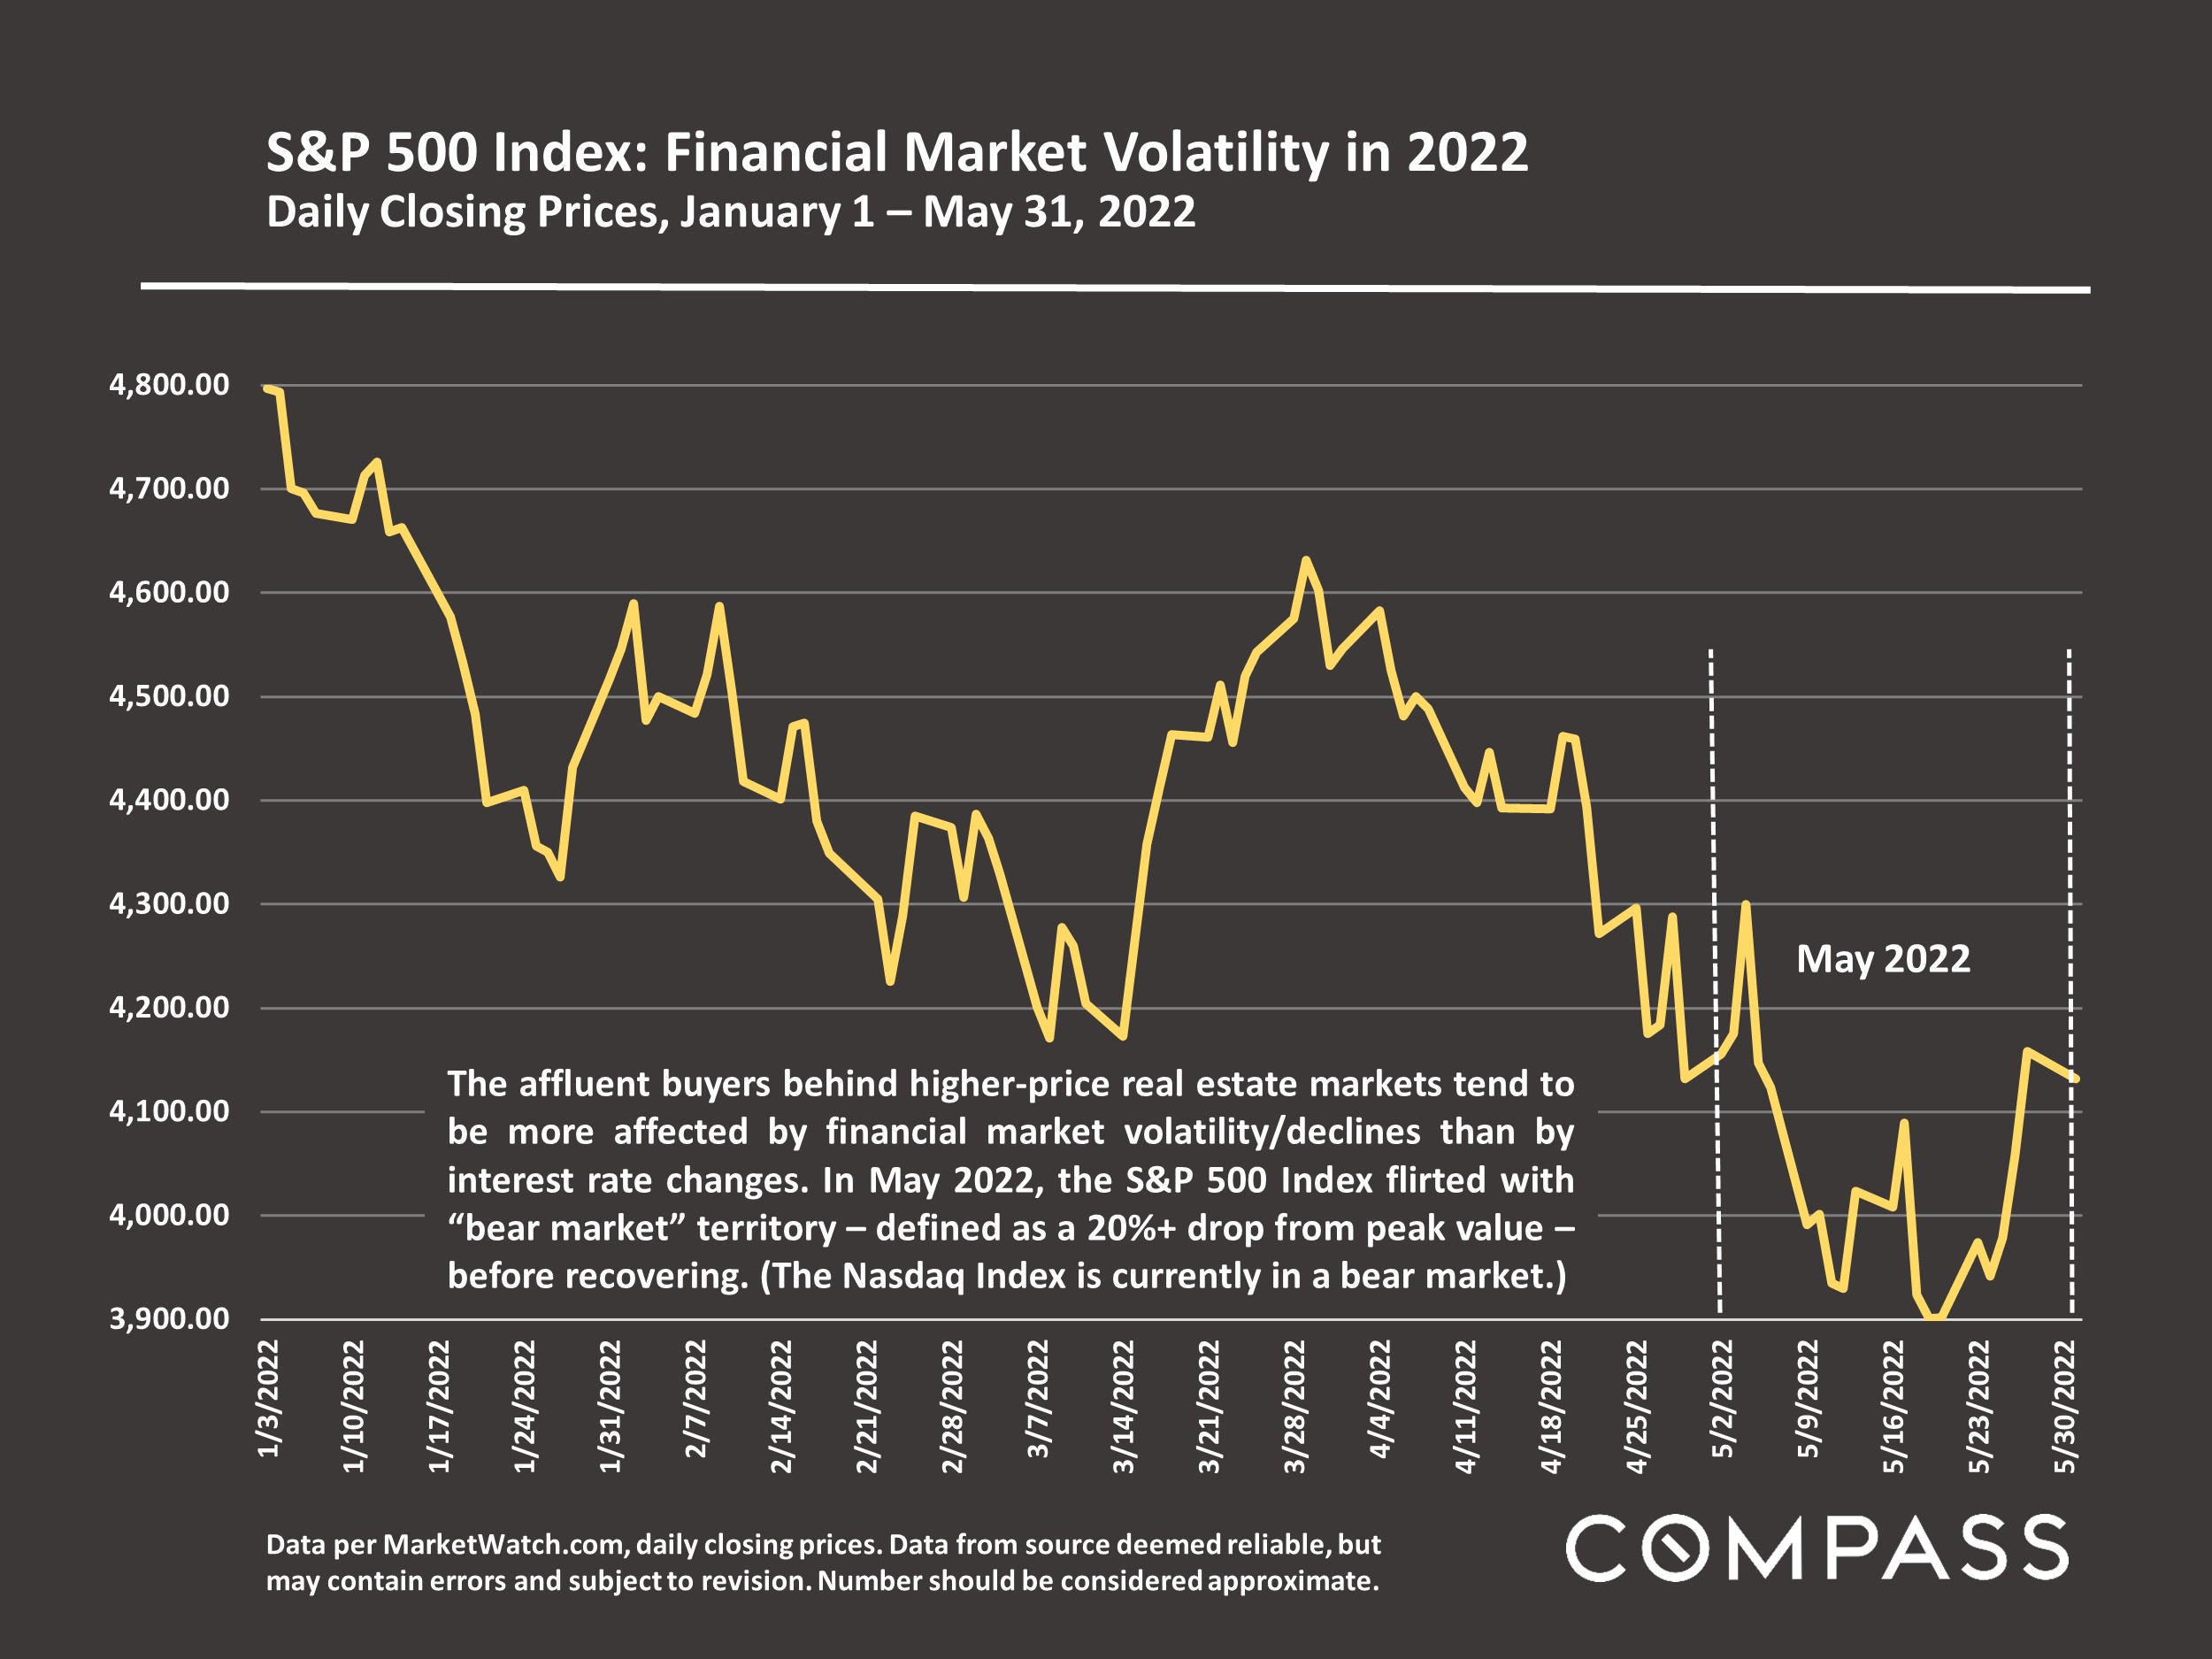
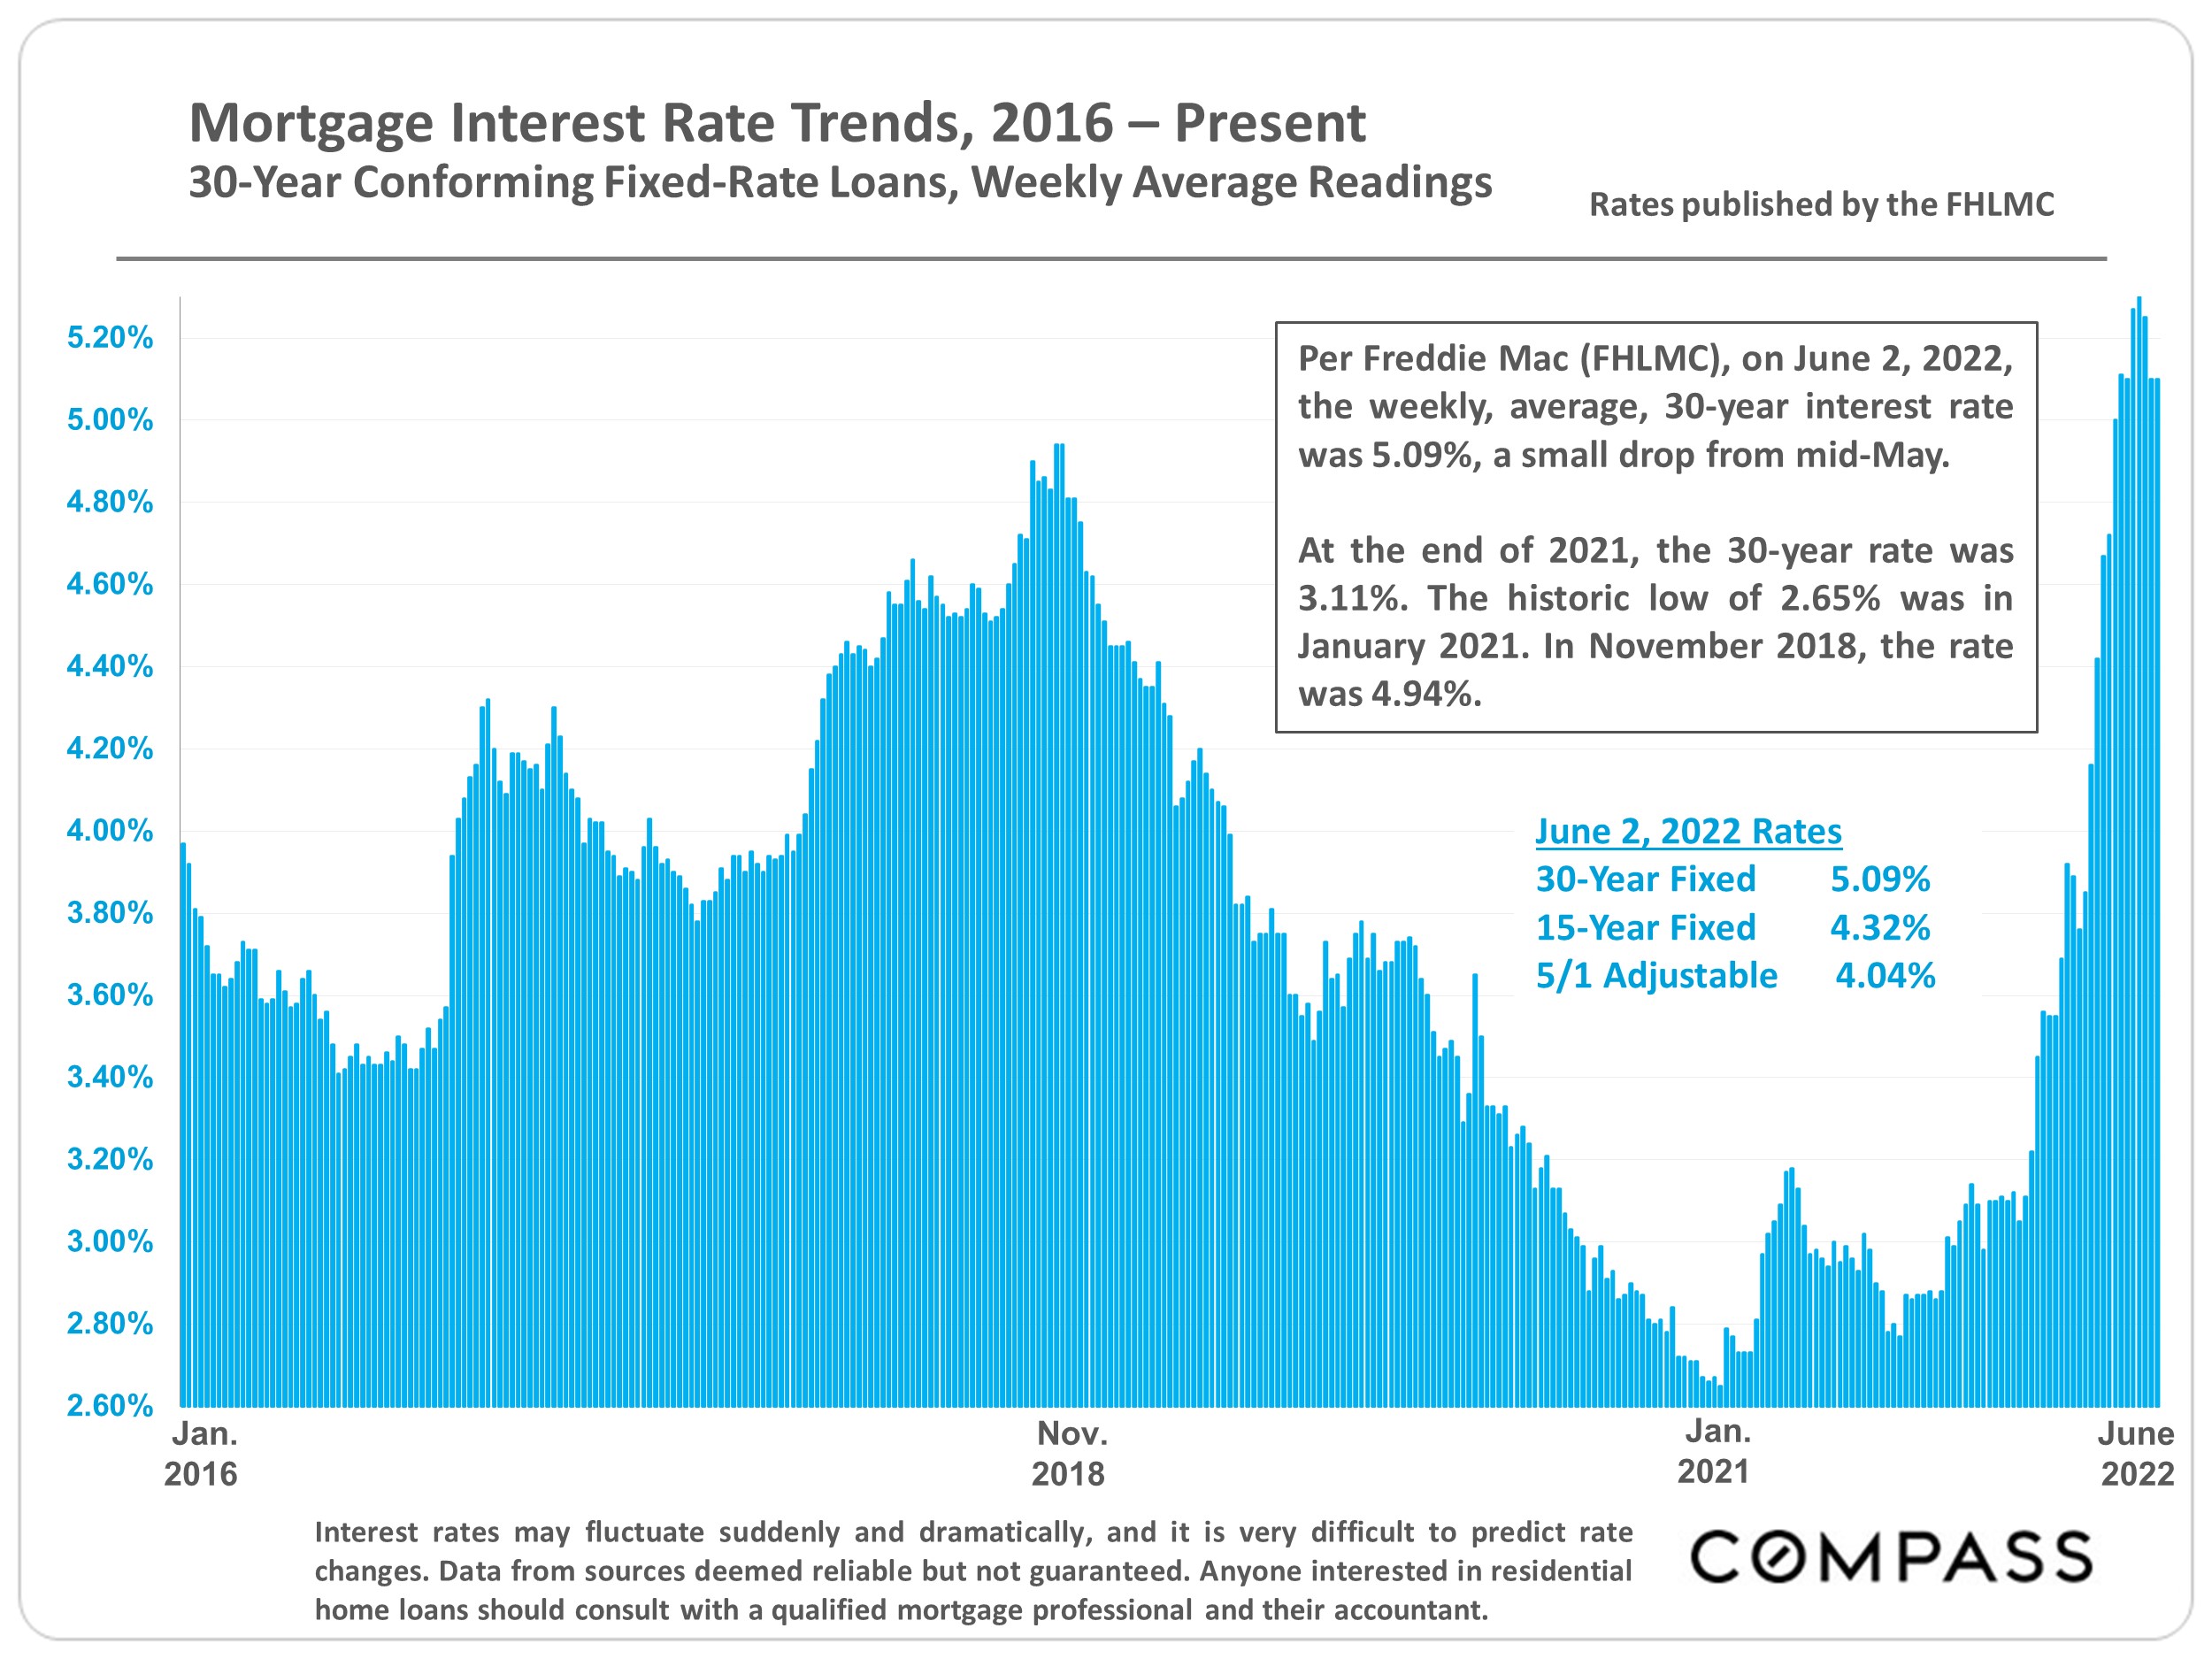
As of late spring, across the Bay Area, less expensive home sales have been considerably impacted by rising interest rates – and this certainly occurred in San Francisco, particularly in the condo market. Sales of higher-priced homes (mostly houses) have held up much better, but cooling demand is beginning to show up in pending-sale data. (Affluent buyers tend to be more affected by financial markets, which became very volatile in May.) Market changes are often uneven in the early months of a transition, with one home selling in days at well over list price, while next door, the seller has to reduce their price to get an offer. As markets cool, buyers become more discriminating; negative conditions previously ignored are noticed; more negotiation occurs; multiple offers and overbidding decline. Listings that are well prepared, show well, and priced right will have an increasing advantage.
The homes that are not selling quickly won’t affect overbid and days-on-market statistics until future months. The high appreciation rates of the last 2 years will almost certainly start to decline (which is not the
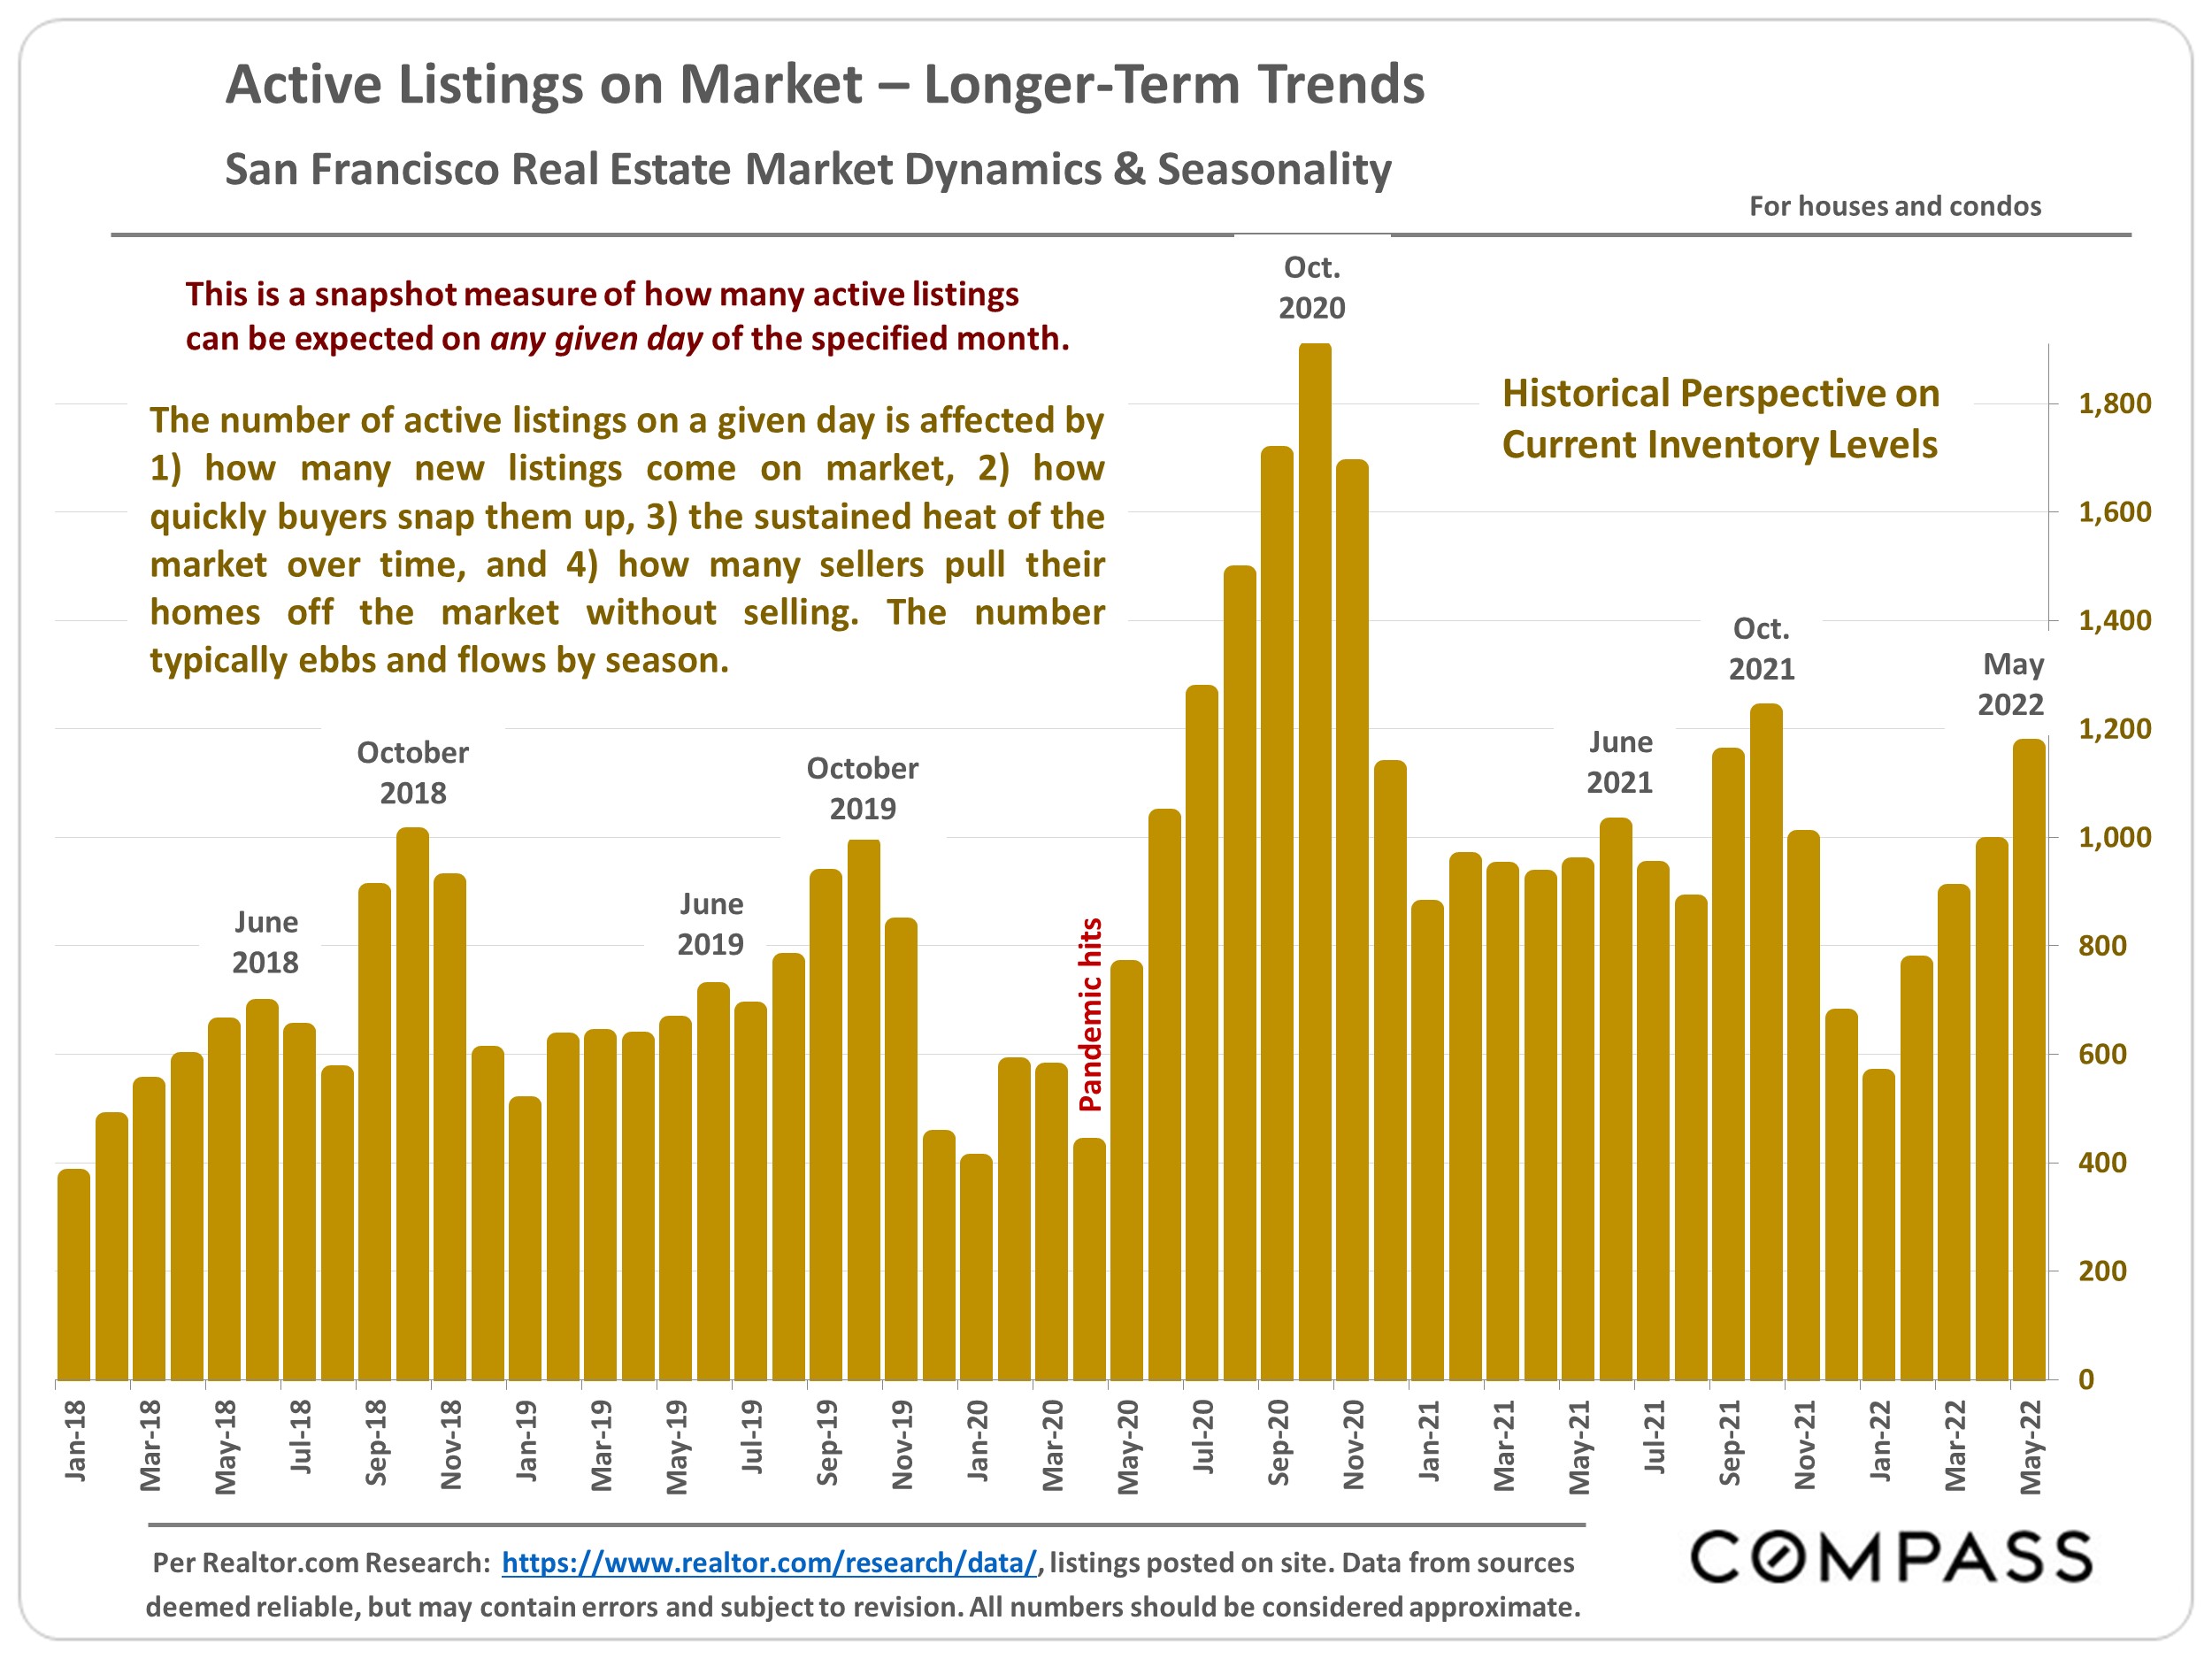
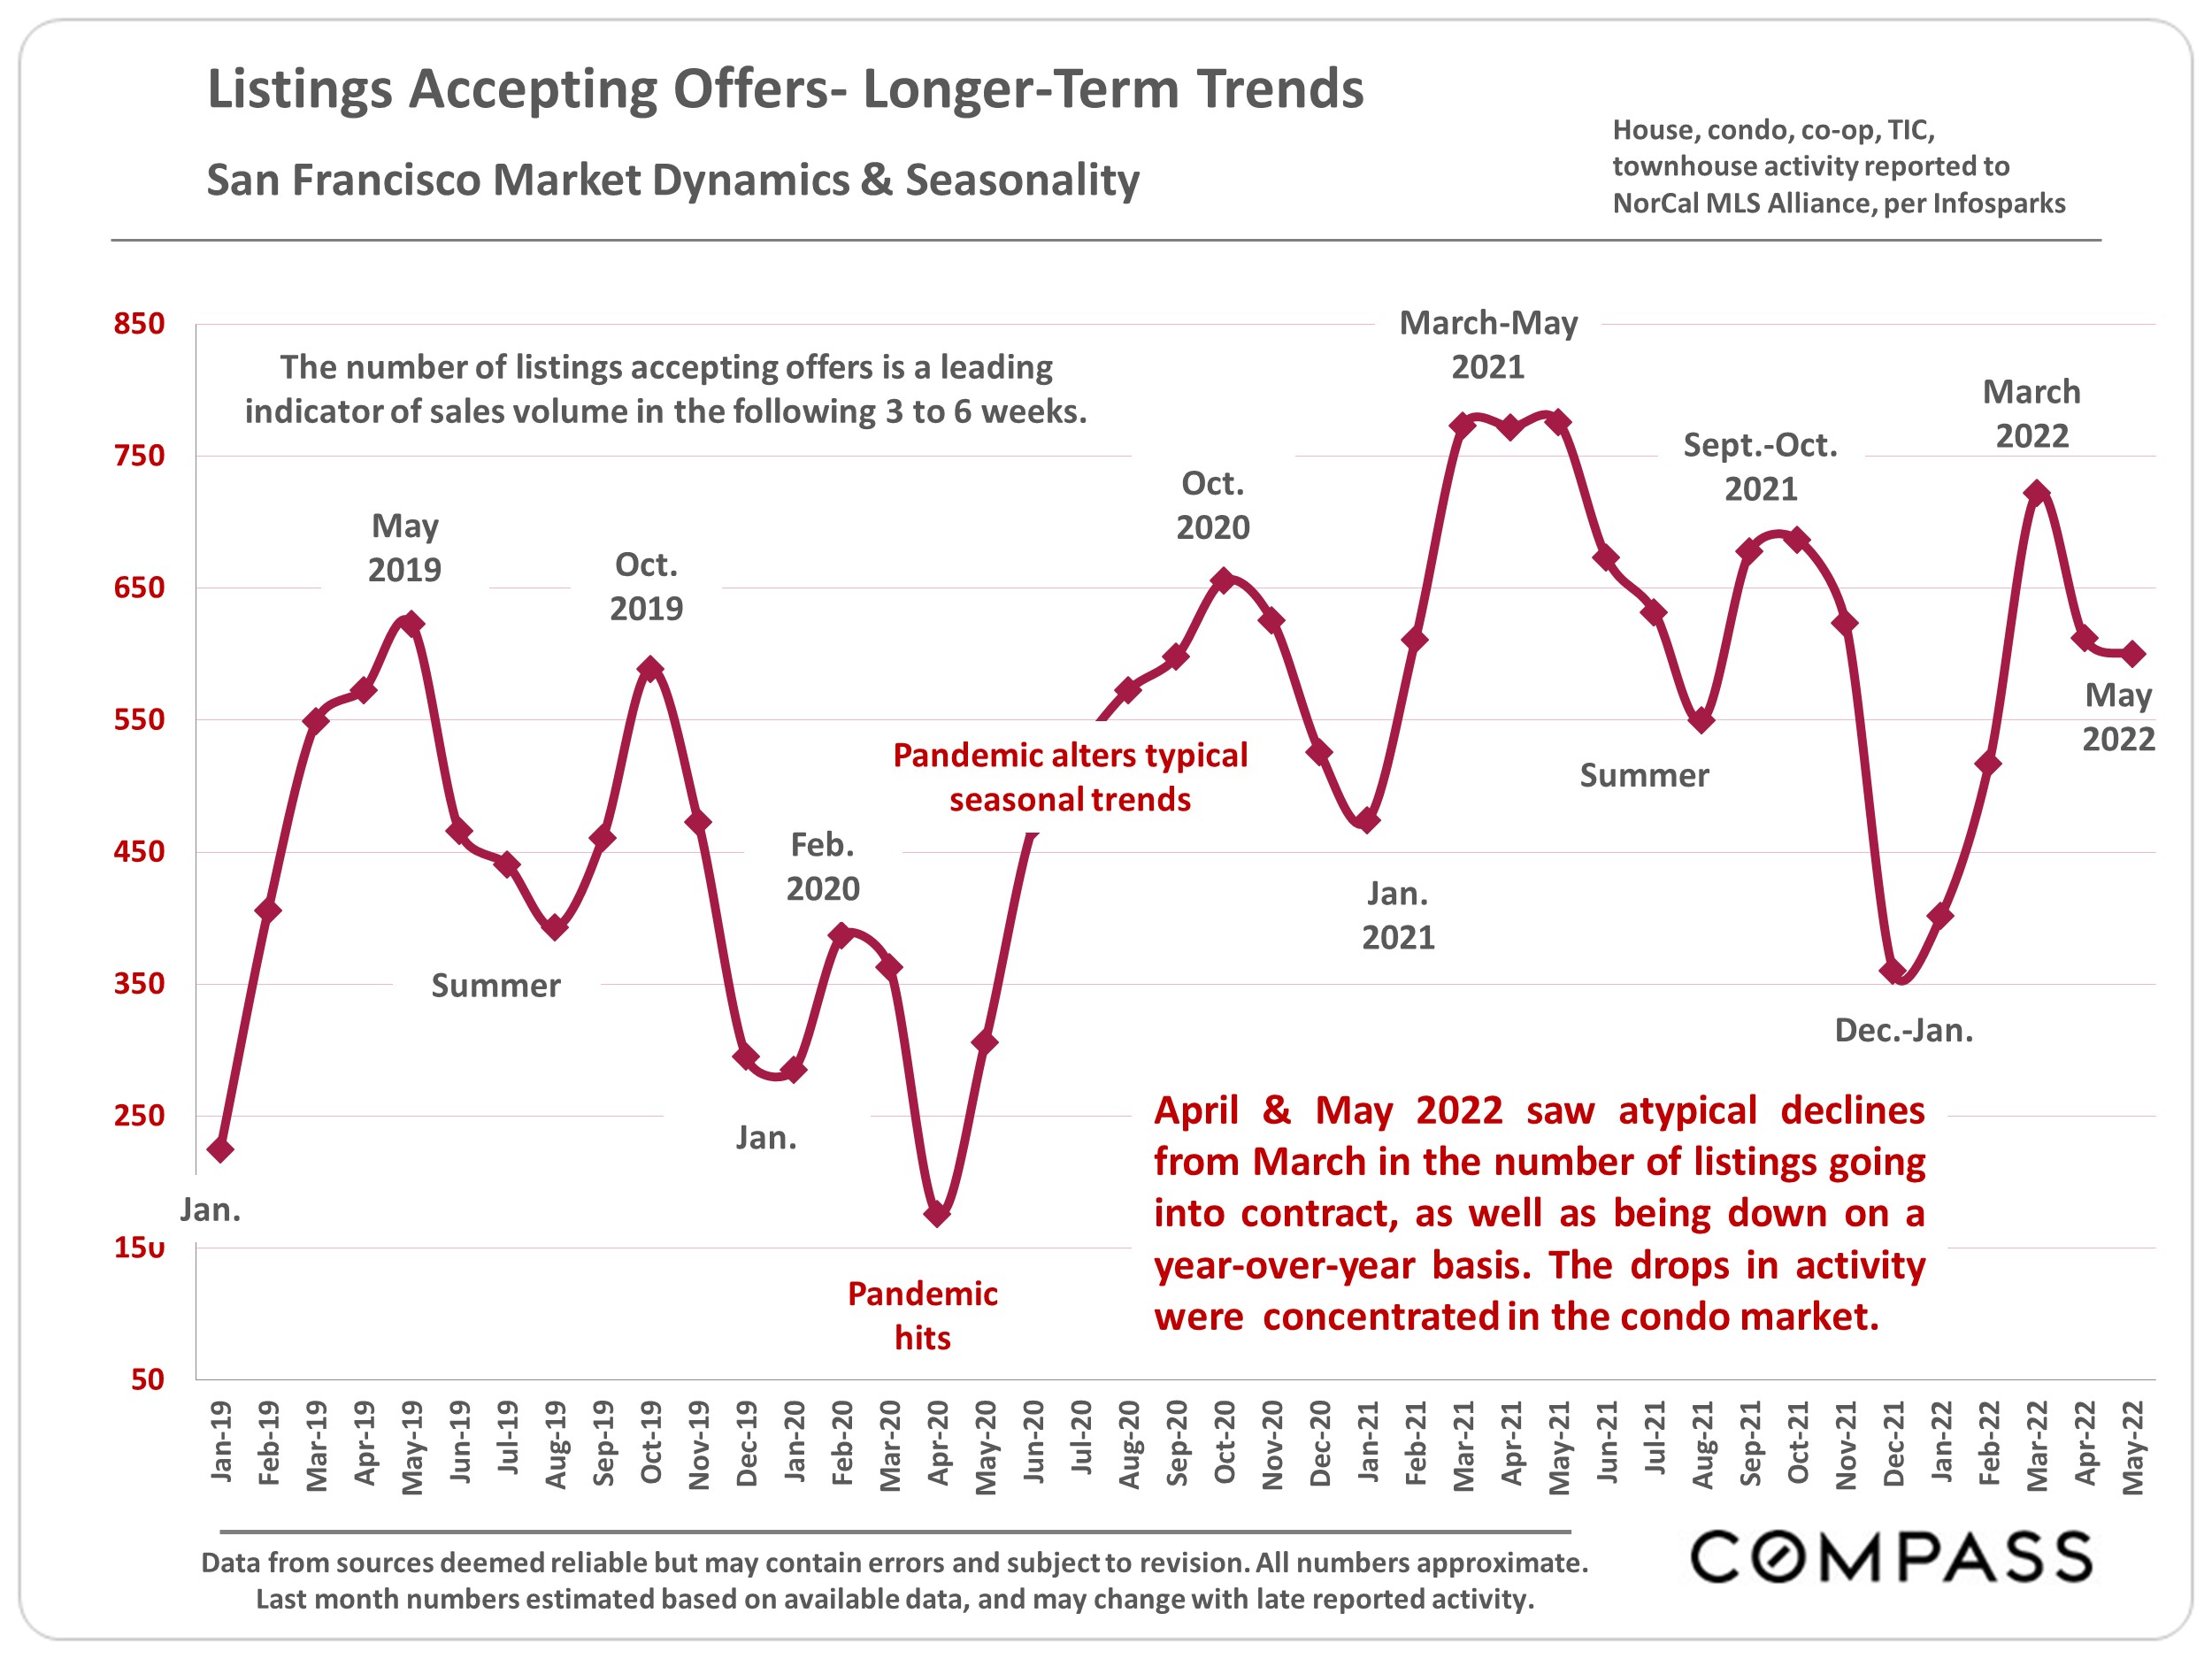
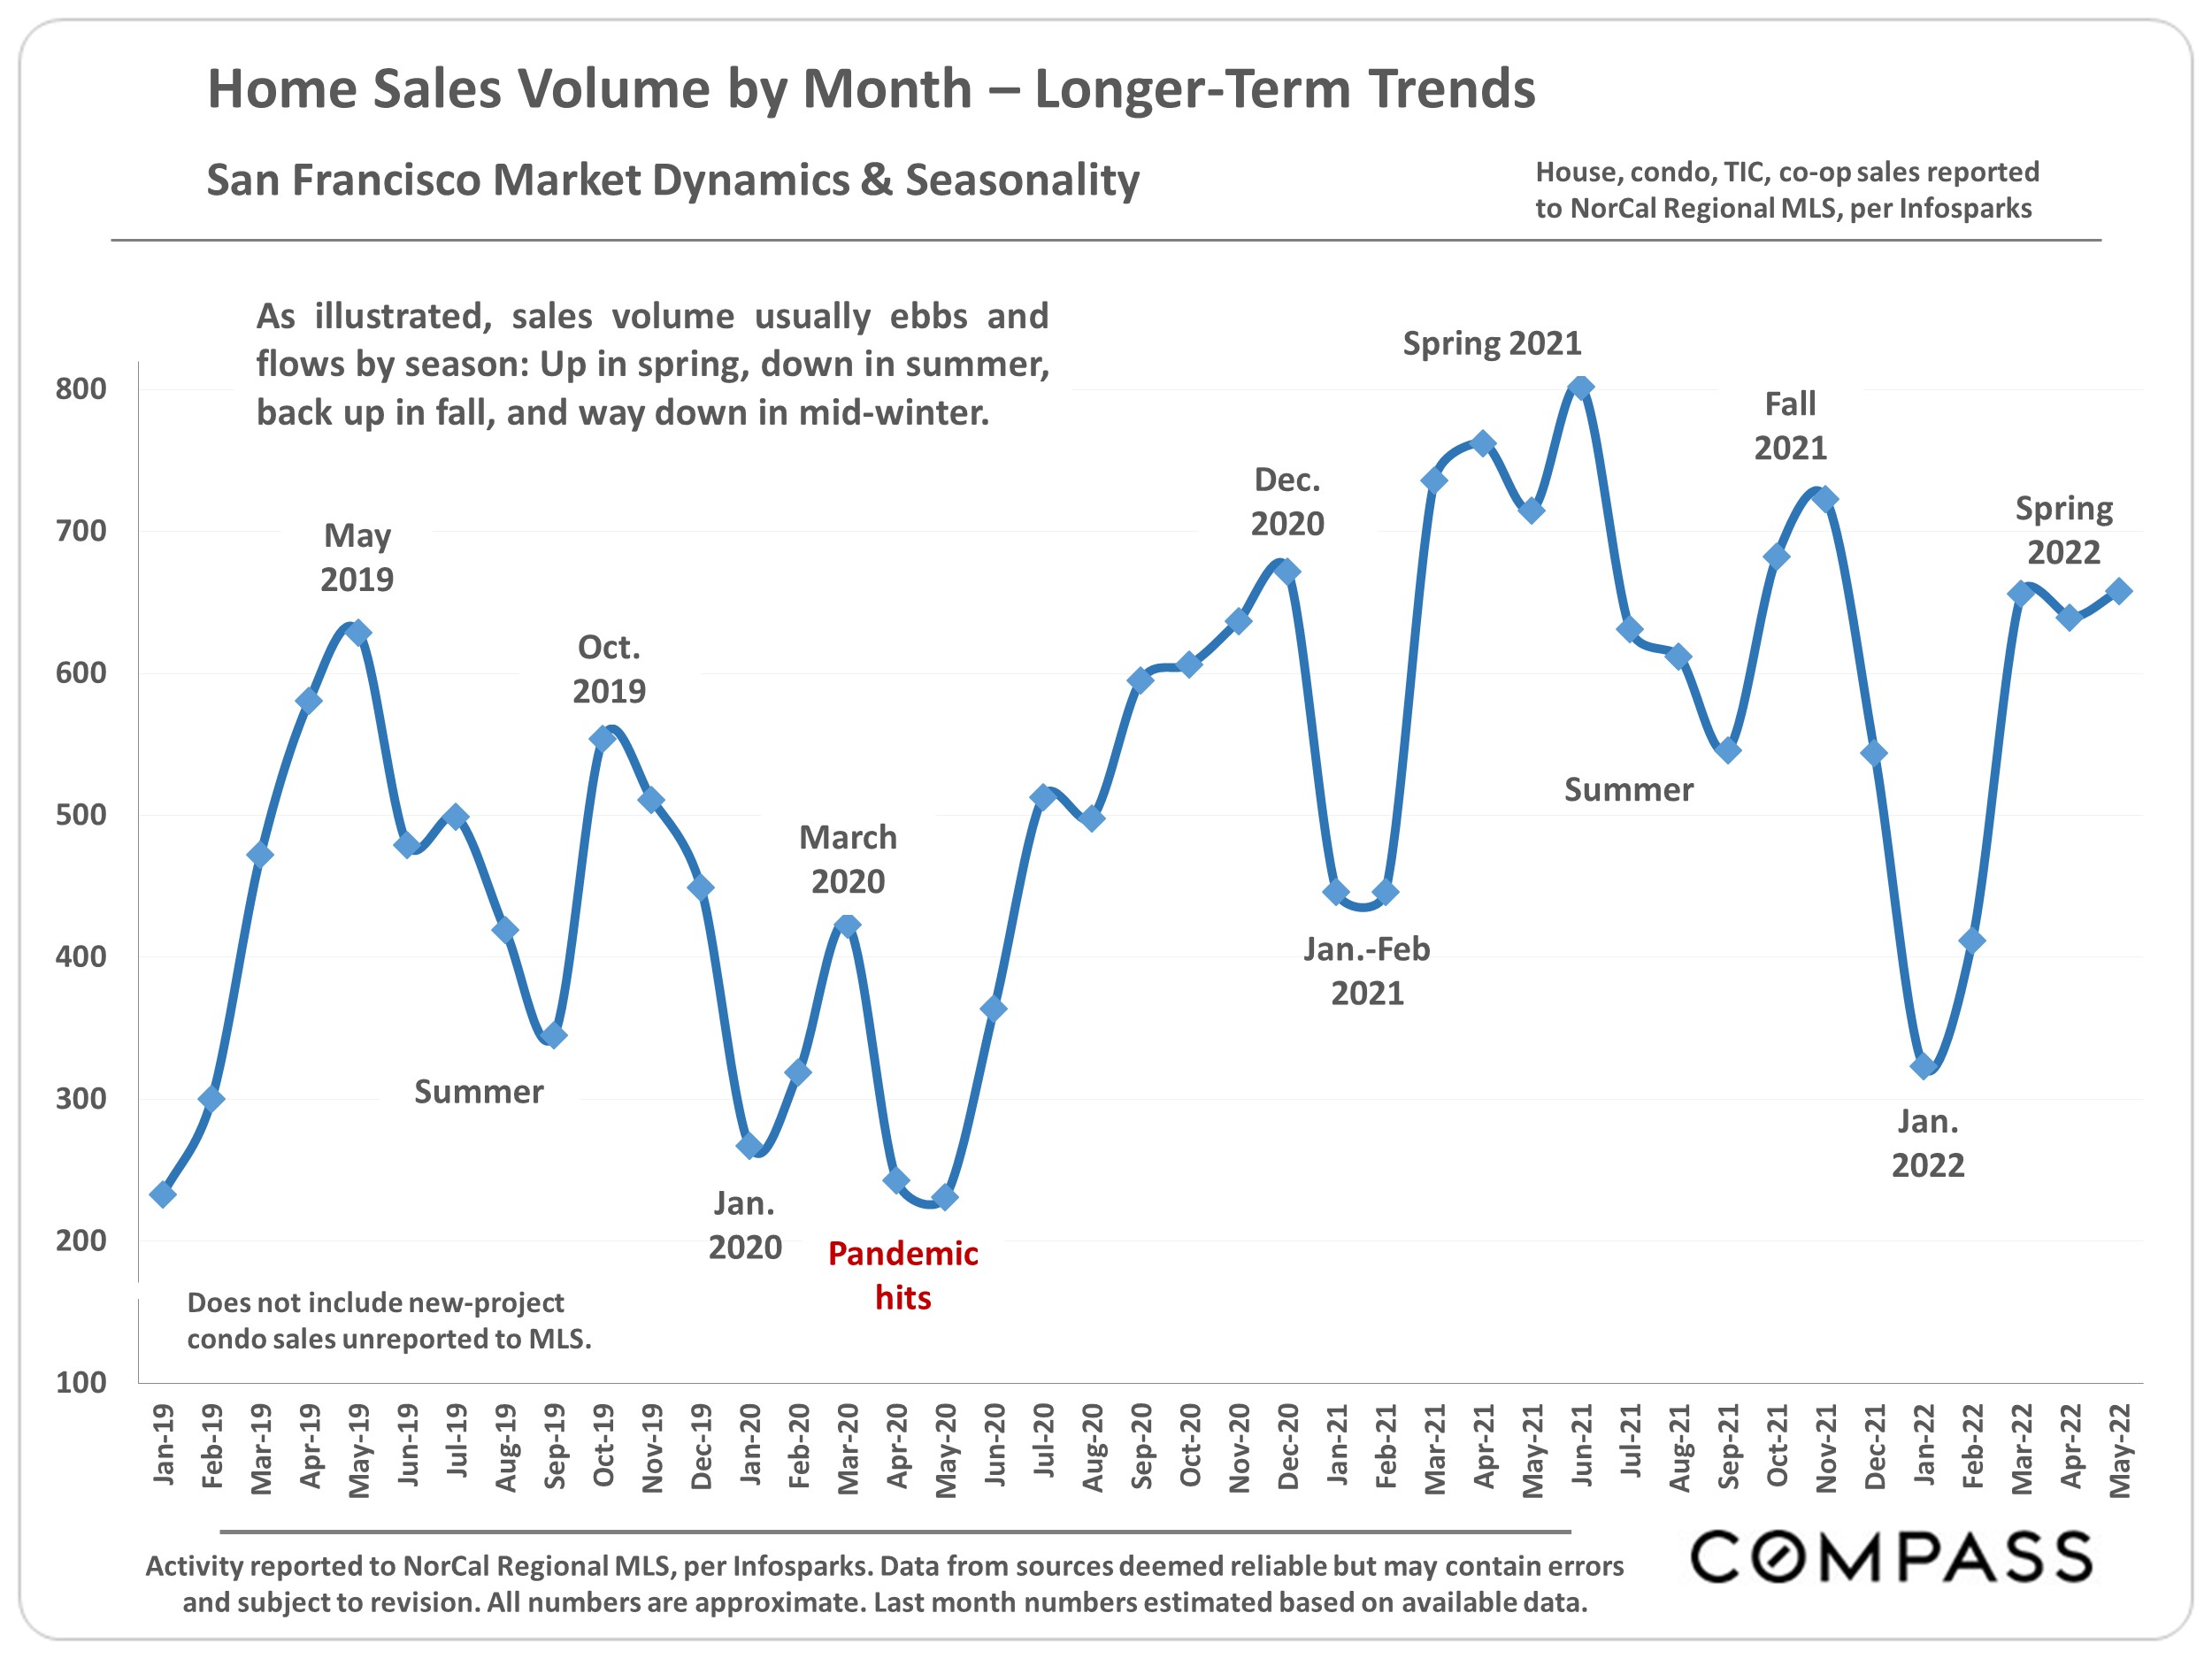
same thing as an imminent decline in prices). After peaking in spring, activity in San Francisco typically slows through summer. Autumn usually sees another big, short spike in activity prior to the mid-winter slowdown. These are common seasonal dynamics, though other factors can come into play.
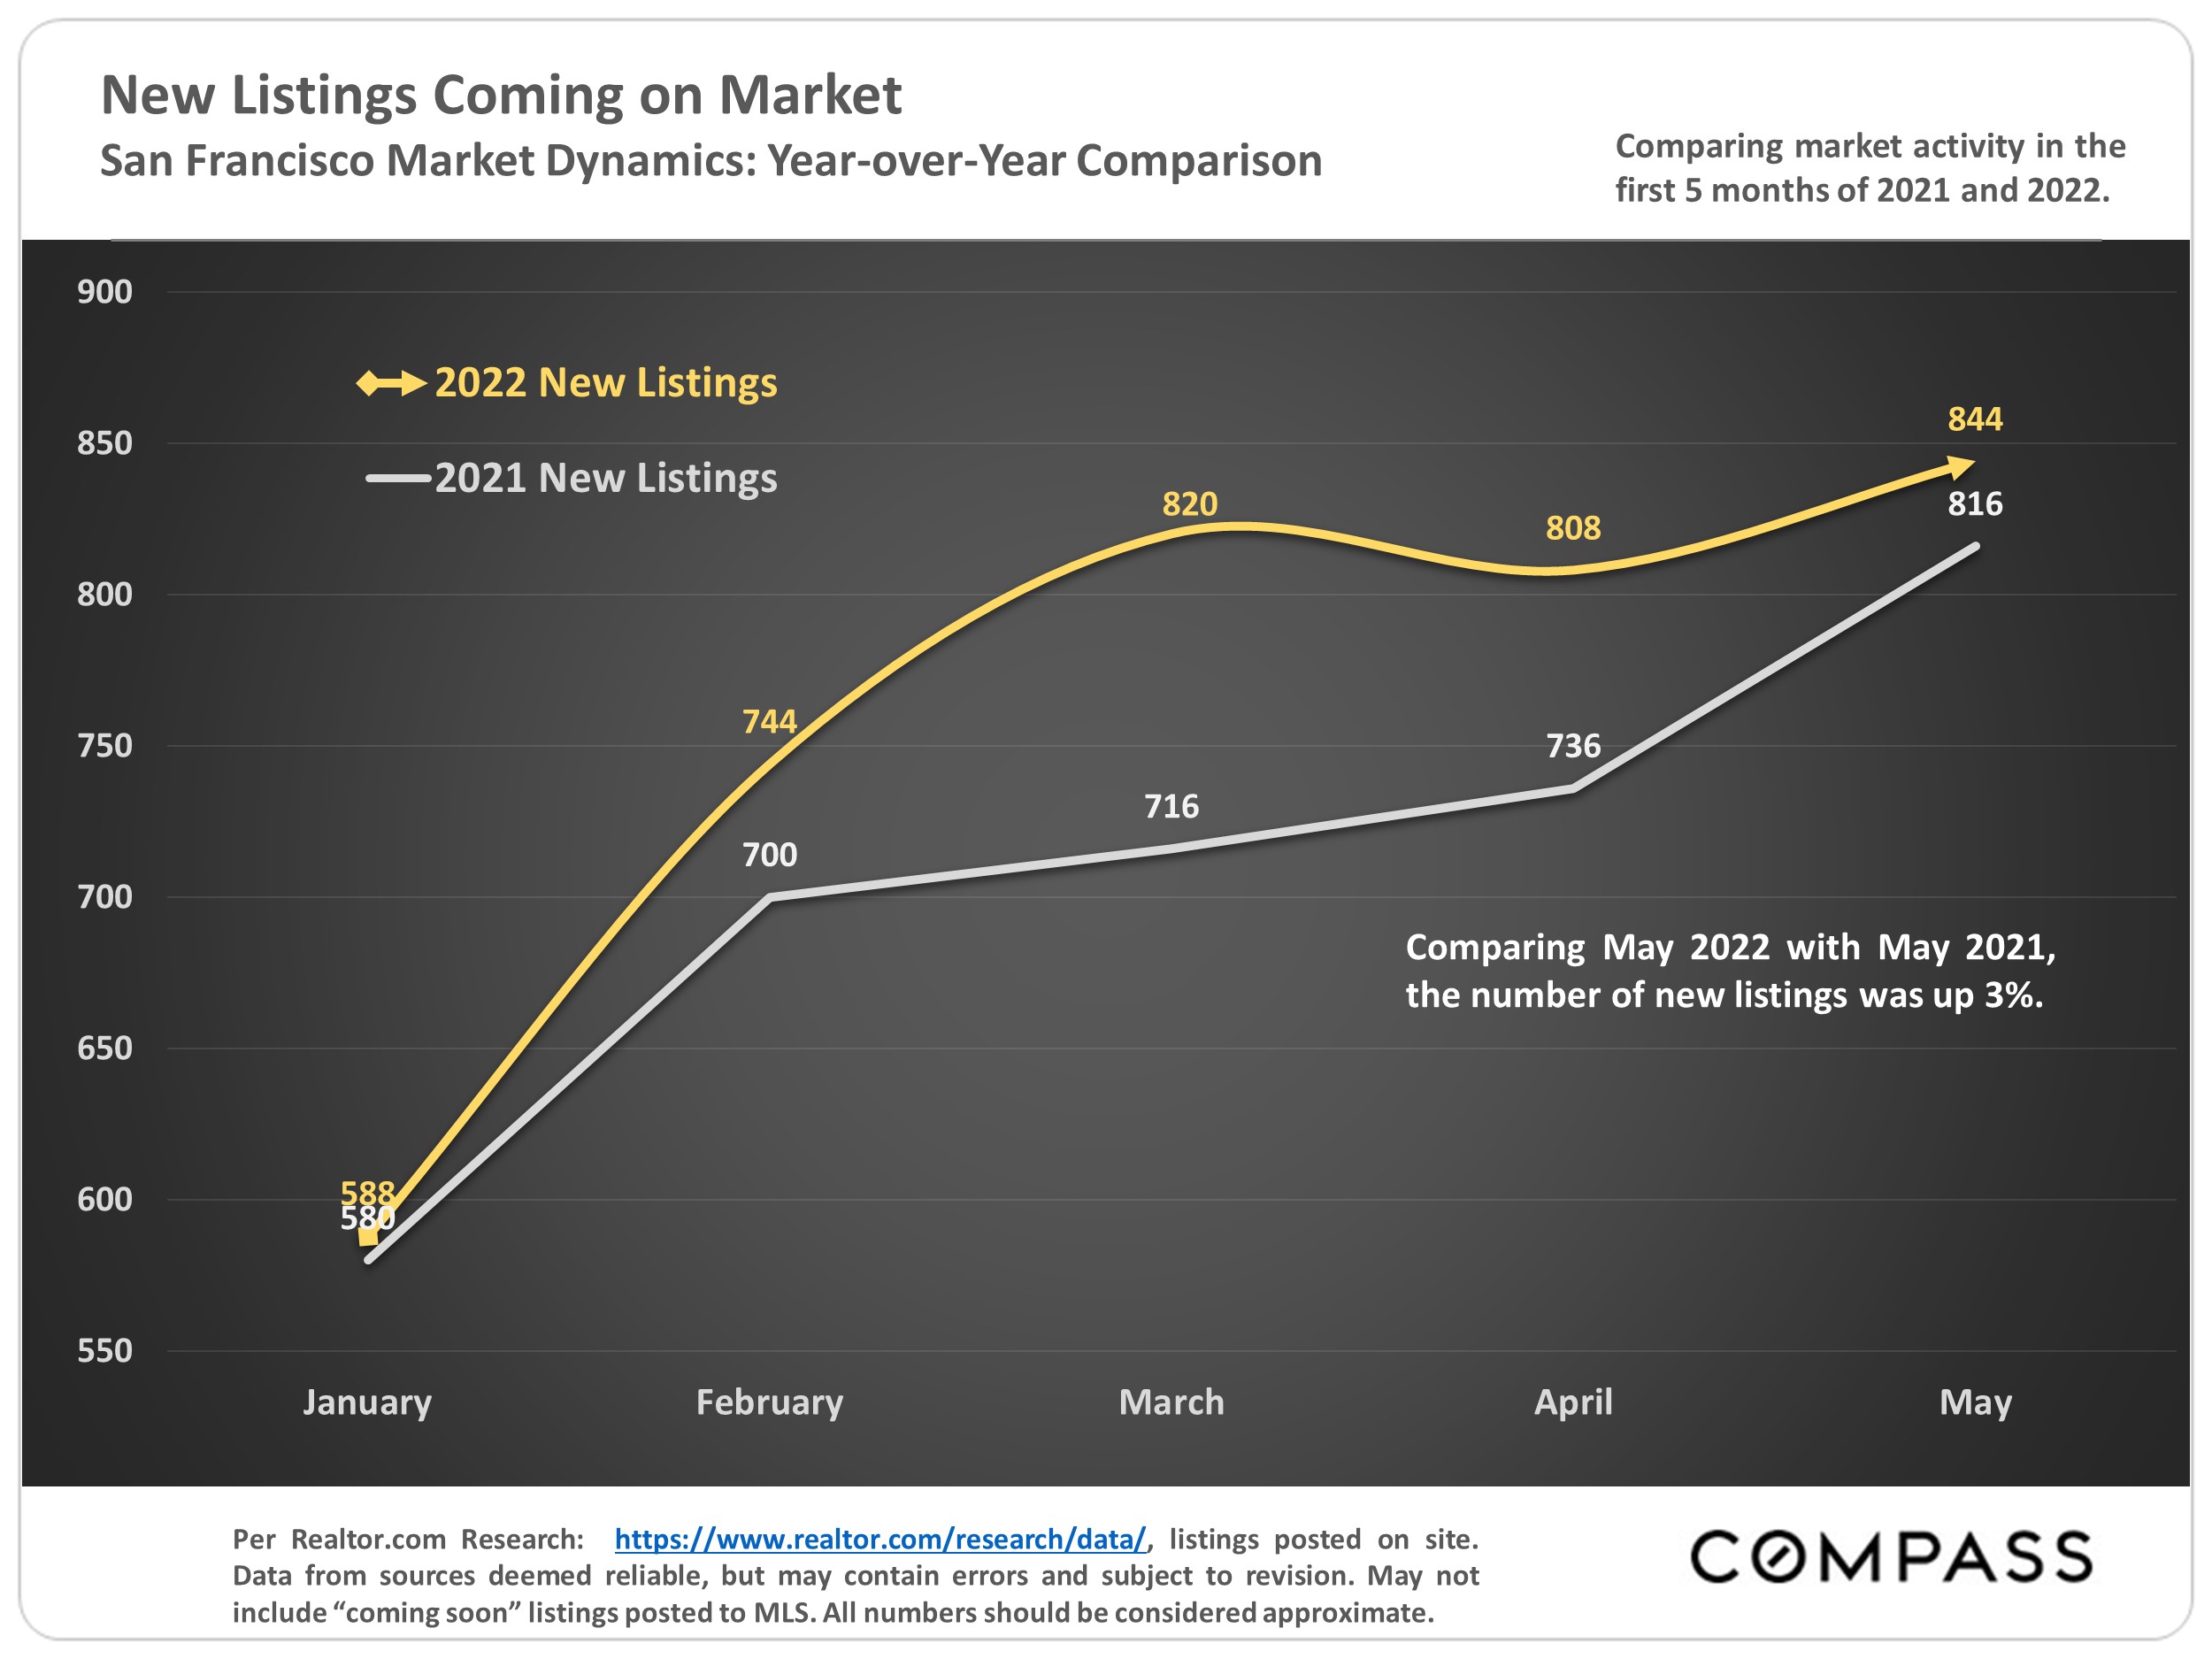
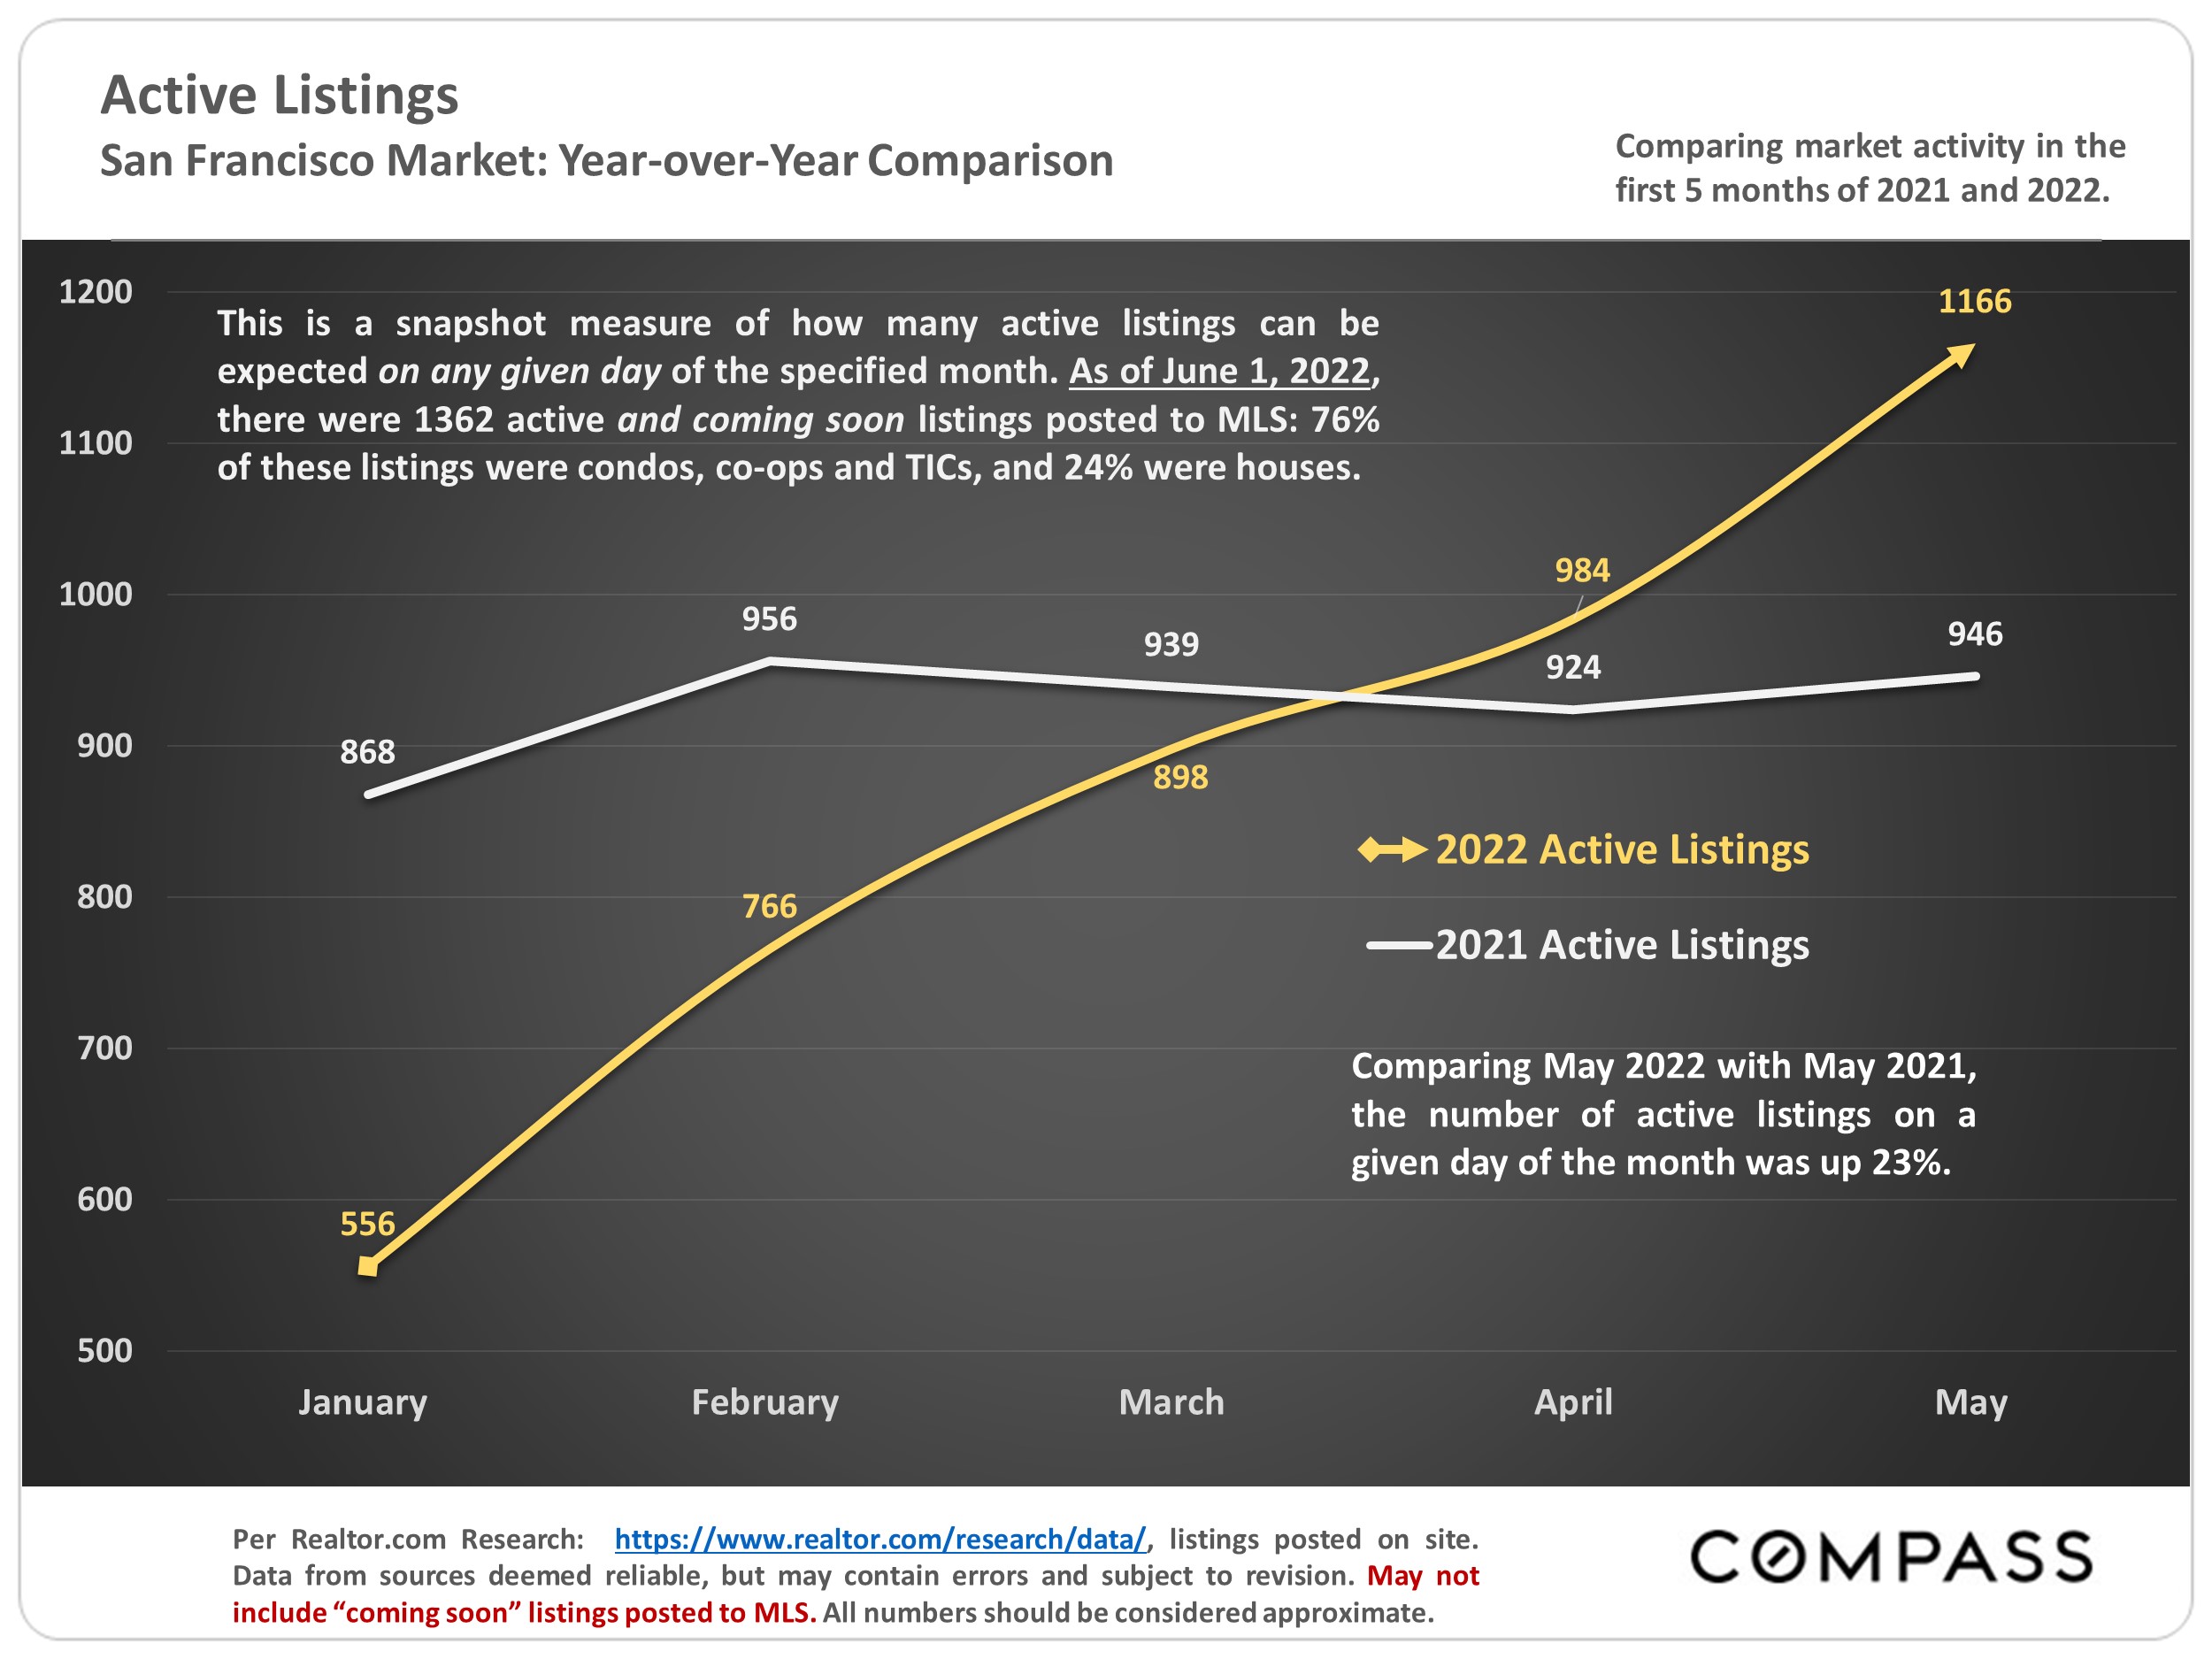
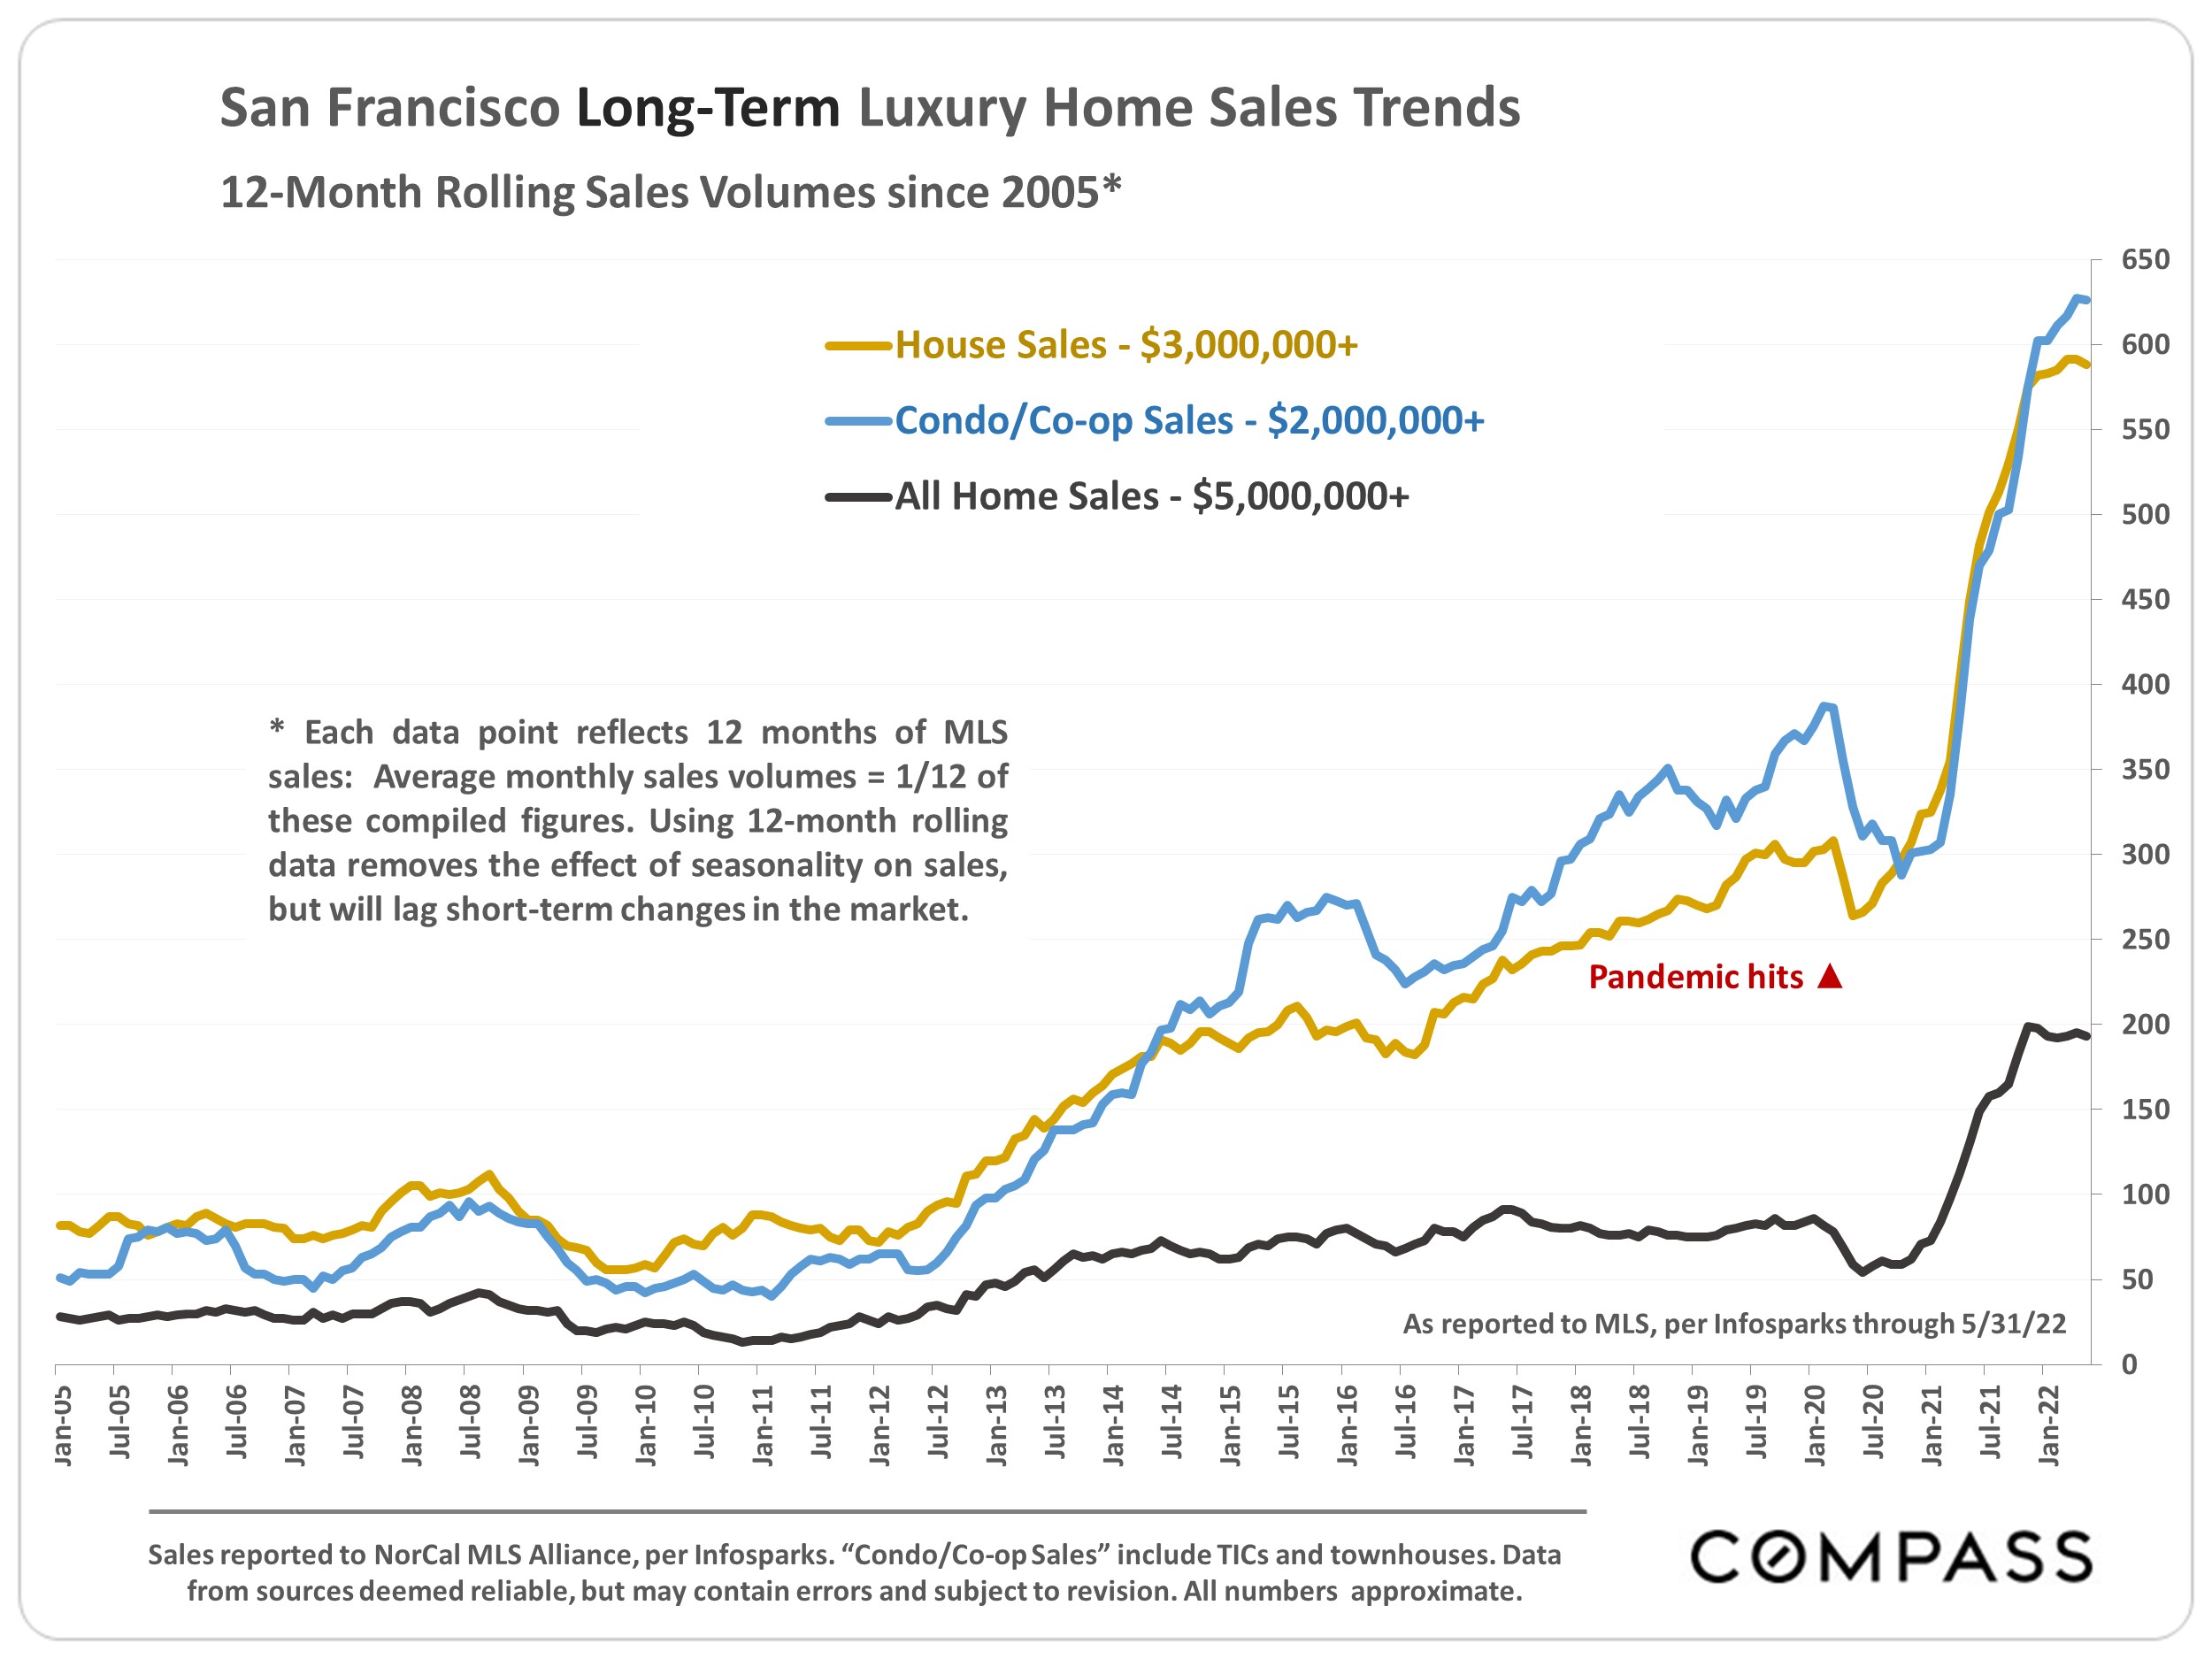
This report will look at recent, year-over-year changes in inventory and demand, while also reviewing longer-term trends for more context.
Want to learn more about Bay Area market trends?
Let’s connect! With relationships and networks across the city, there are a variety of ways I can help you make informed real estate decisions. Call, email, or text – I’m here to help.
Contact