September 25, 2024
Compass National Real Estate Insights - September 2024
By Compass
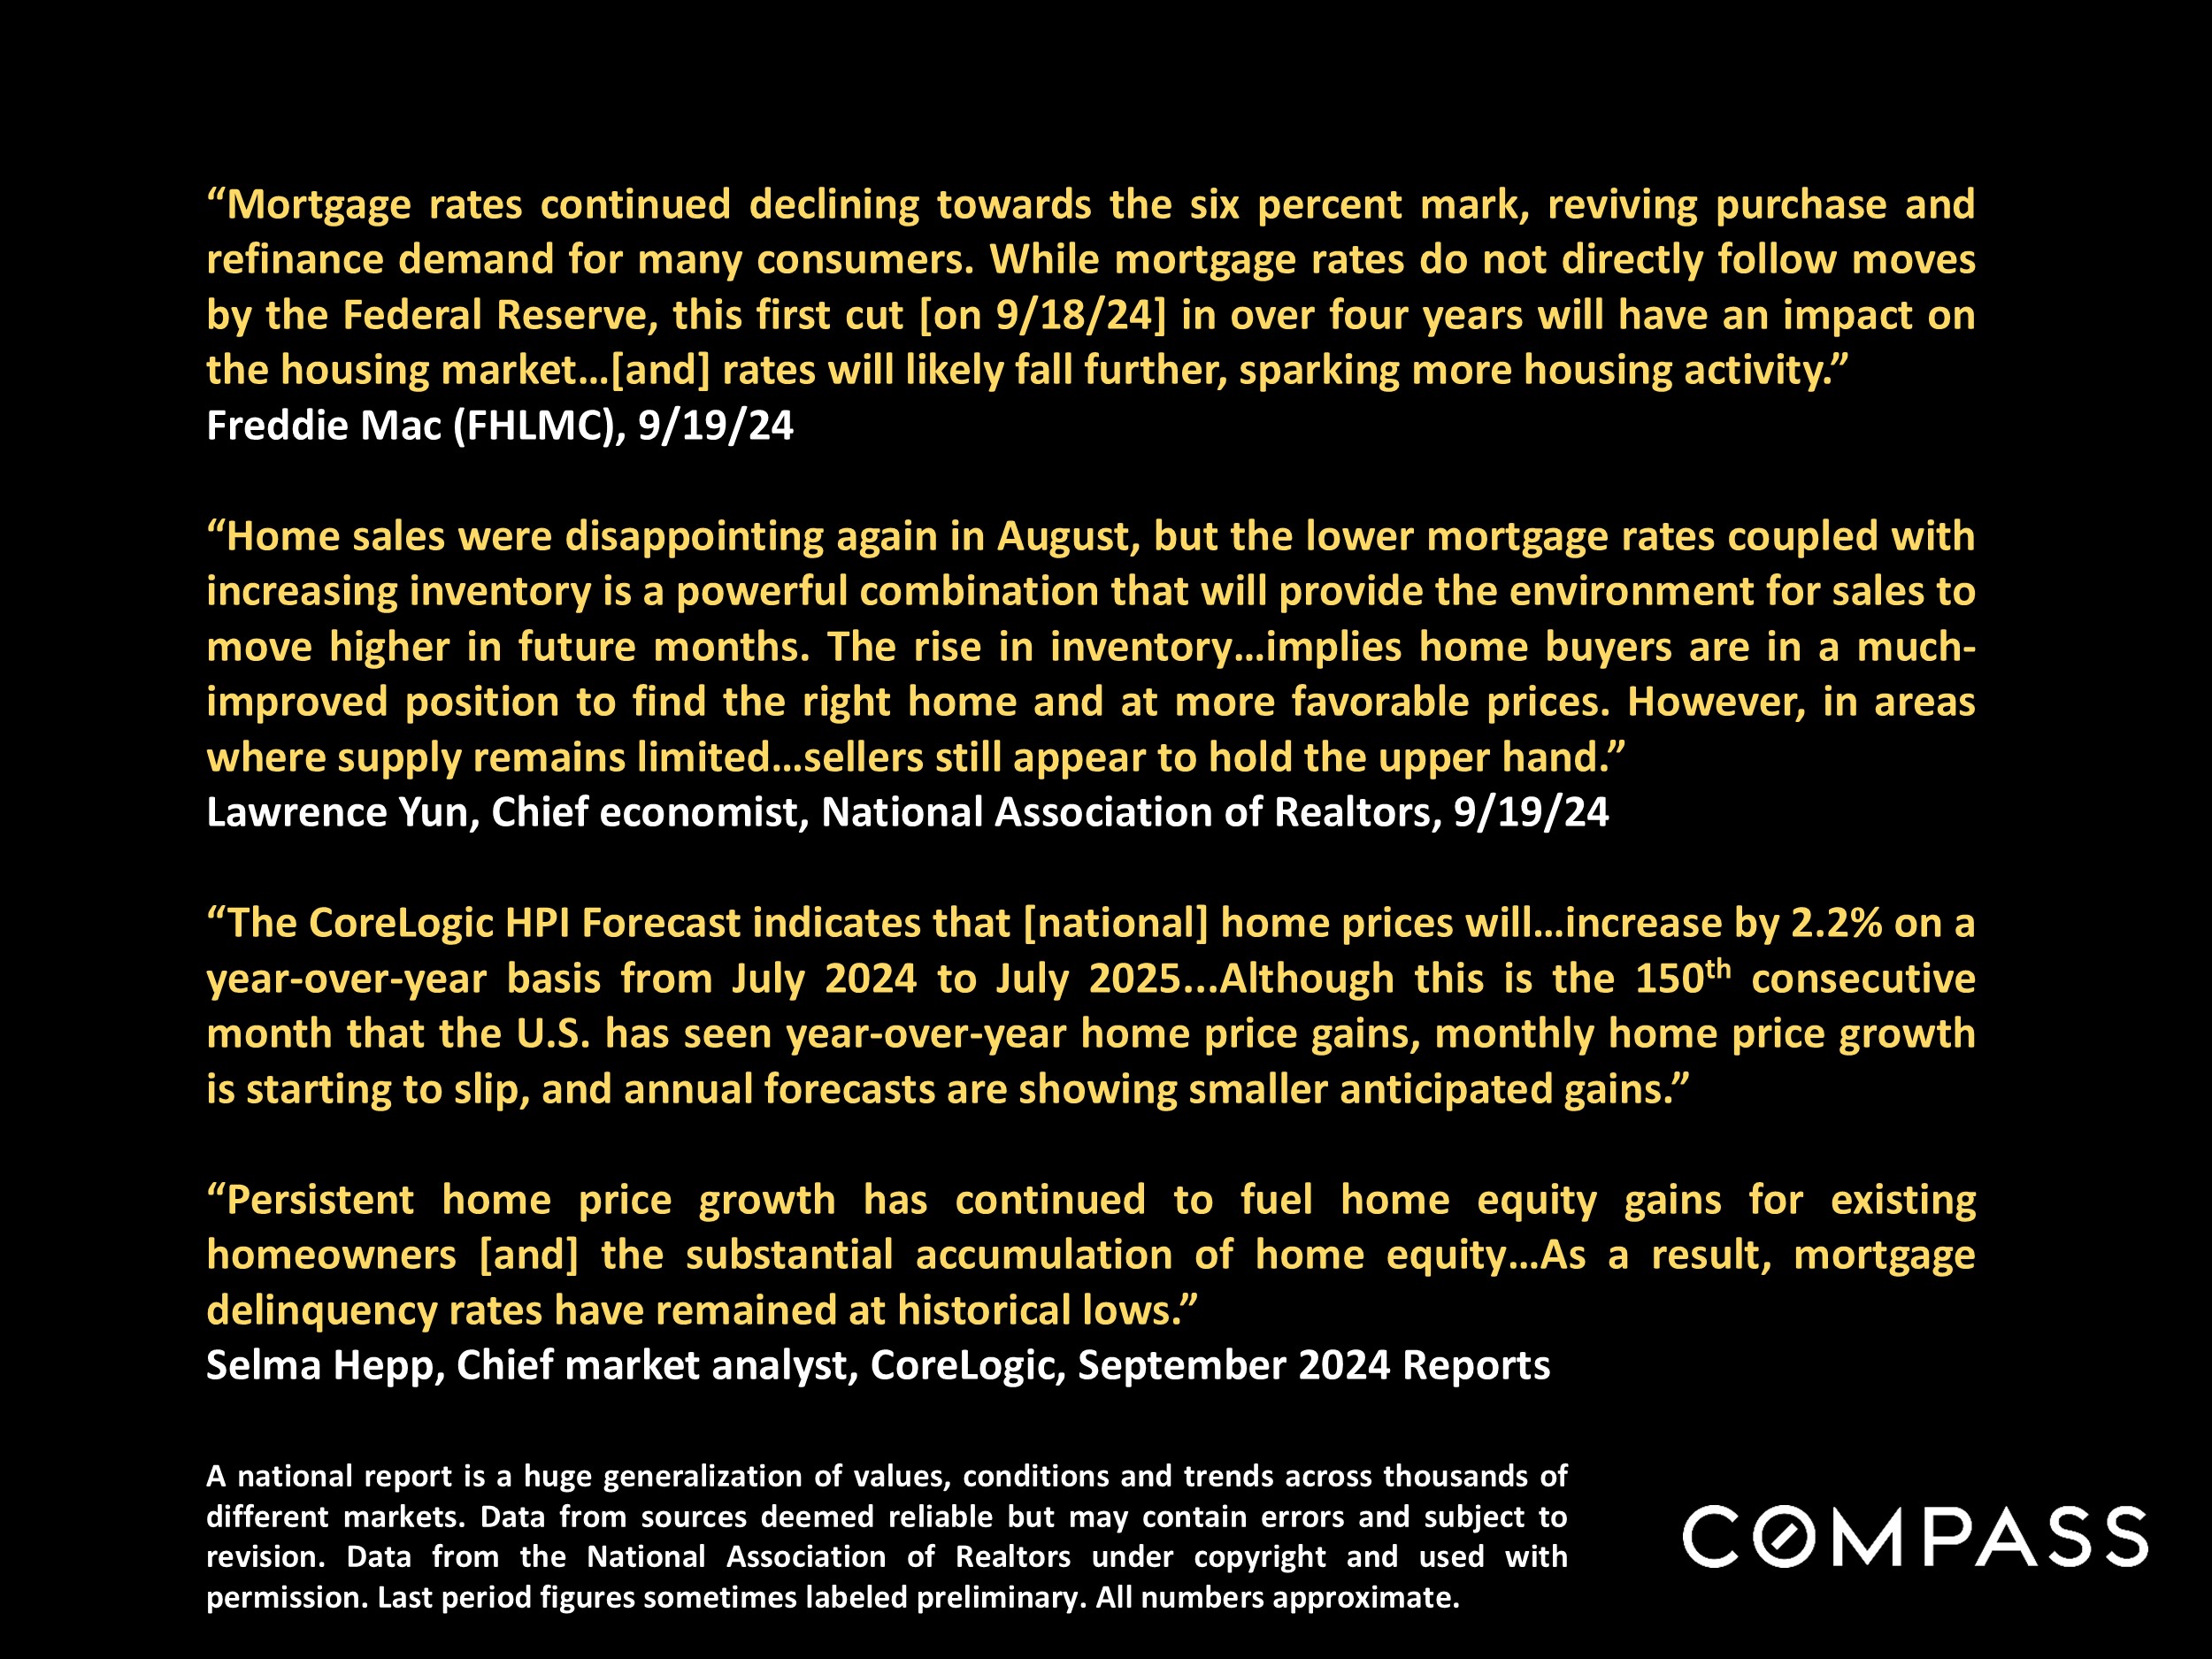
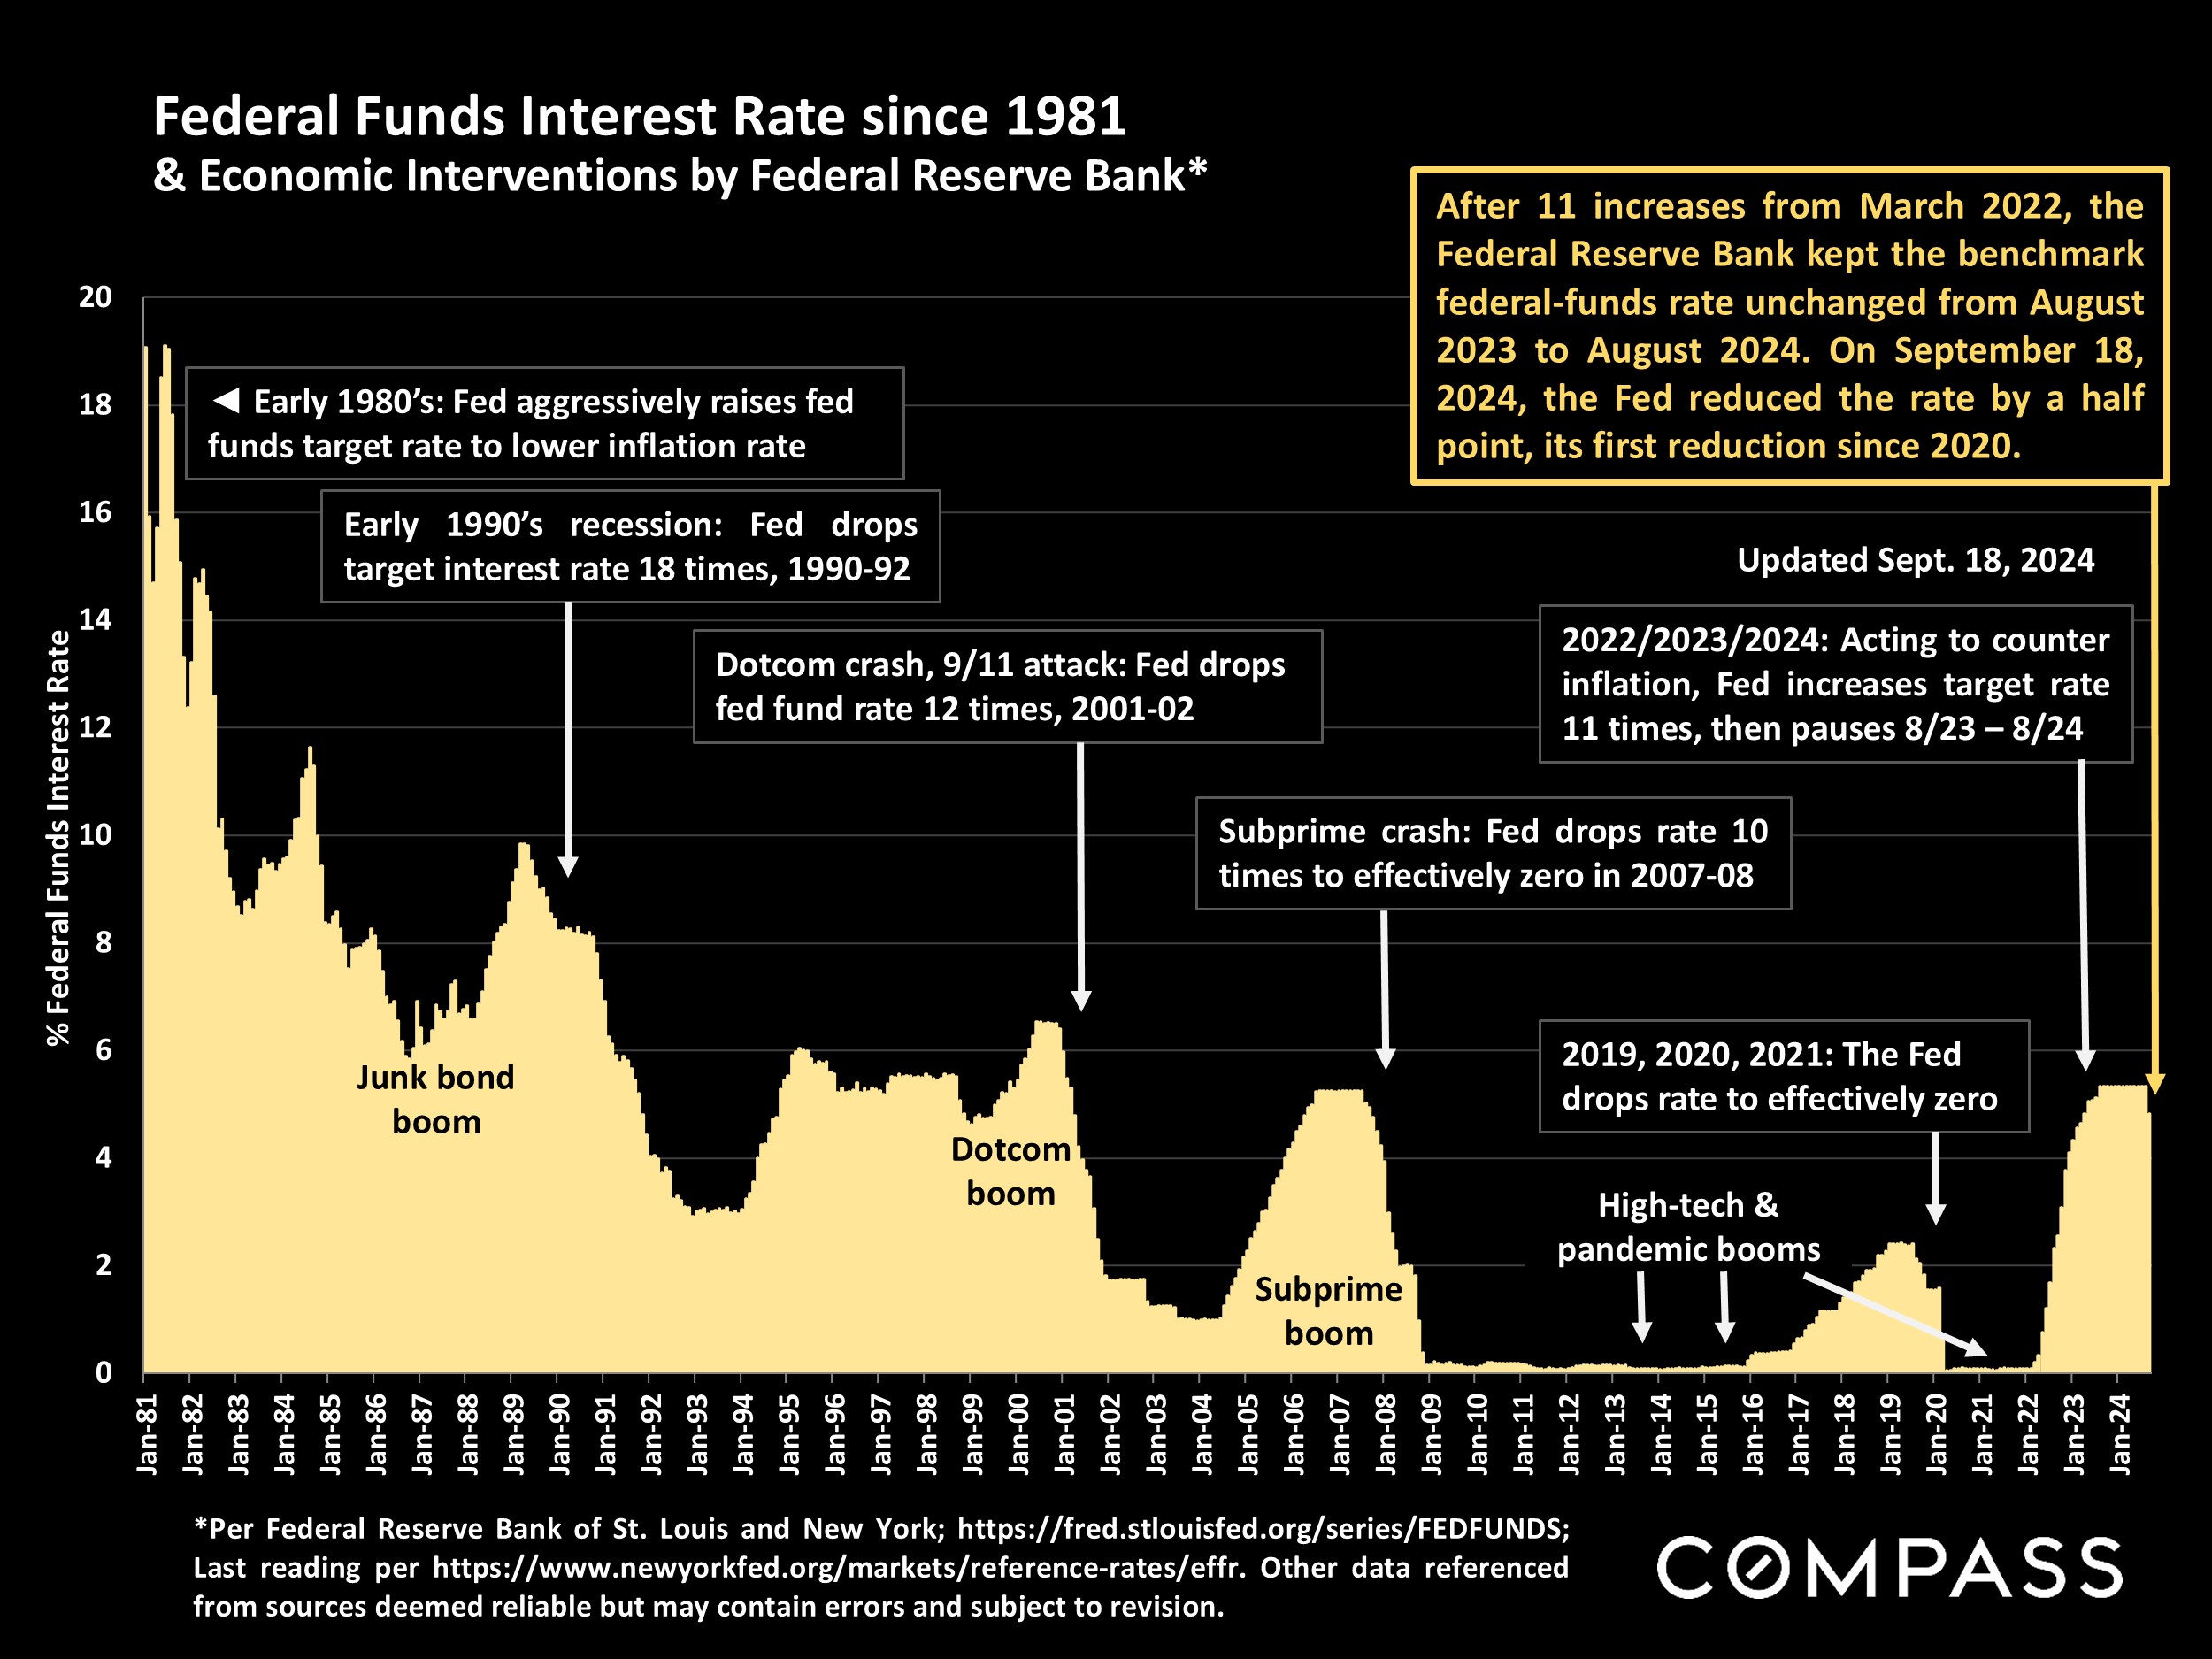
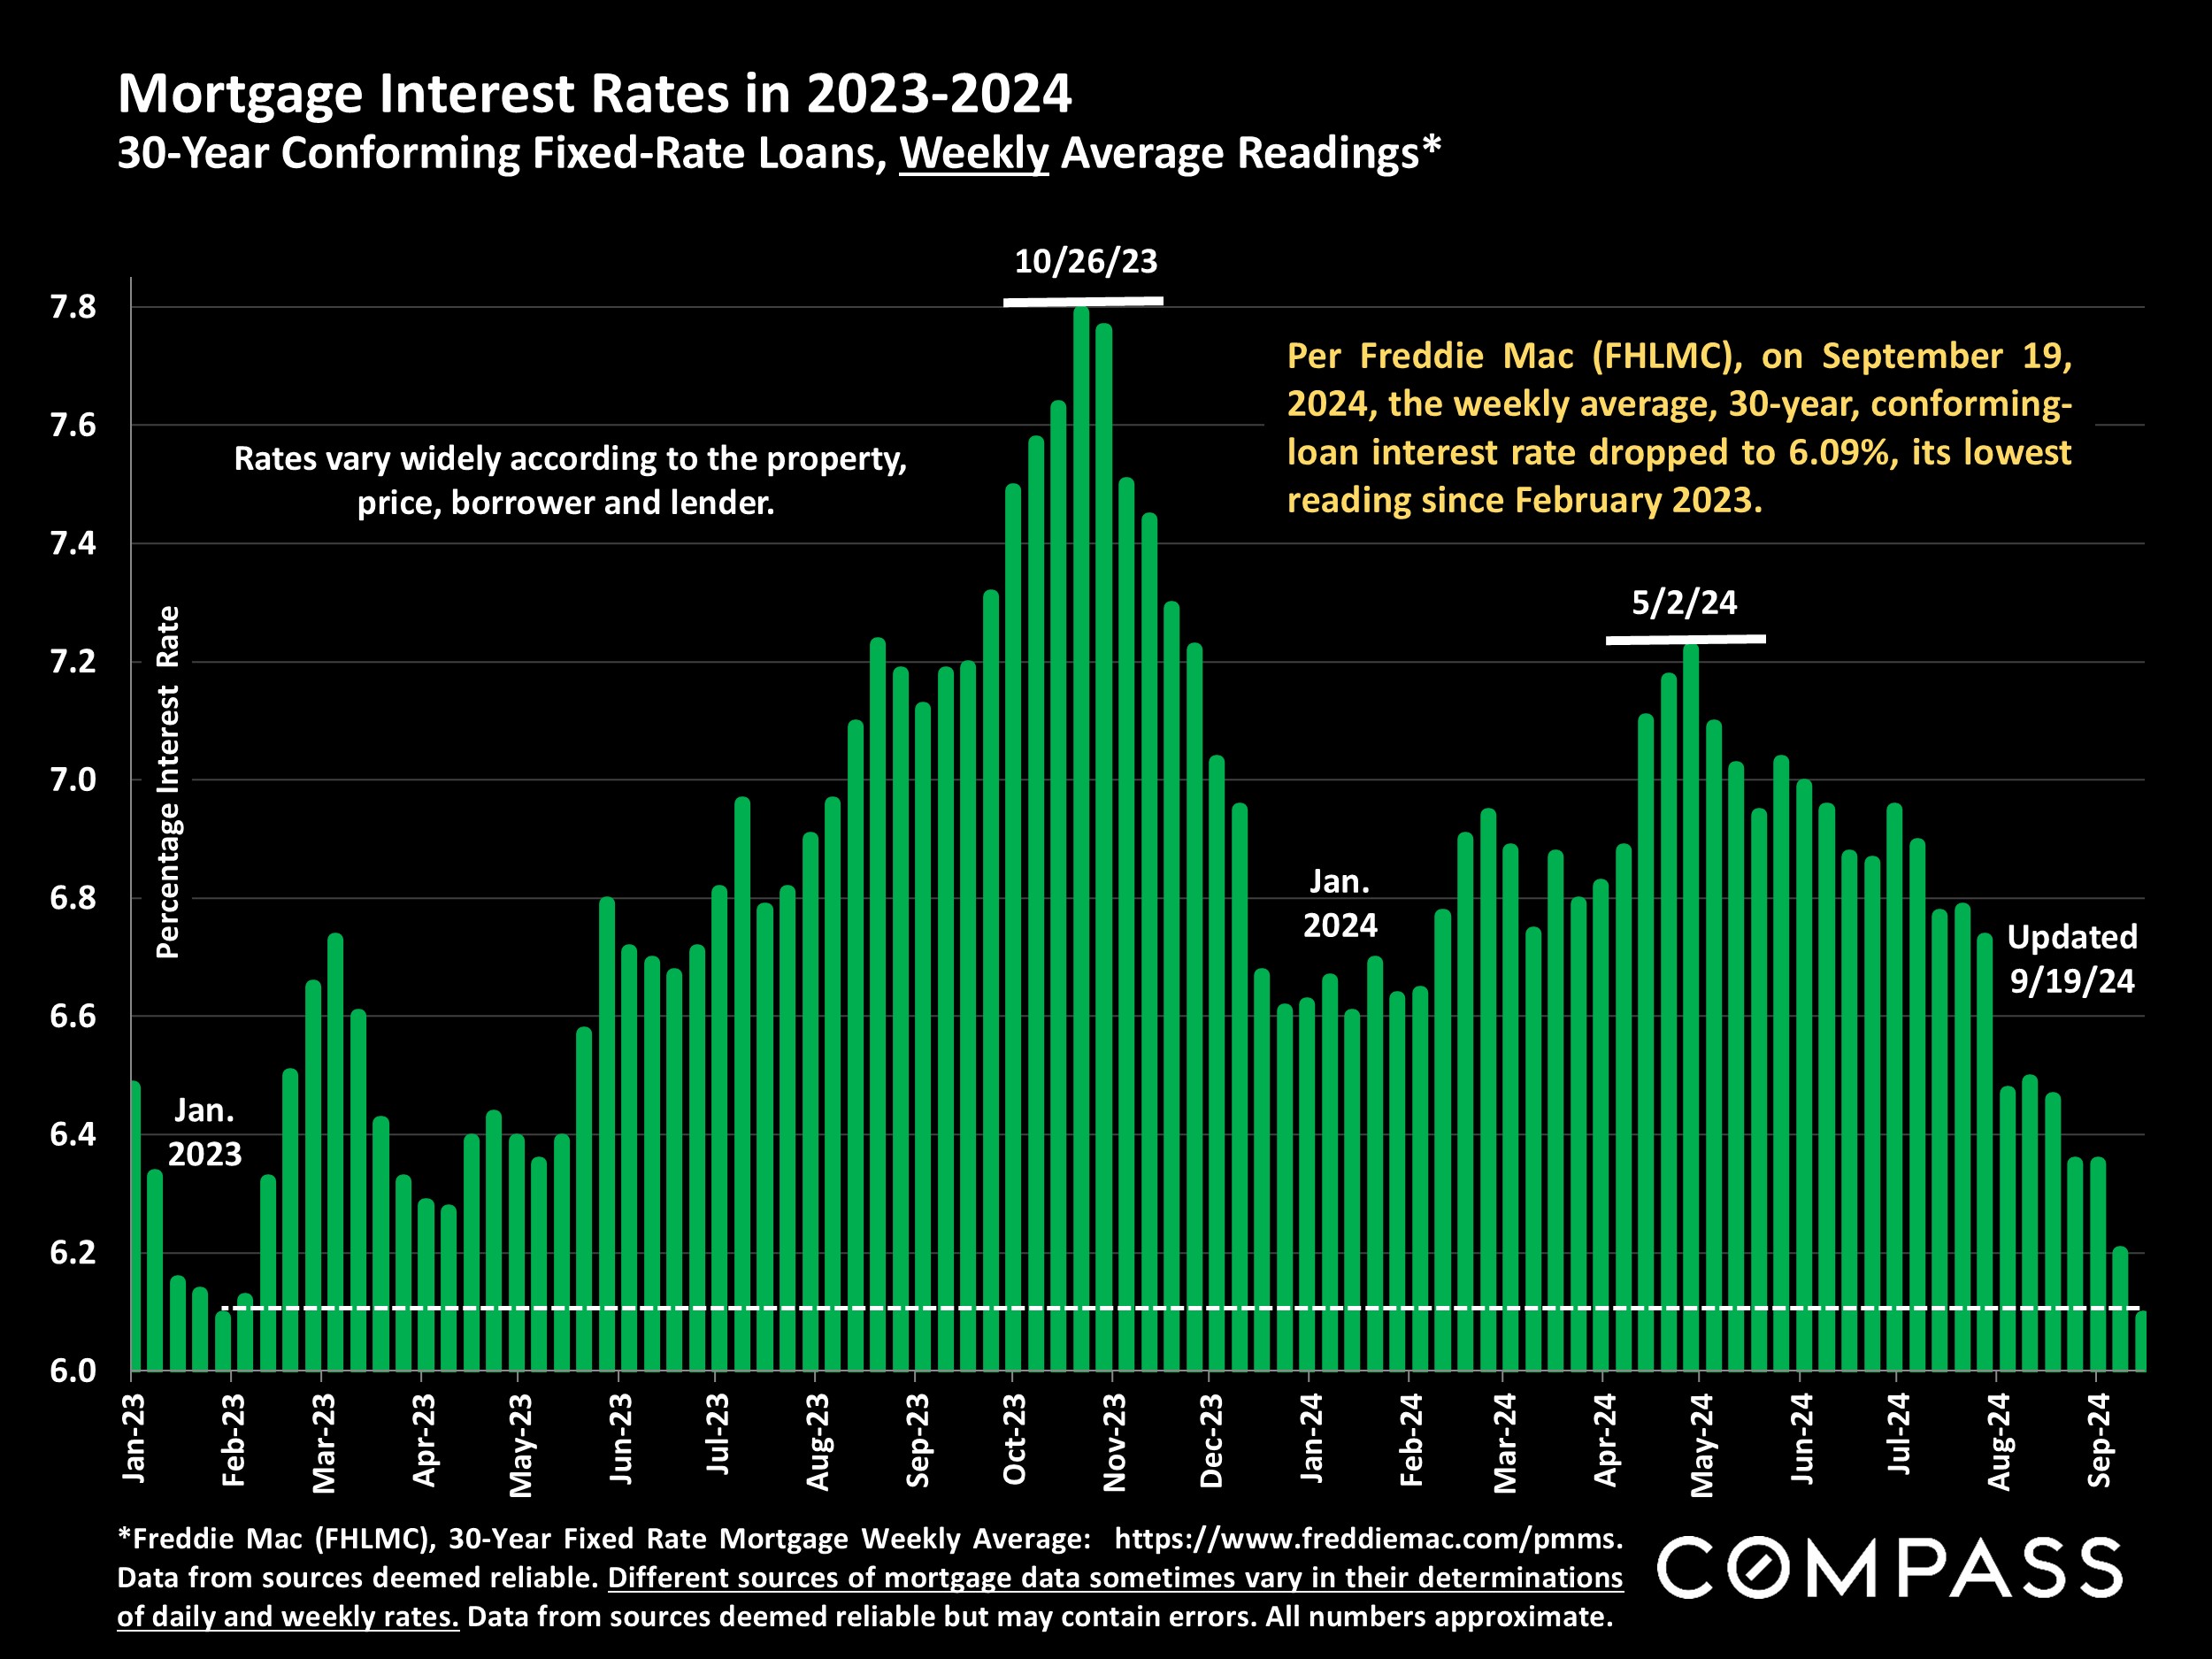
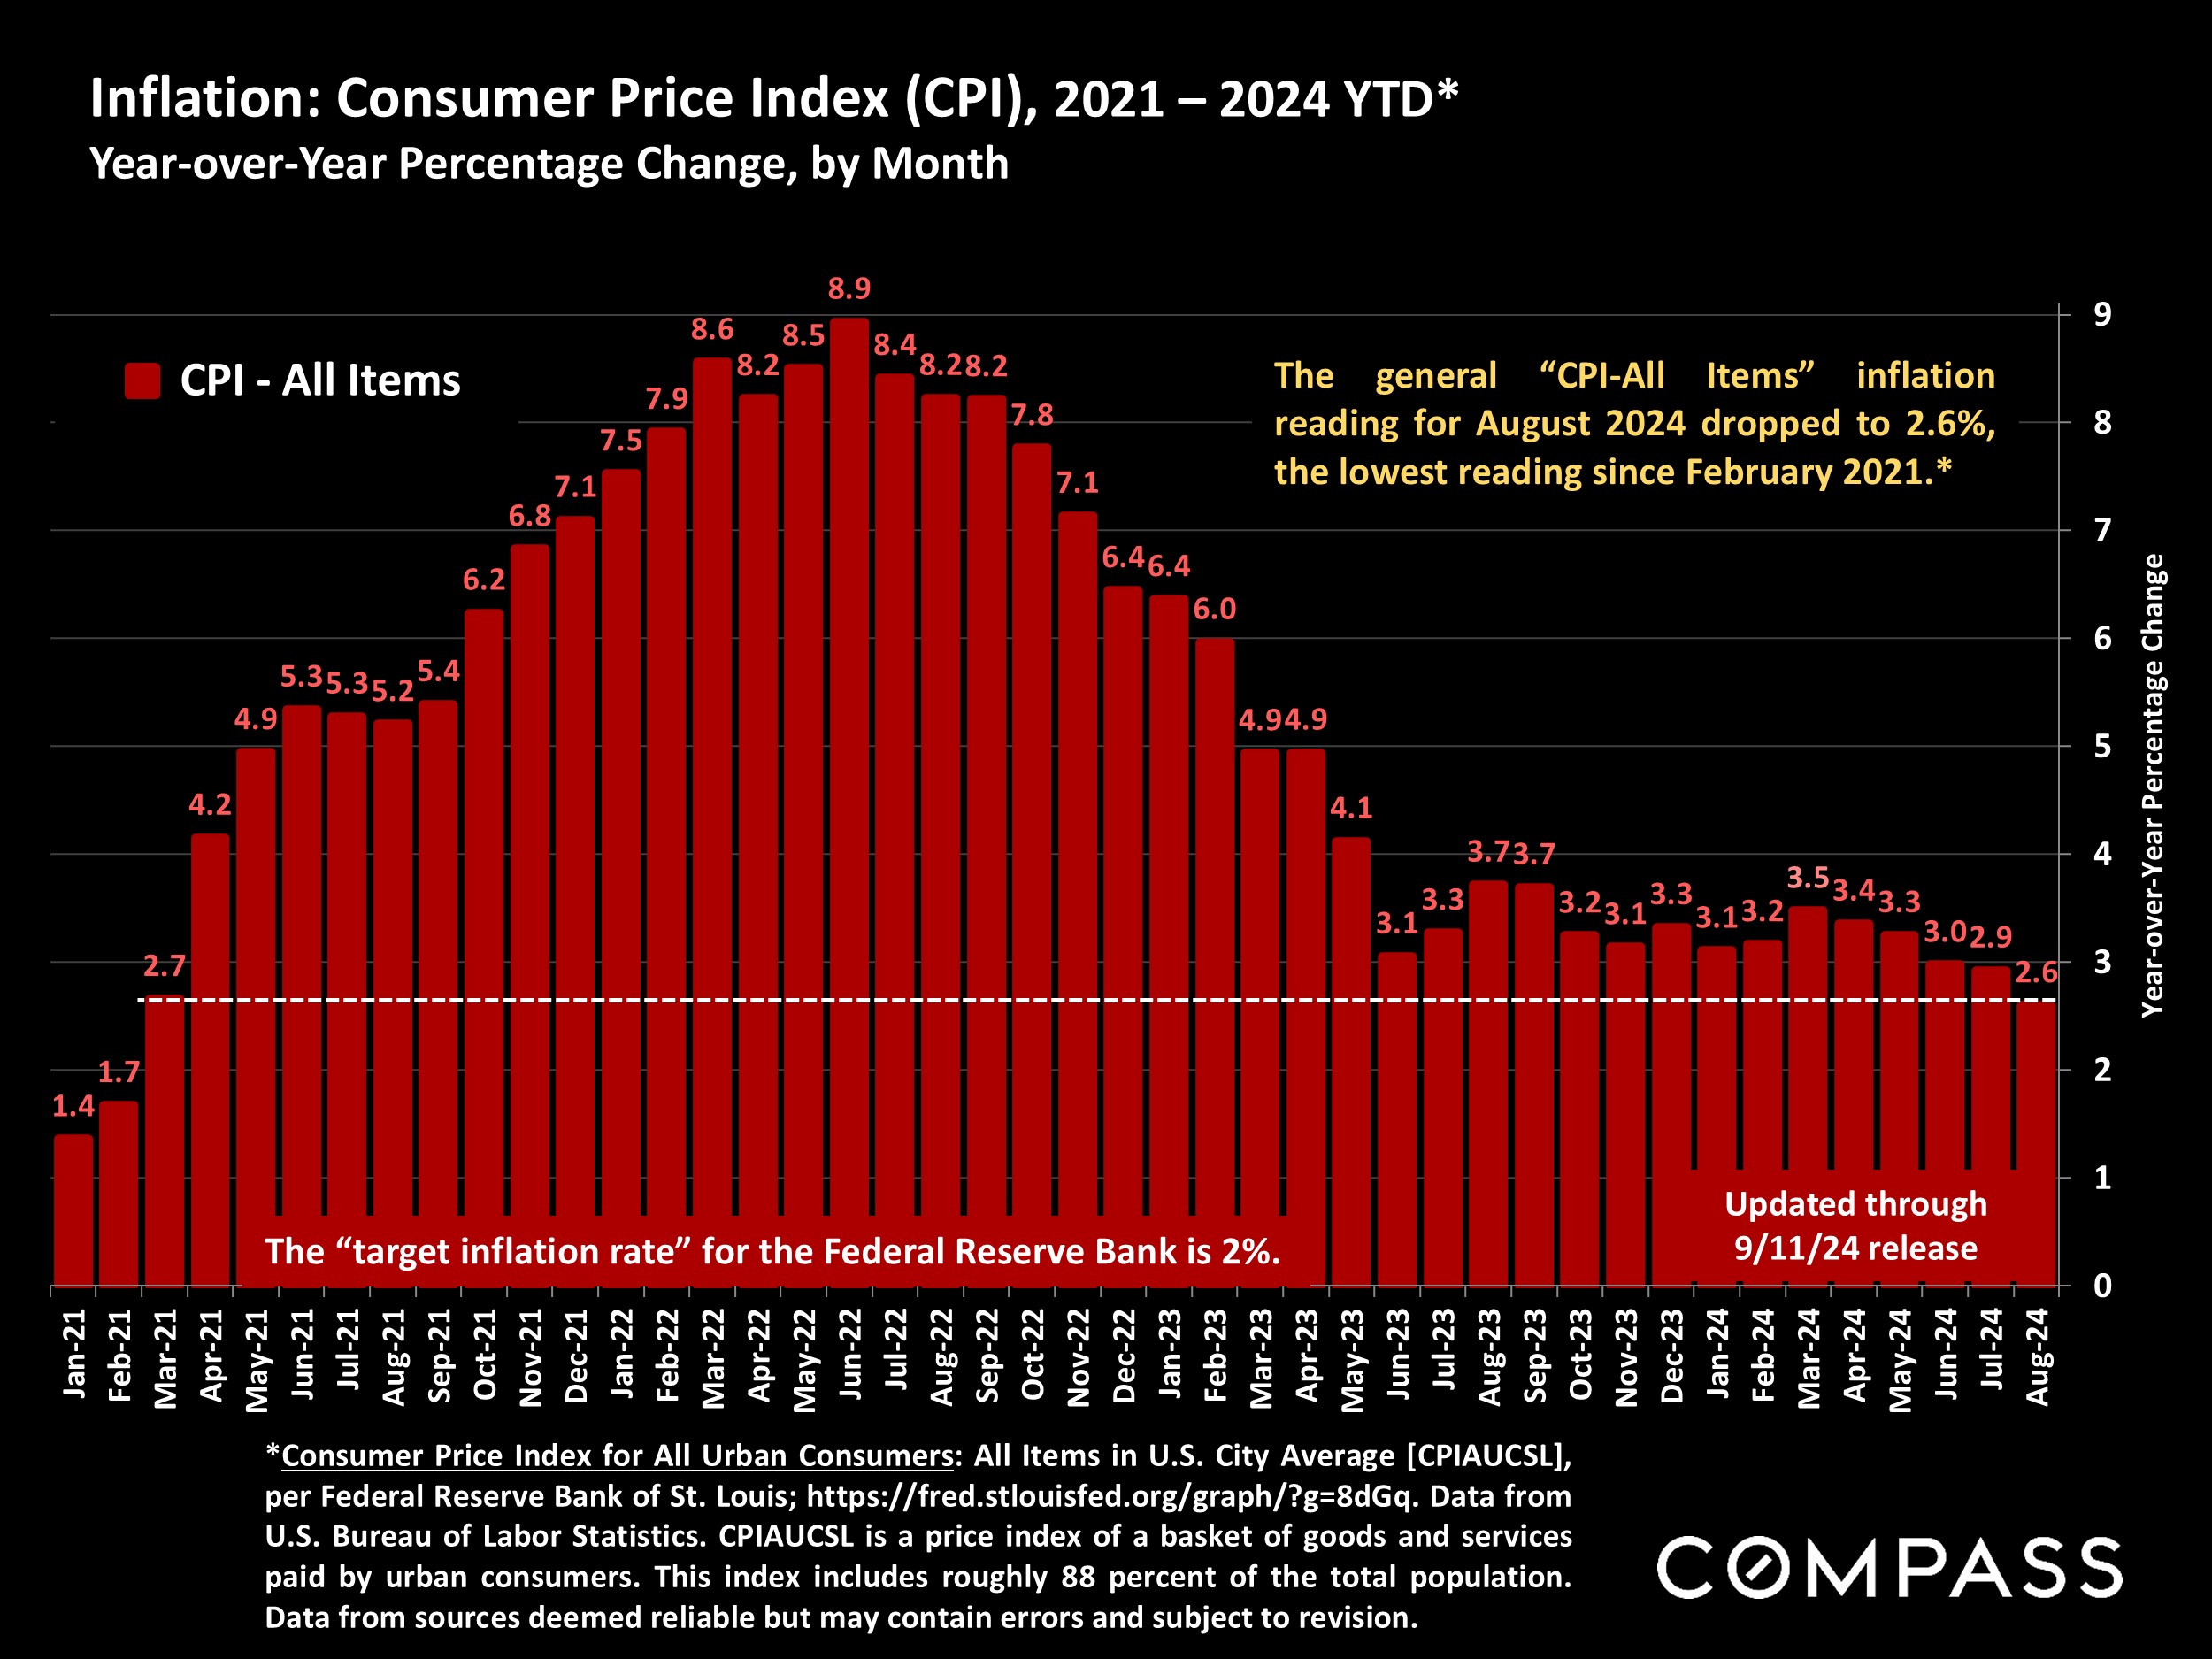
On September 18th, the Federal Reserve Bank dropped its benchmark rate for the first time since 2020, and many analysts expect further cuts before the end of the year. Inflation has fallen to its lowest reading since early 2021, and mortgage rates are now the lowest since February 2023. Stock markets have been volatile since mid-July, but the S&P 500 & Dow hit new highs on September 19th.
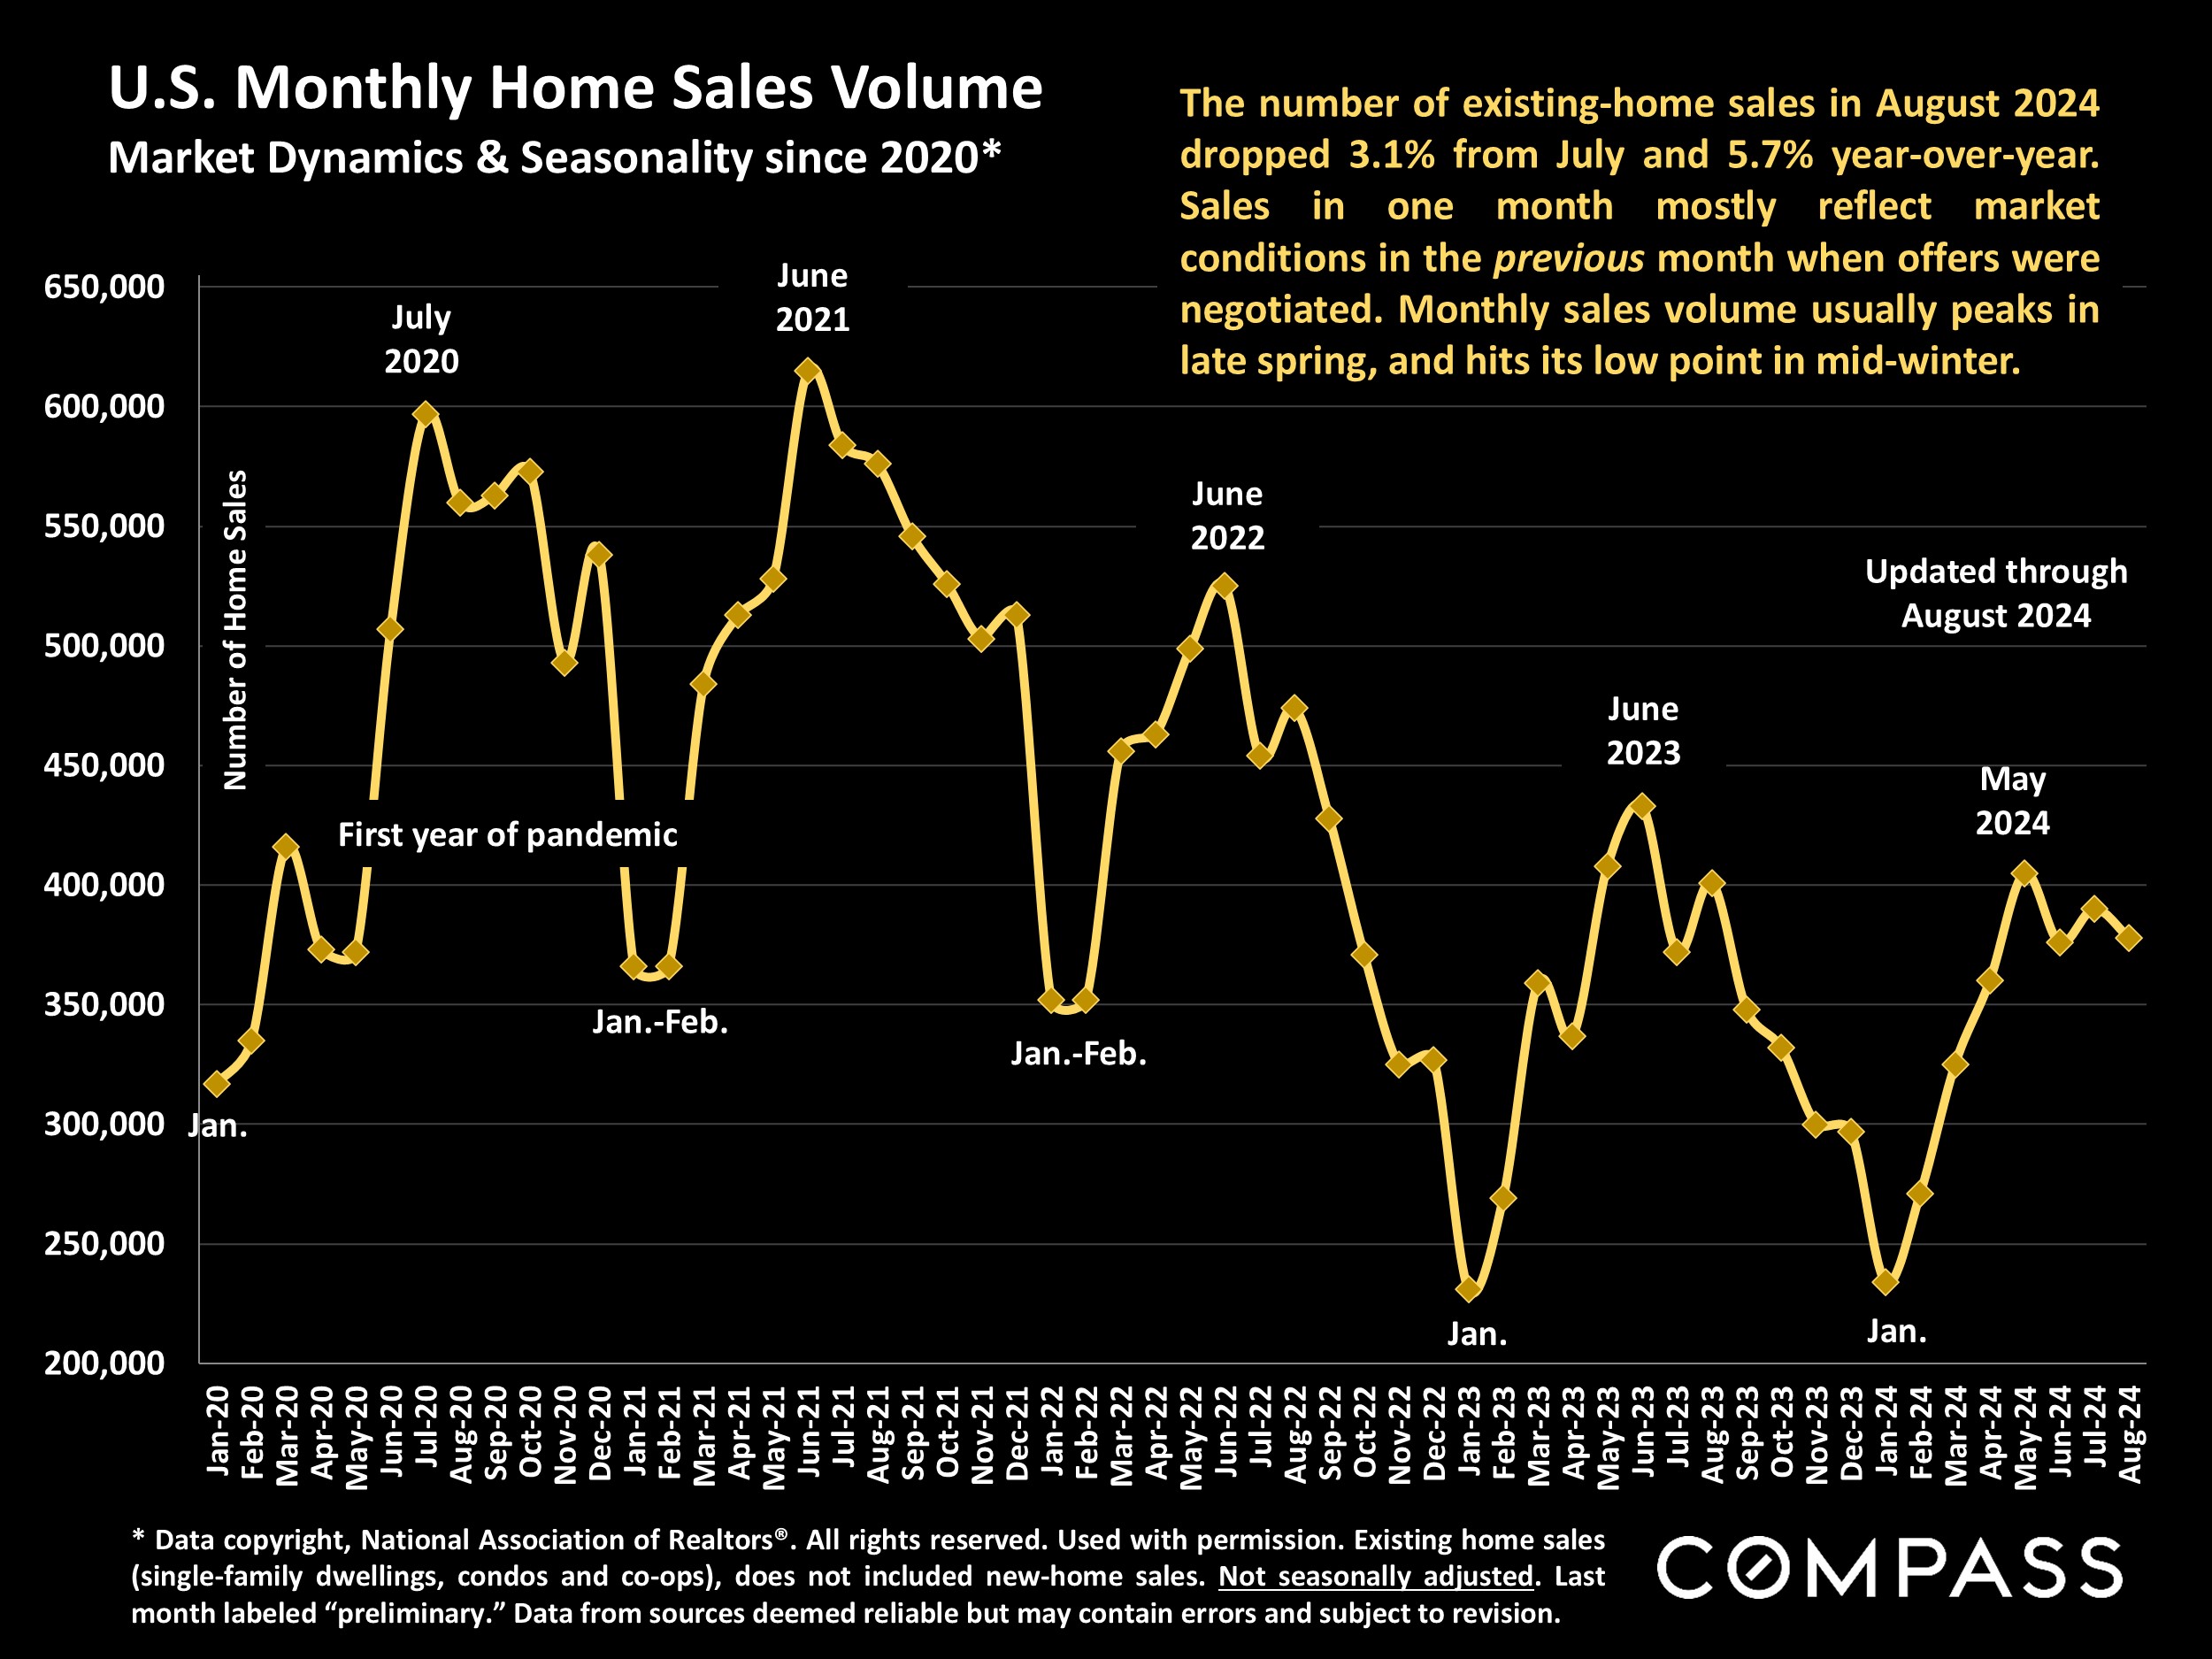
- National sales activity was relatively weak in August 2024: Existing home sales declined 3.1% from July and 5.7% from August 2023. But sales in August mostly reflect offers accepted in July before many of the positive economic developments mentioned above.
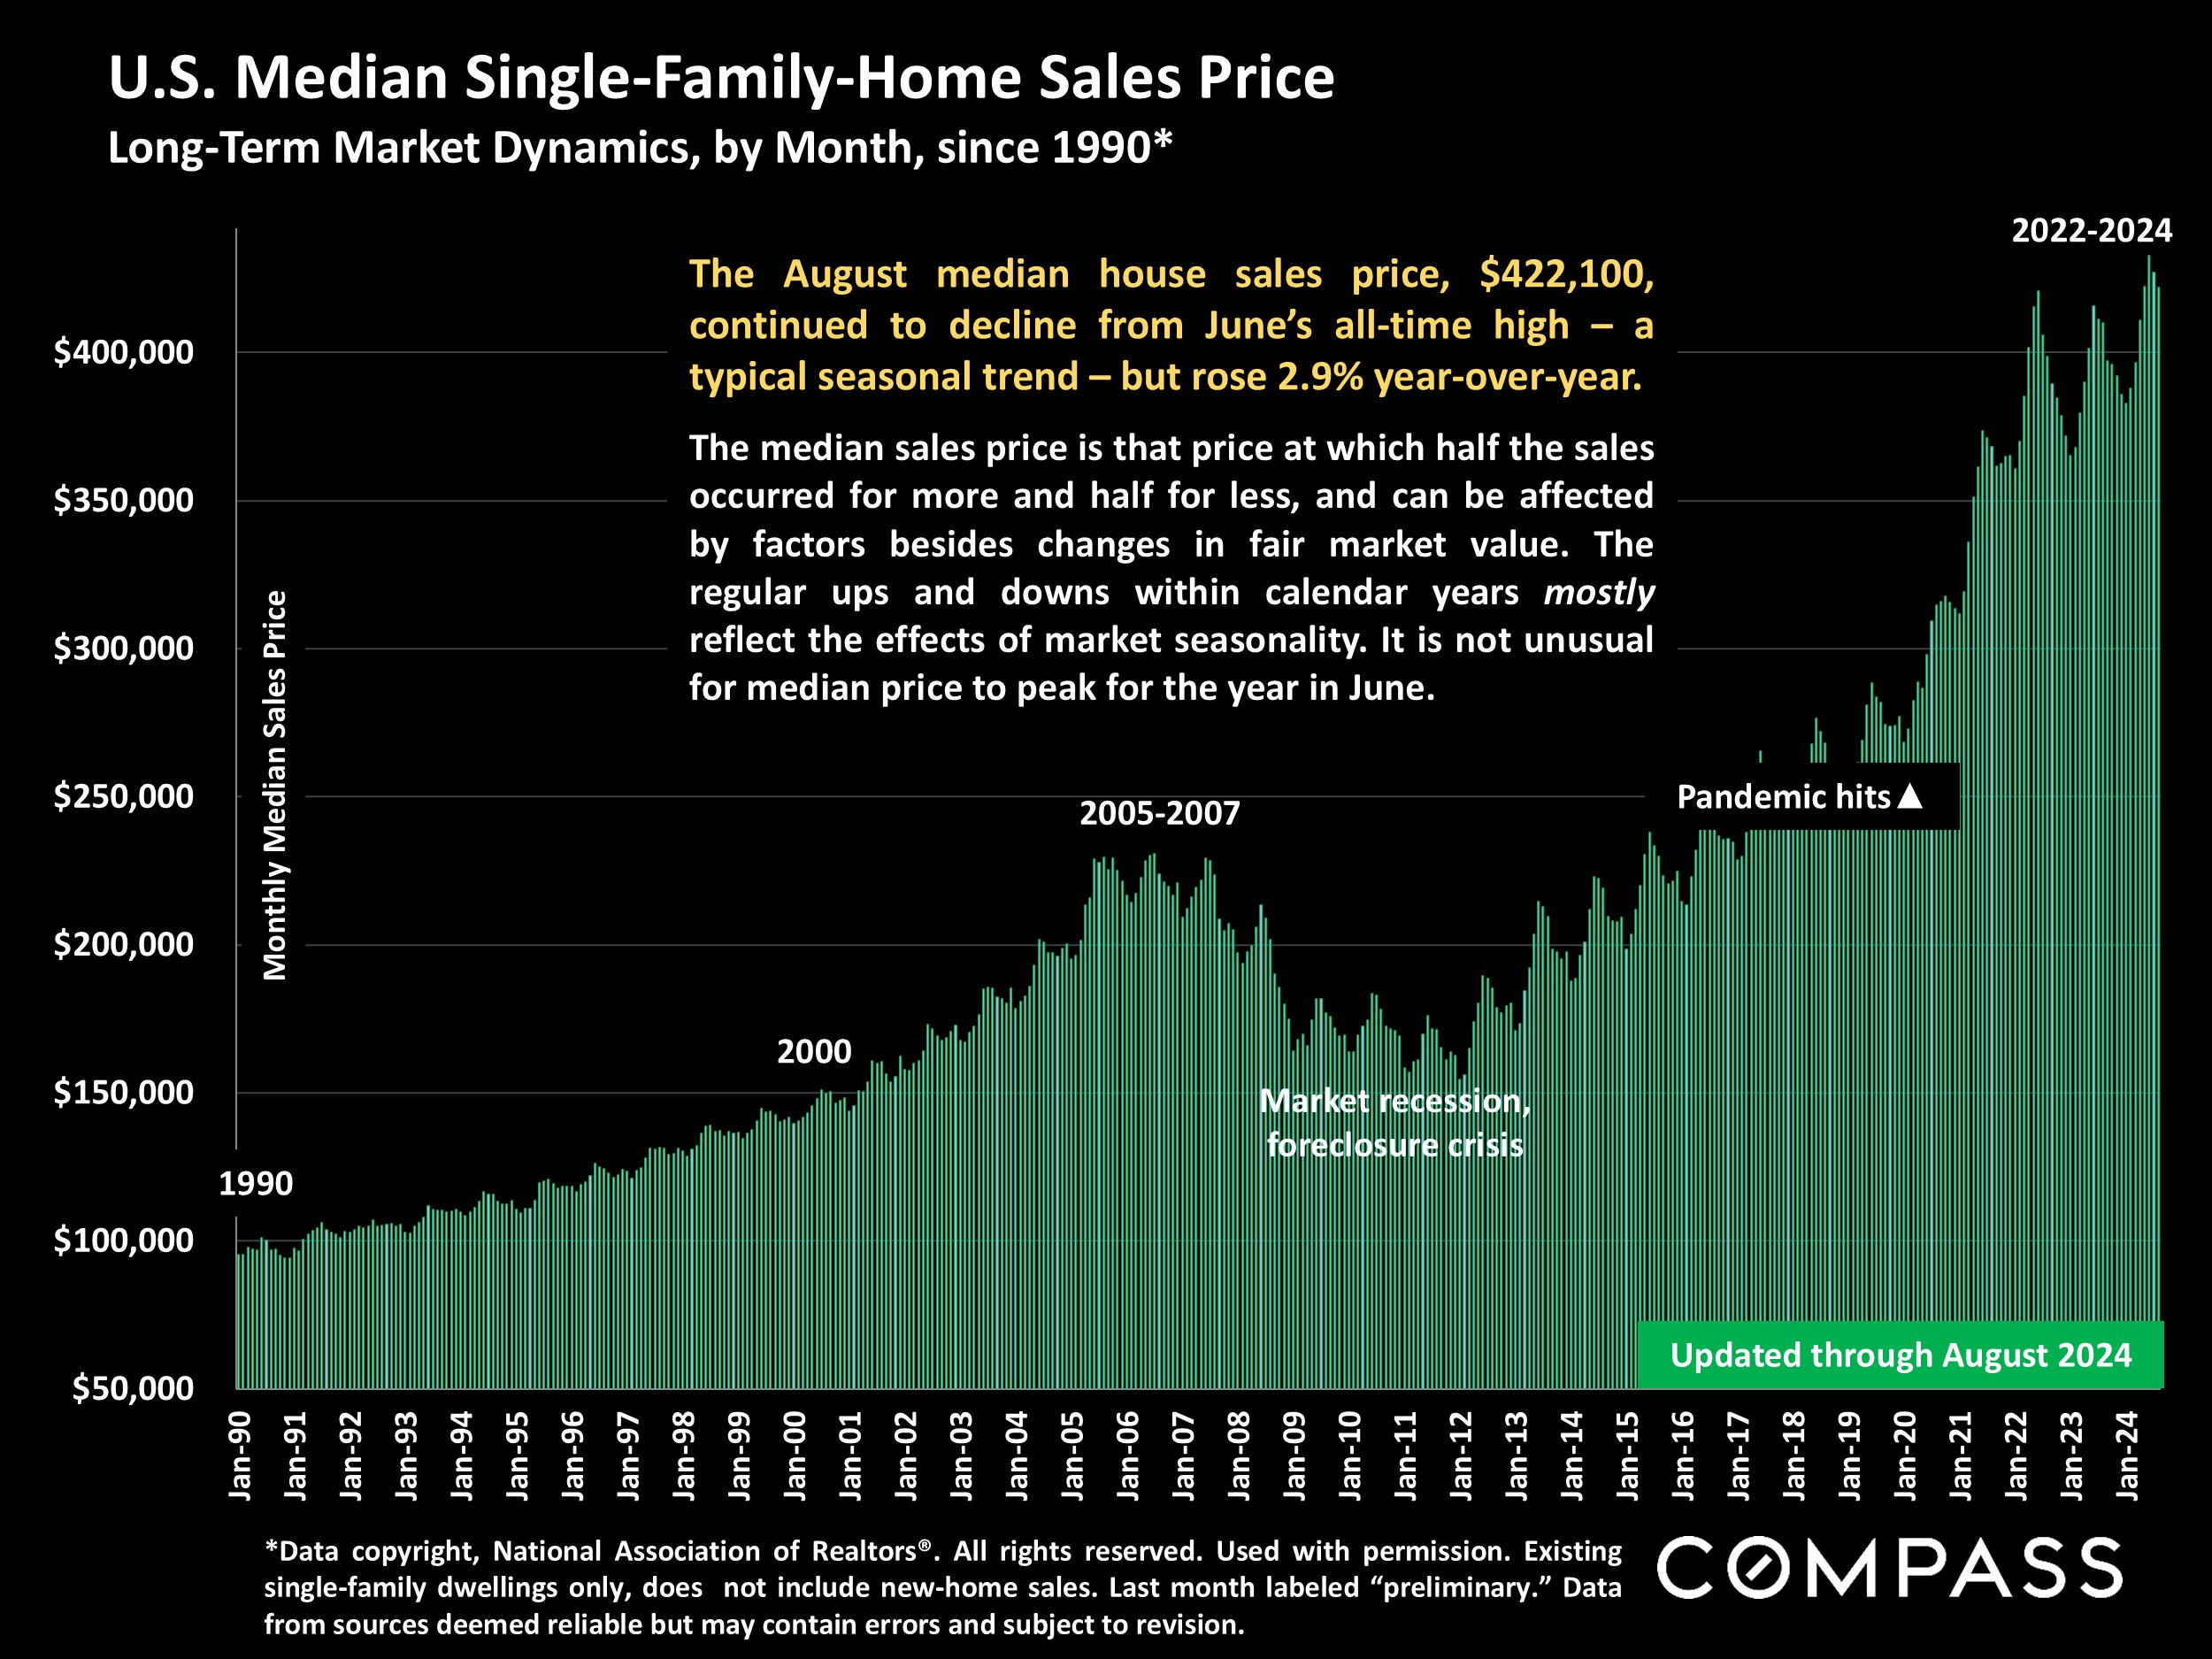
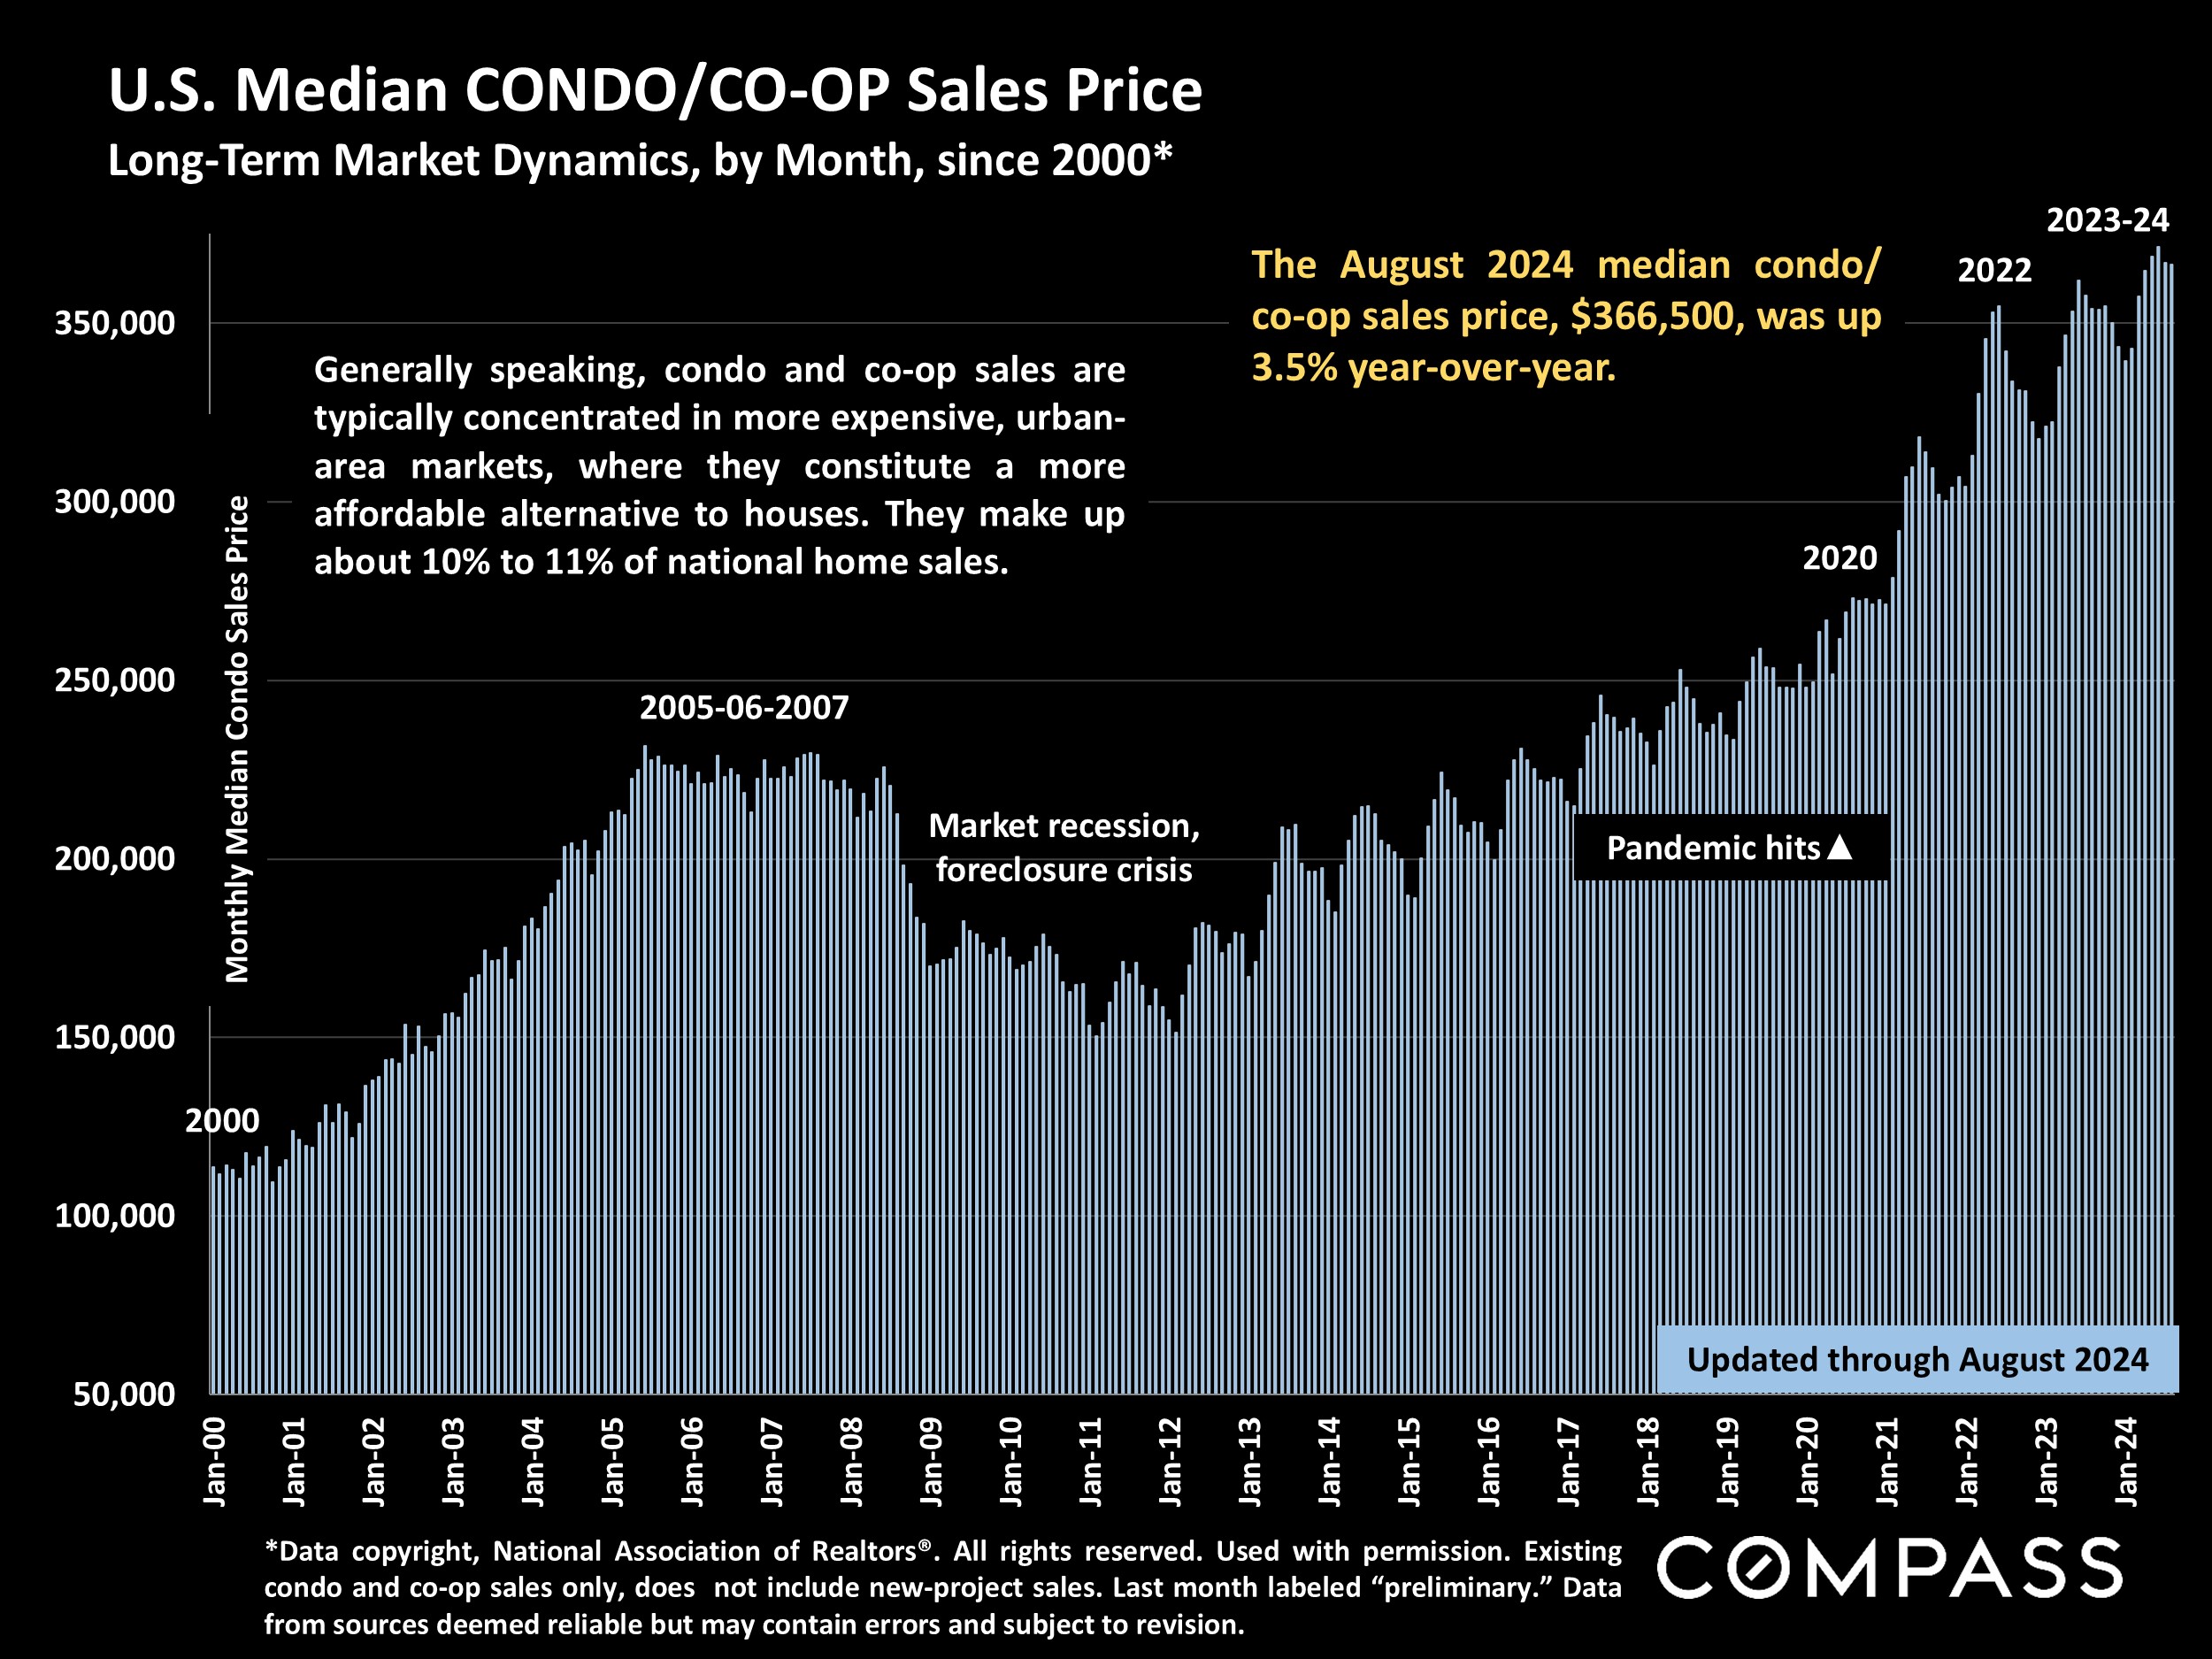
- Year over year, the median single-family-home sales price and the median condo/co-op price in August were up 2.9% and 3.5% respectively: Both have declined from all-time highs hit in June, which is a typical seasonal trend.
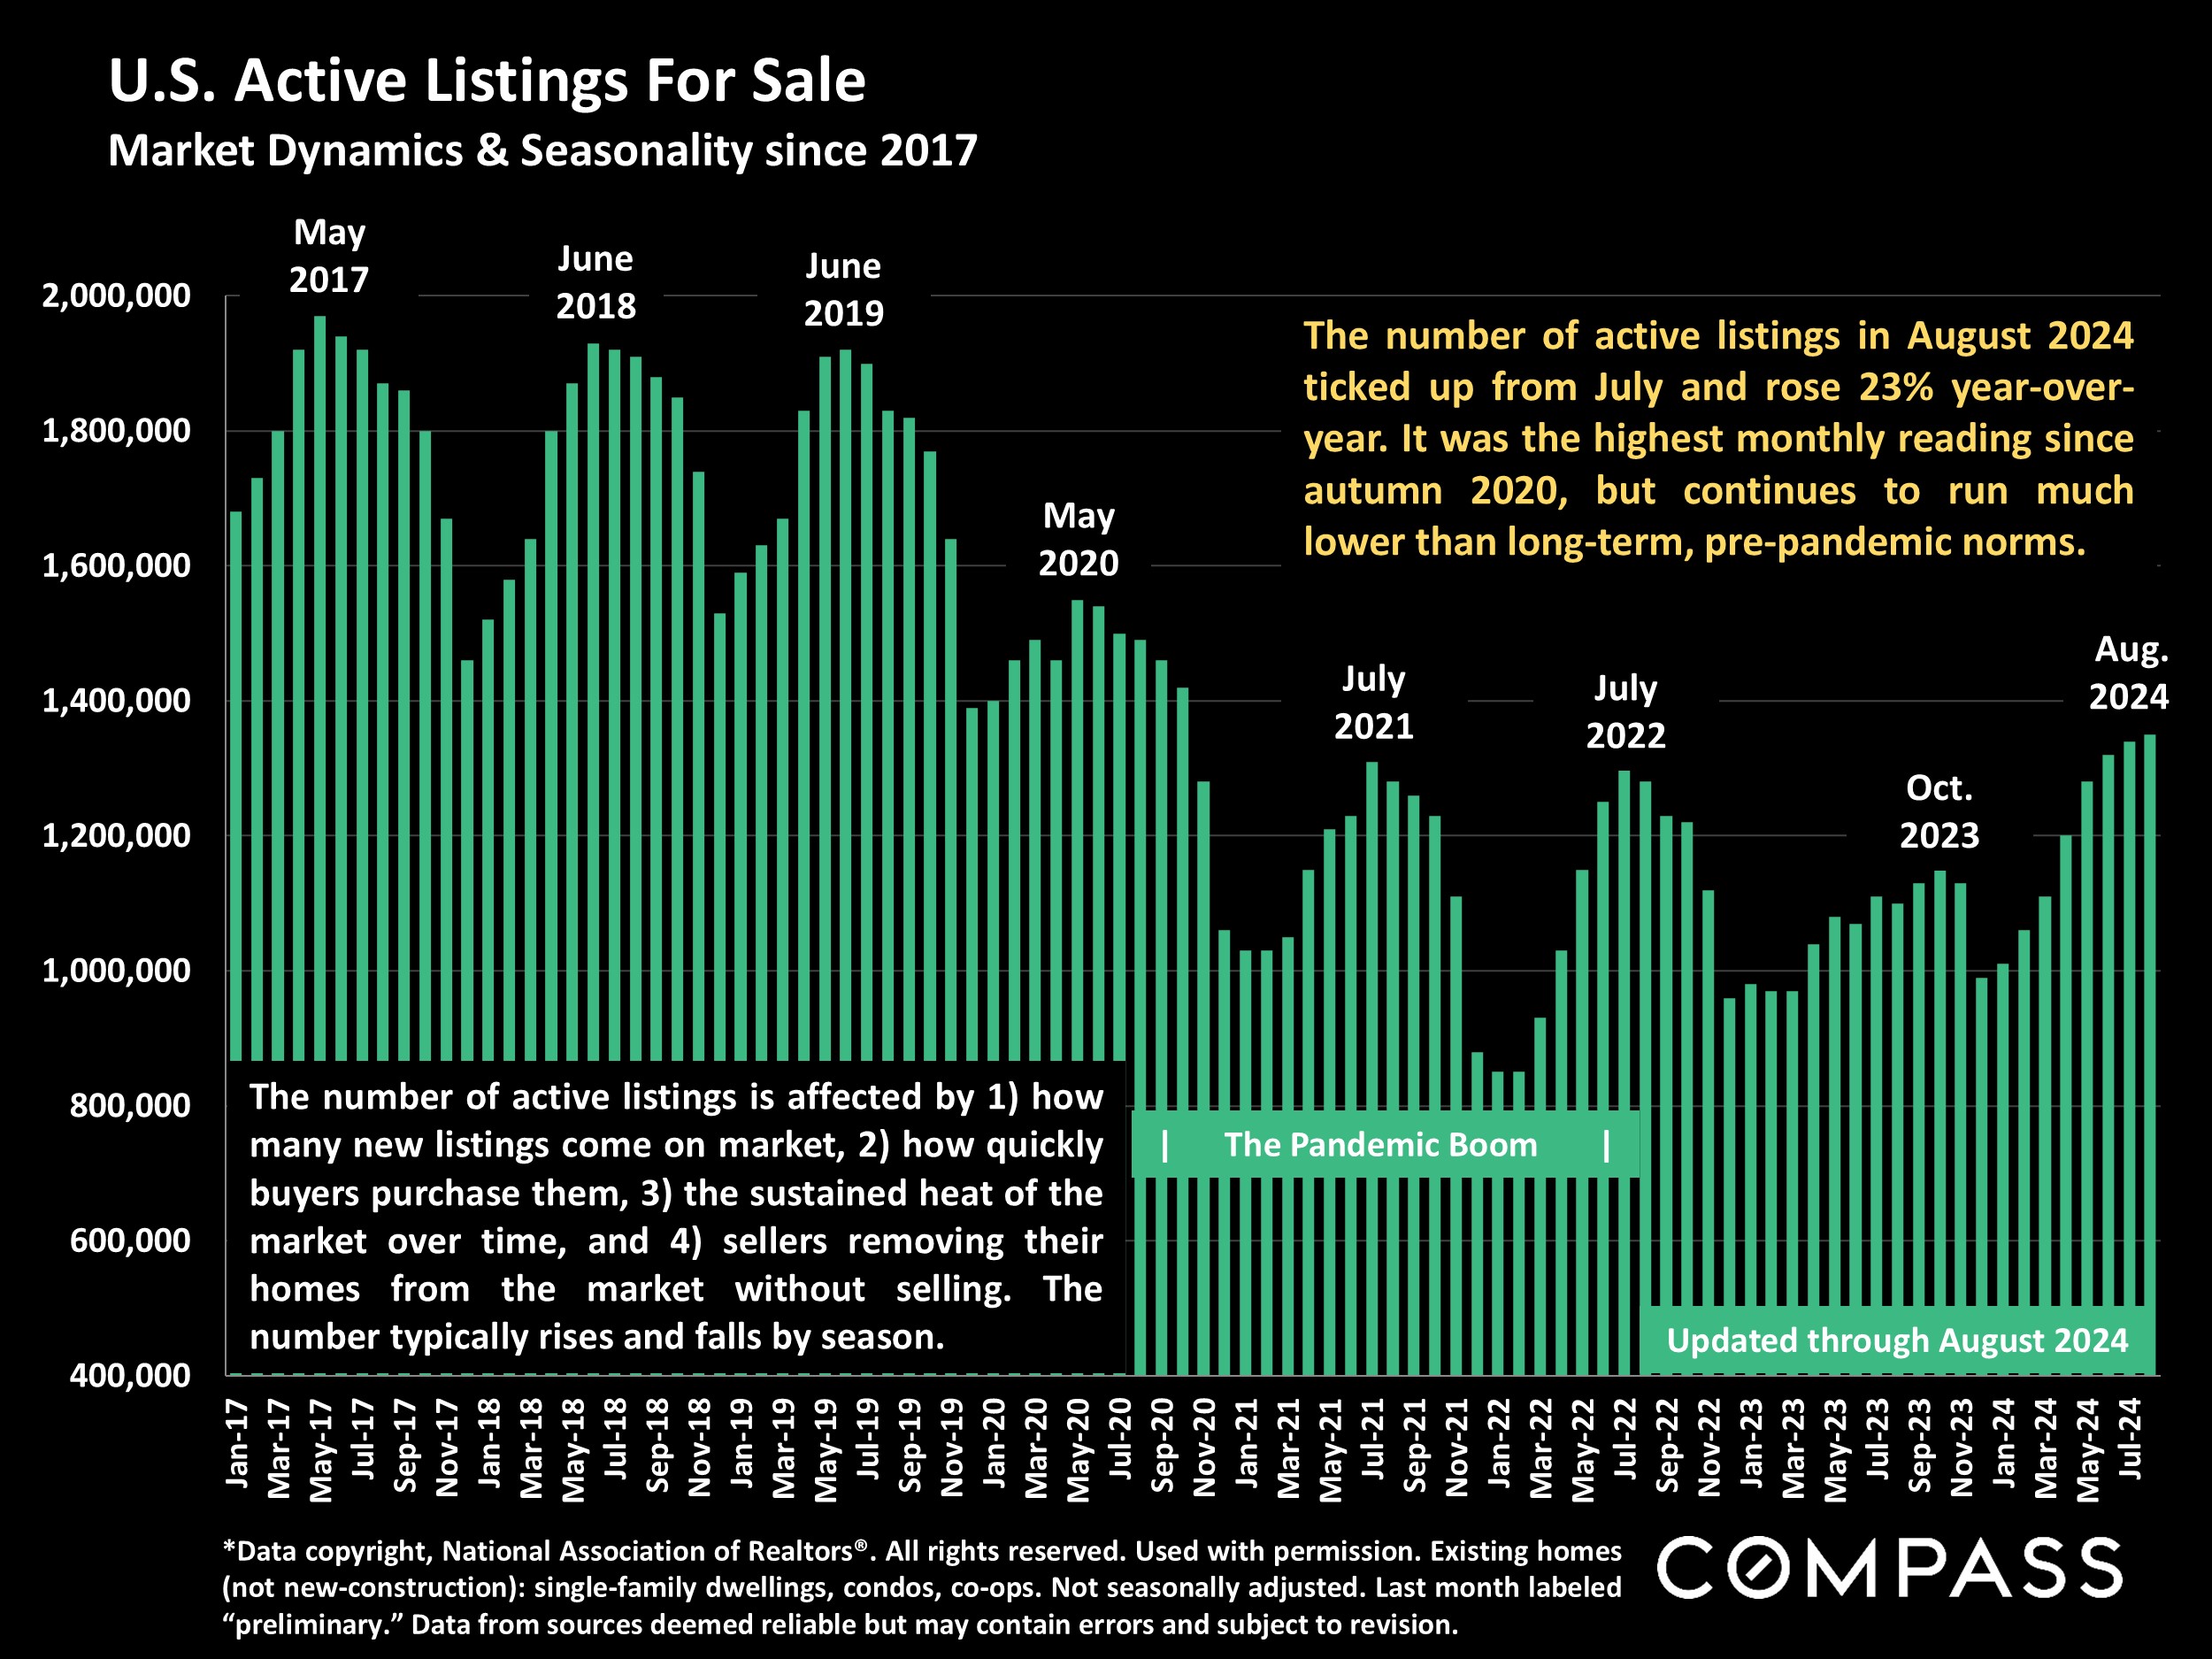
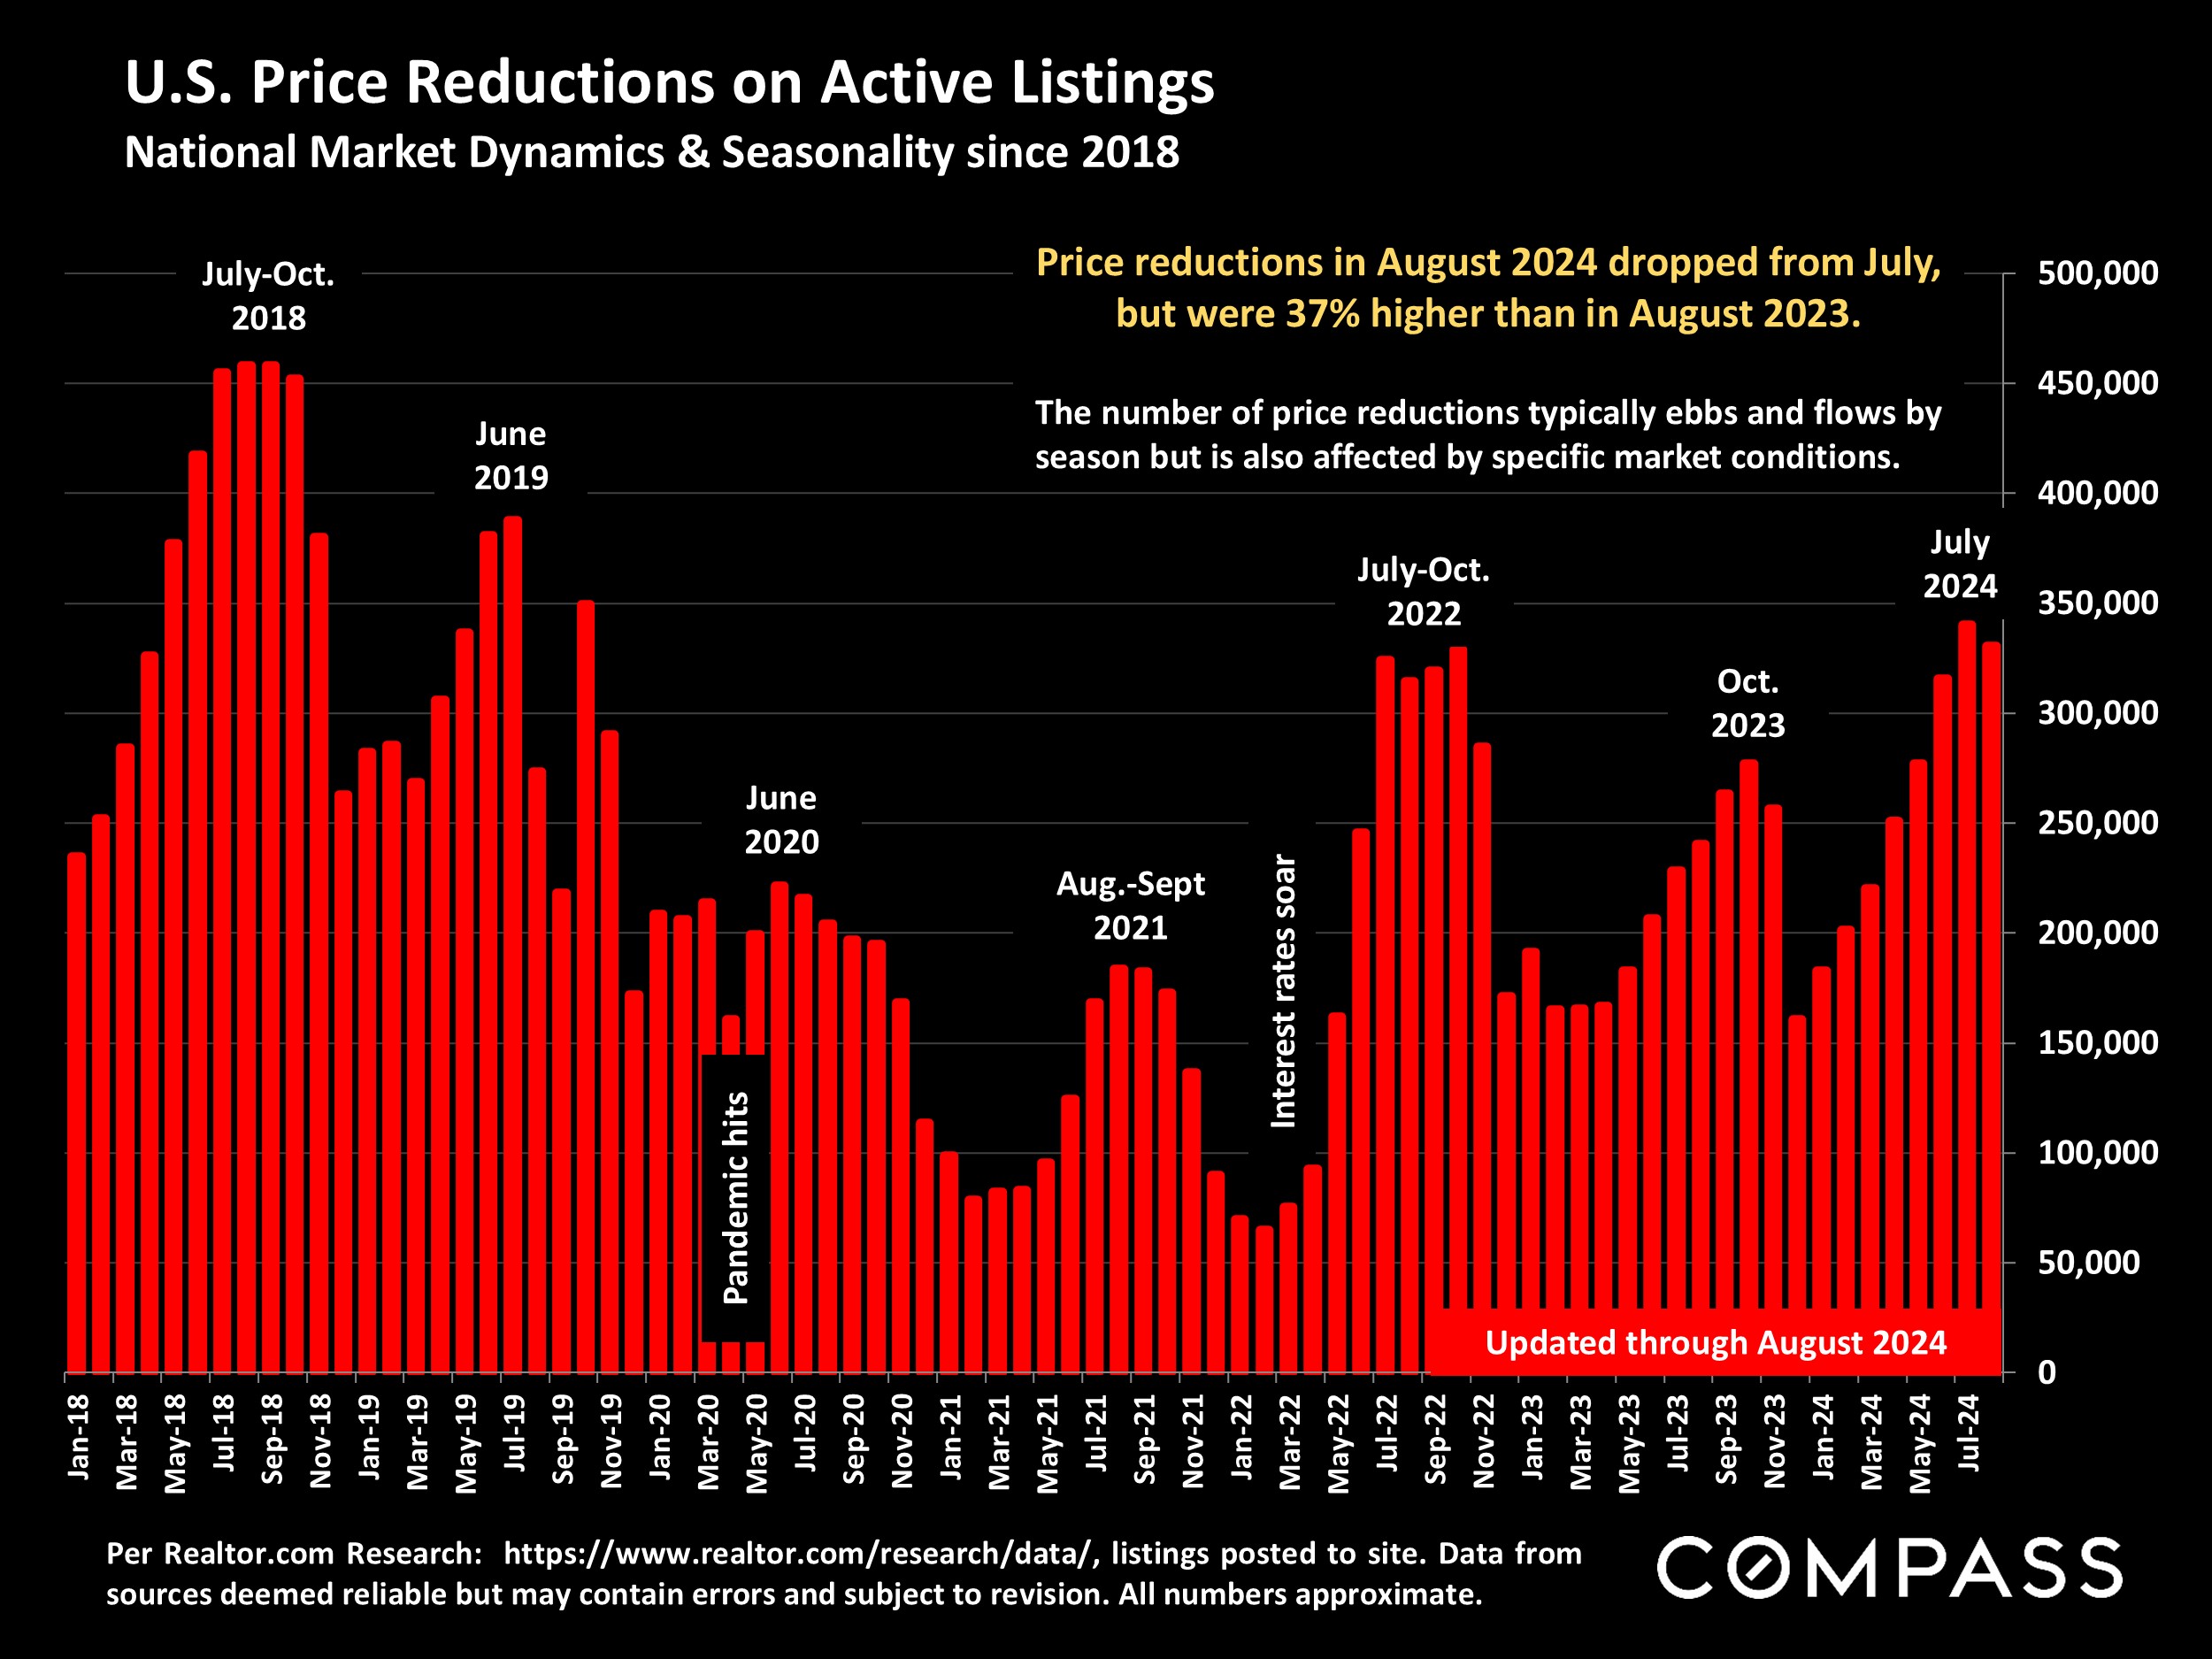
- The number of active listings continued to climb, rising 23% from August 2023 to the highest count since autumn 2020. Price reductions on active listings rose 37% year-over-year. These statistics reflect significant 2024 changes in market supply and demand dynamics.
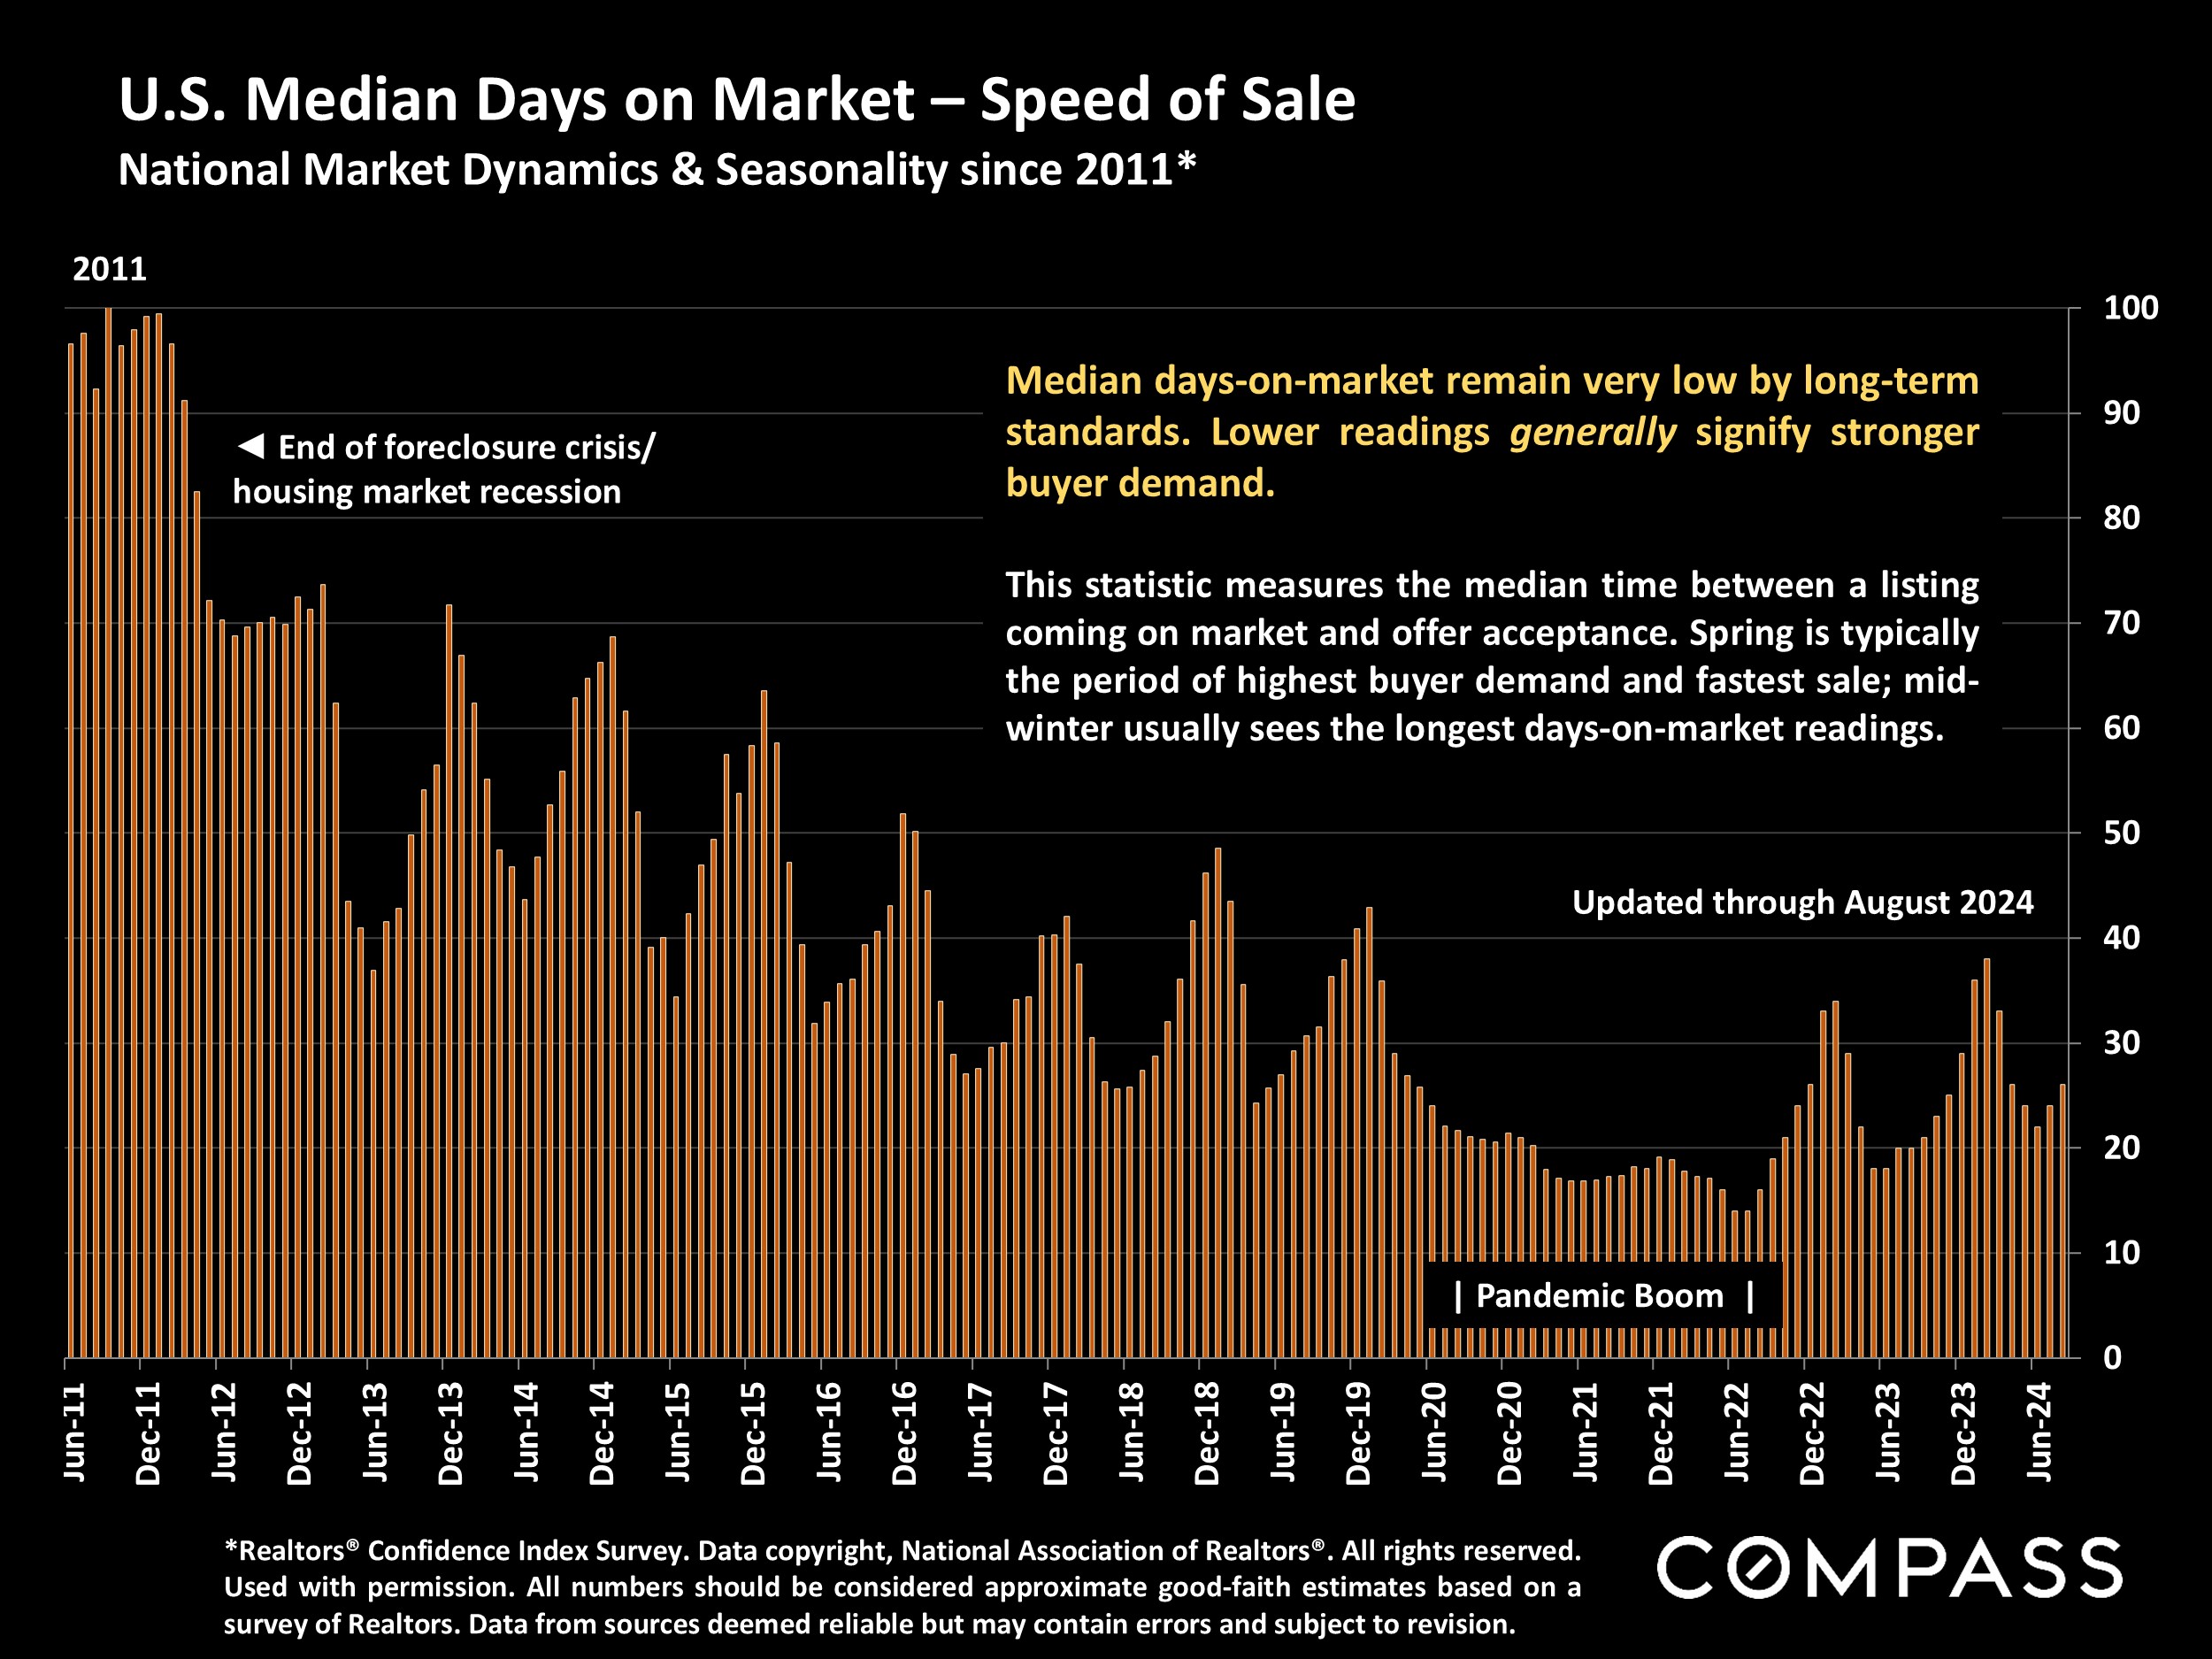
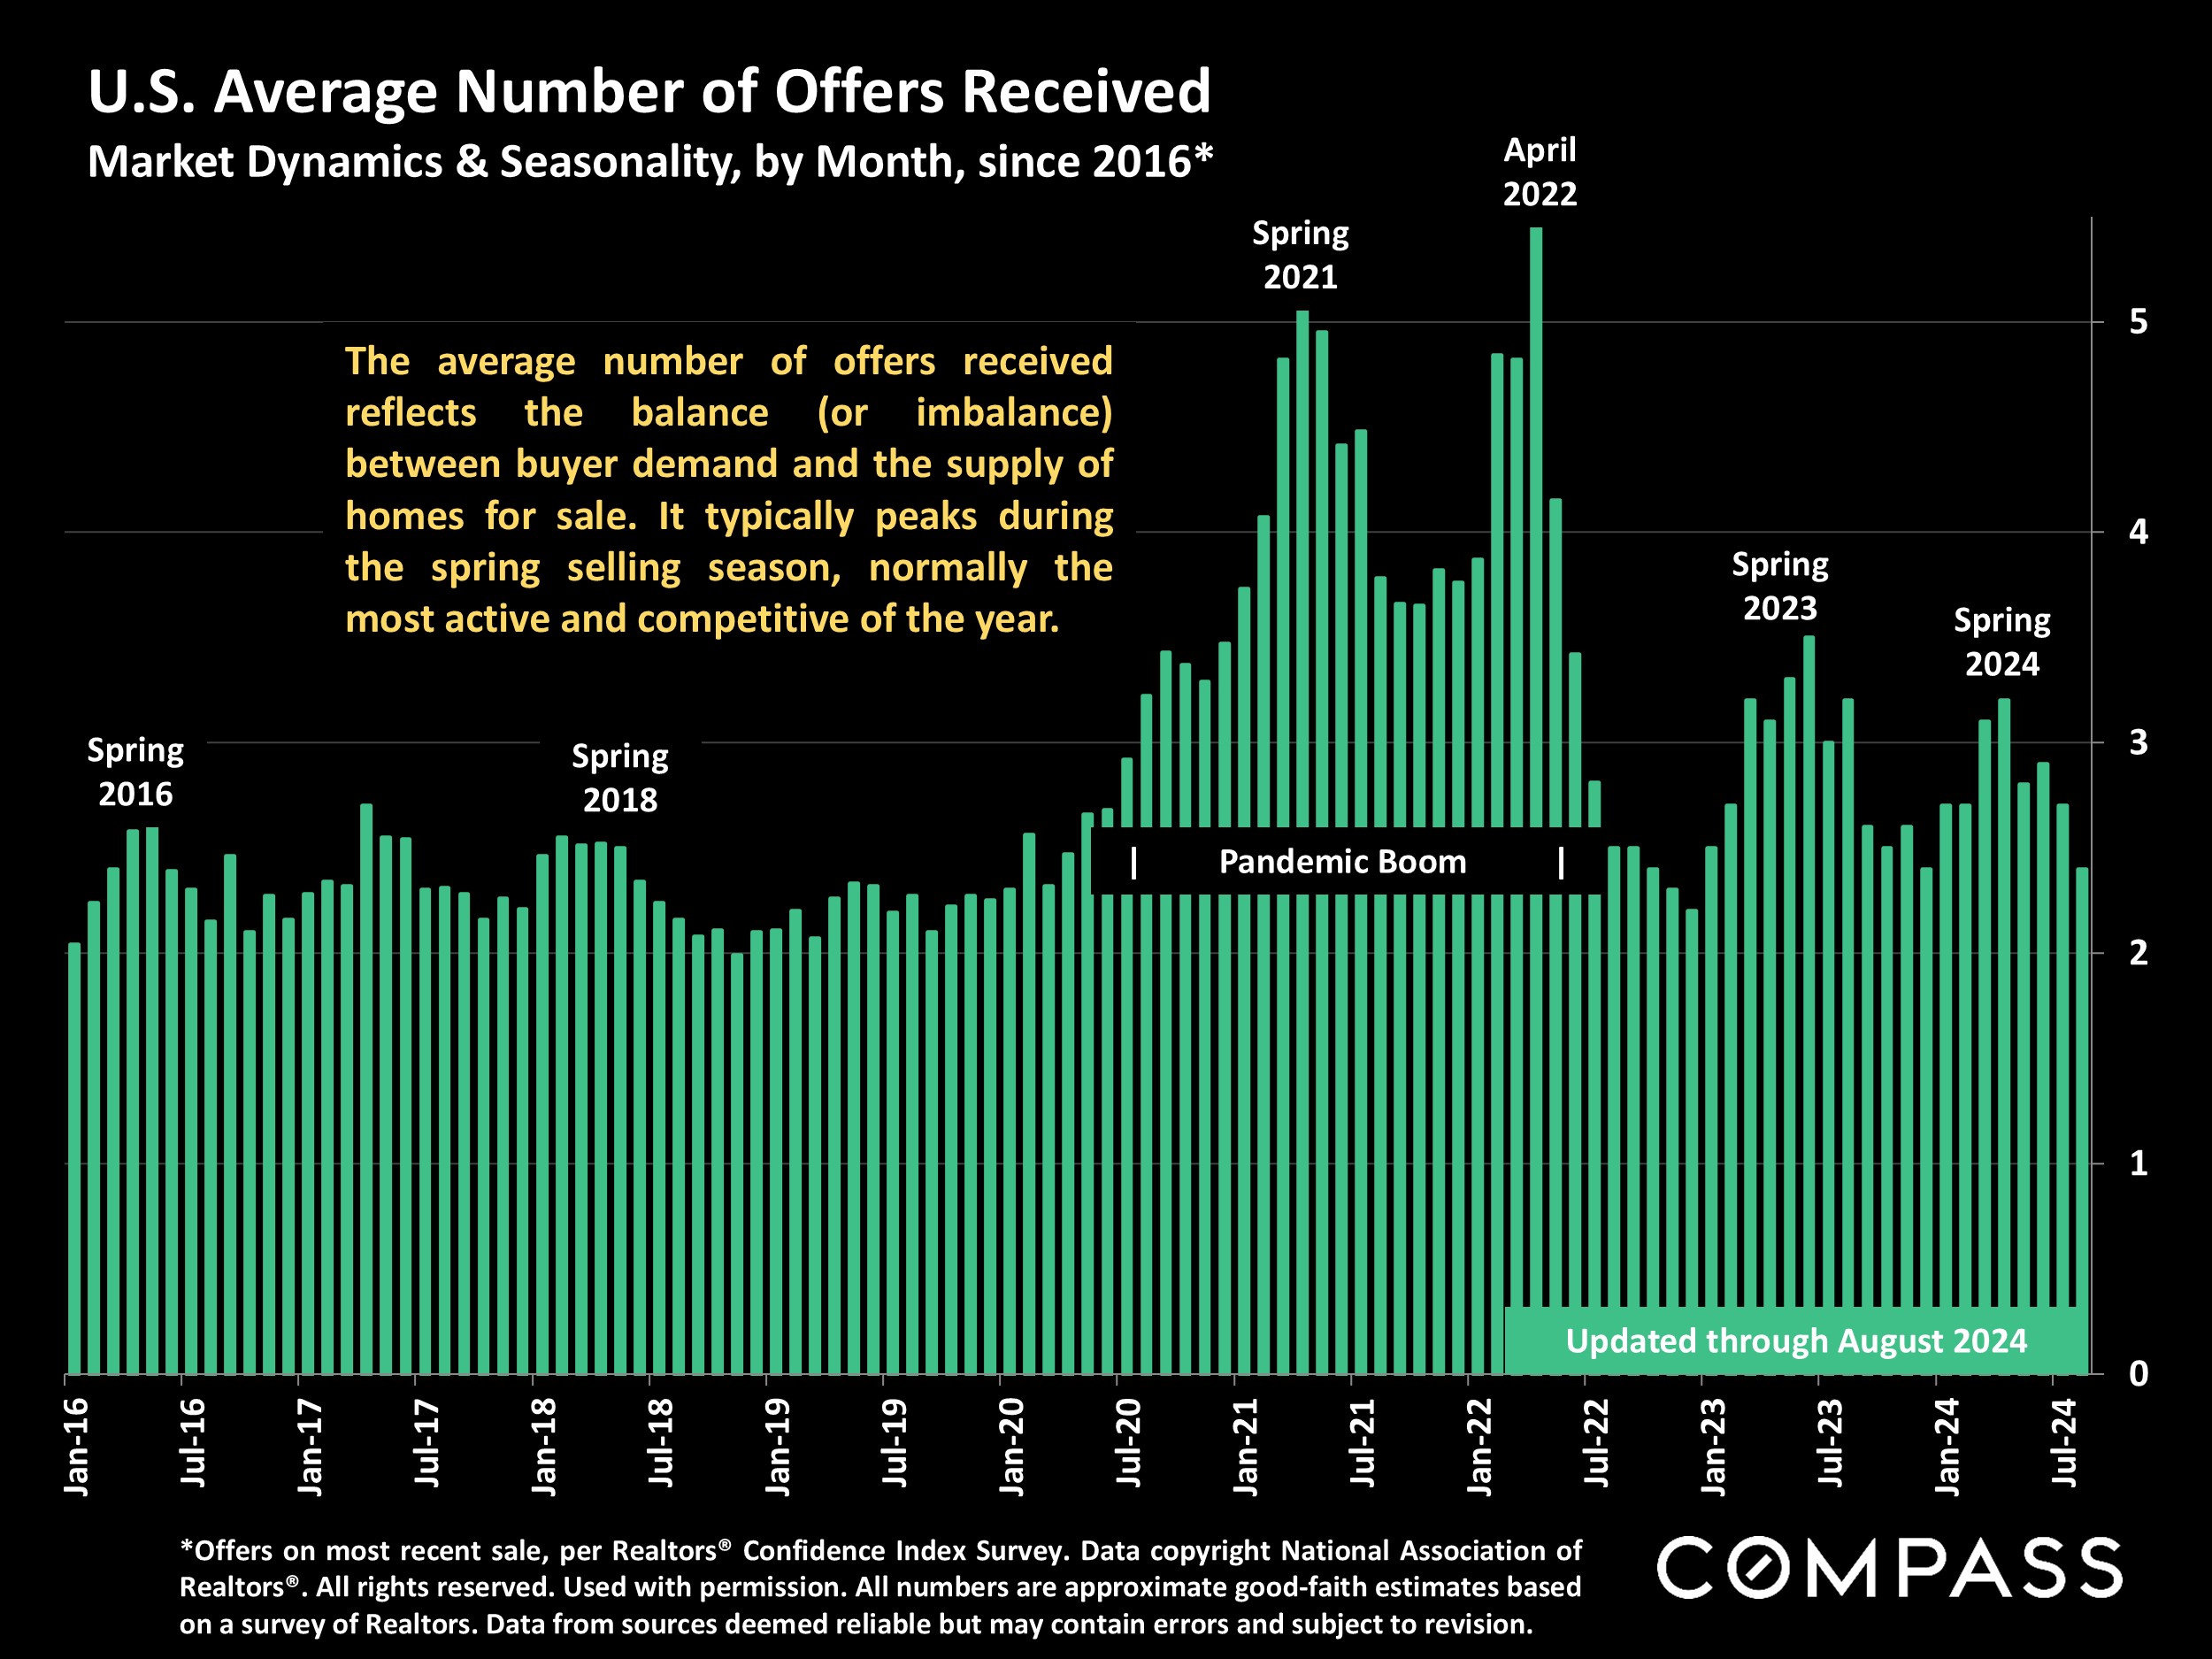
- Approximately 60% of sales went into contract in less than 1 month (vs. 72% in August 2023), 20% sold over list price (vs. 31% last August), and 26% were purchased all-cash (vs. 27%). The median days-on-market to acceptance of offer was 26 days (vs. 20 days last year), and sold listings received an average of 2.4 offers (vs. 3.2). 26% of buyers were purchasing their first home; 7% of homes bought were intended for vacation use; and 8% of buyers purchased without seeing the property in person. Distressed-property sales made up only 1% of sales.
* Approximately 18% of August buyers waived their inspection contingency, and 20% waived the appraisal contingency, 14% of June-August contracts saw delays in scheduled close of escrow, and 5% of contracts were terminated before completion of sale.
The following economic indicators have large ramifications for the housing market, the national economy, and the confidence people have regarding the future.
The Federal Reserve Bank just reduced its benchmark rate for the first time in over 4 years. As illustrated below, once it determines that a change is warranted, the Fed can make significant adjustments quite quickly.
Interest rates have dropped substantially and it is commonly believed they will continue to decline in the near future - but predicting interest rate changes can be challenging to even the most qualified economists.
Probably the most critical economic trend is that inflation has dropped to its lowest reading since early 2021, and getting close to the Fed's target of 2%.
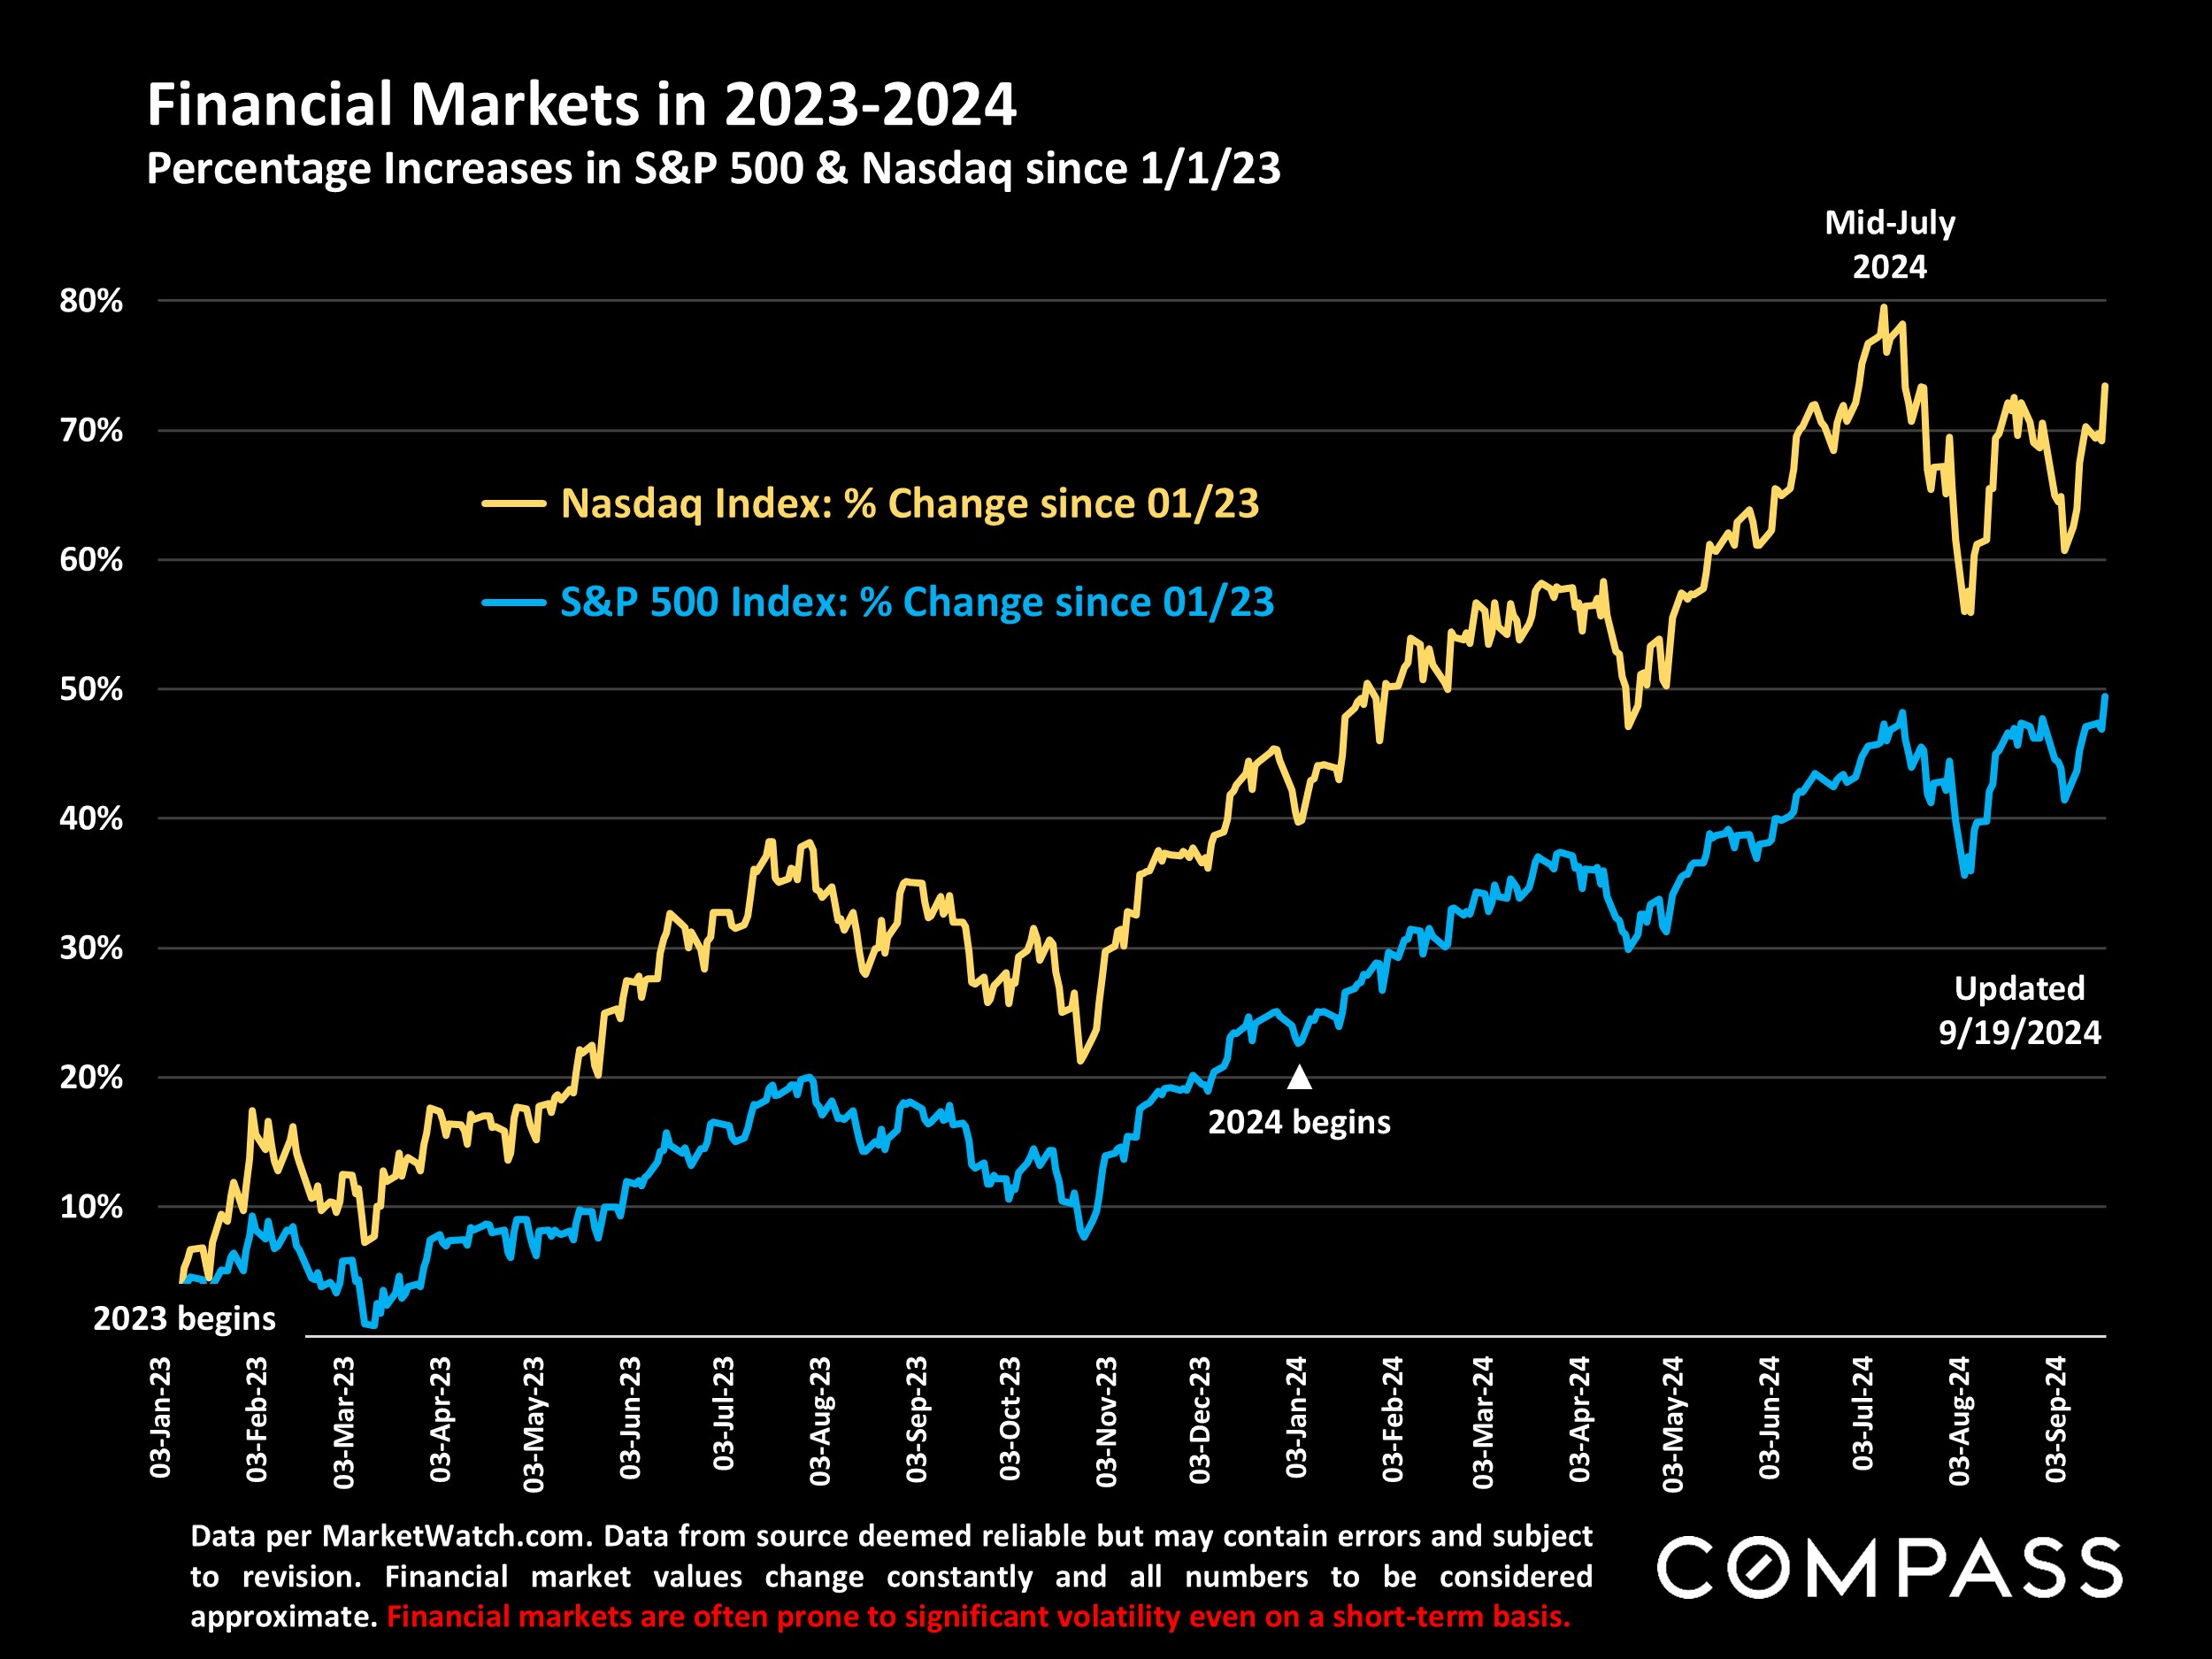
Since mid-July, stock markets have seen some dramatic volatility, but as of 9/19/24, the S&P 500 and Nasdaq were both way up year-to-date, and the S&P and the Dow (not illustrated below) hit new all-time highs.
The national median house sales price since 1990: August was slightly down from the recent peak in June 2024 (a normal seasonal trend).
The U.S. median condo/co-op sales price since 2000: August was slightly down from the recent high in June 2024.
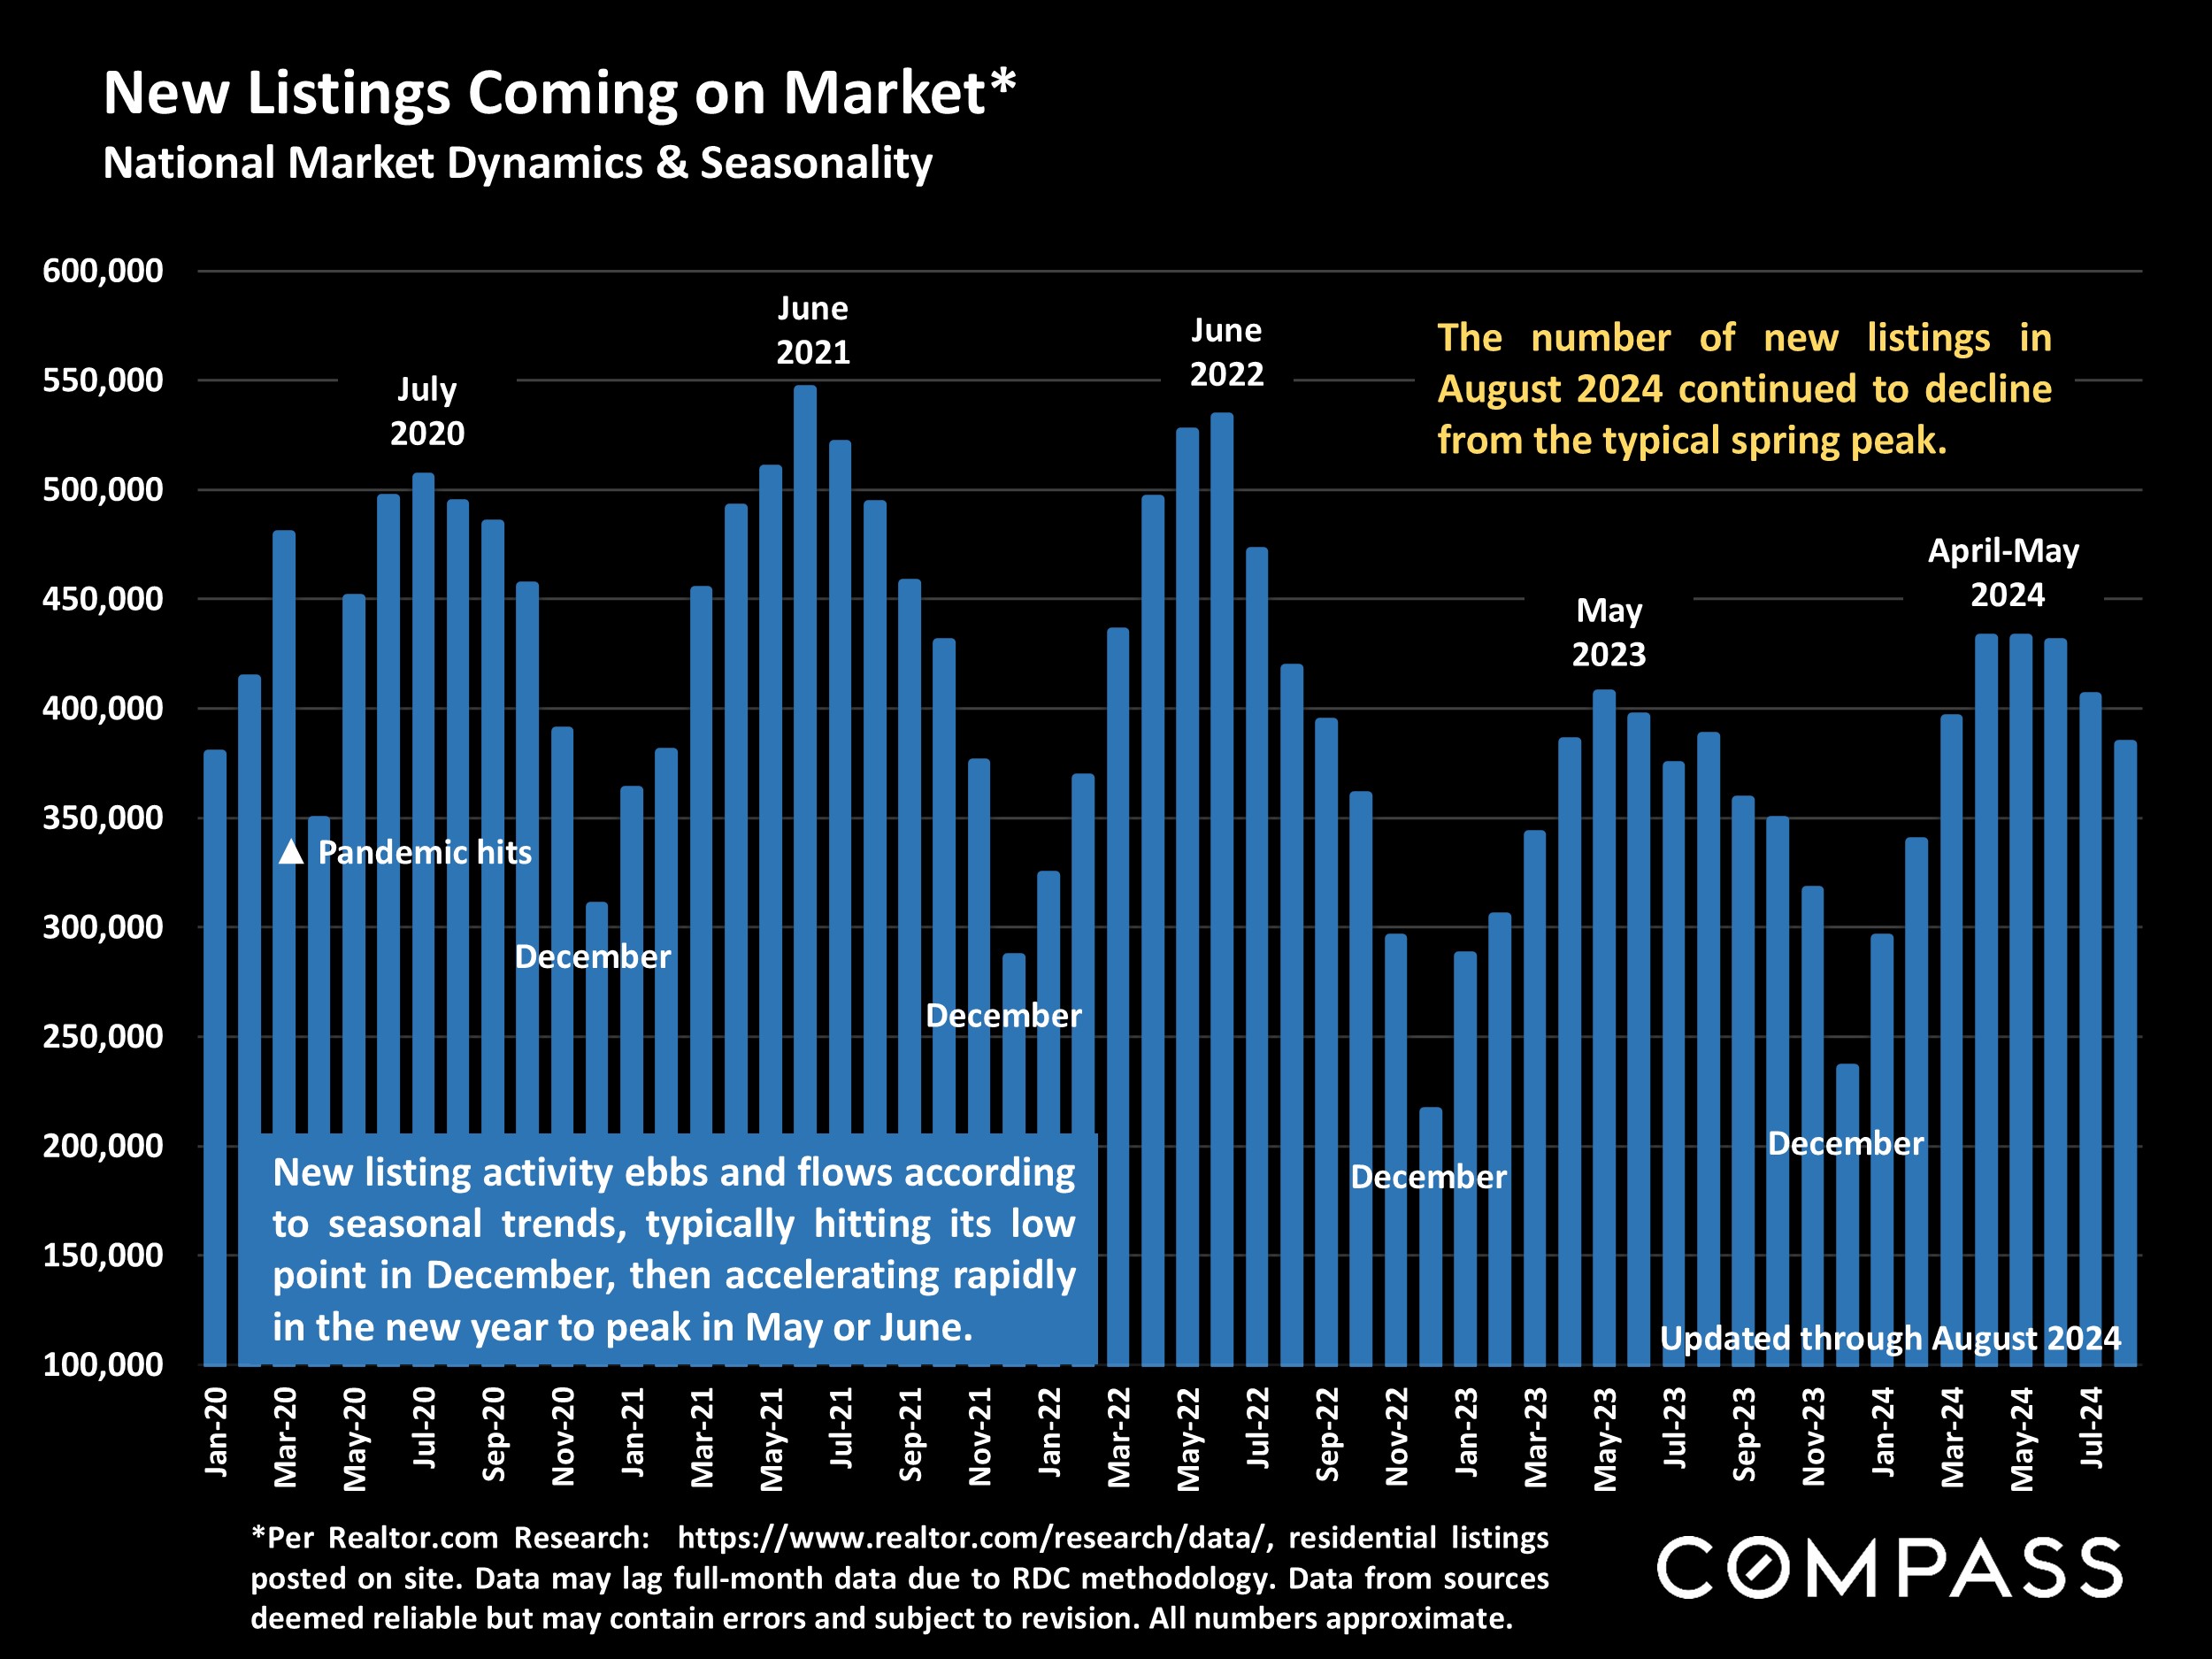
As is the usual seasonal trend, the monthly number of new listings continued to fall from the spring high. Year over year, new-listing activity in August was basically flat compared to August 2023.
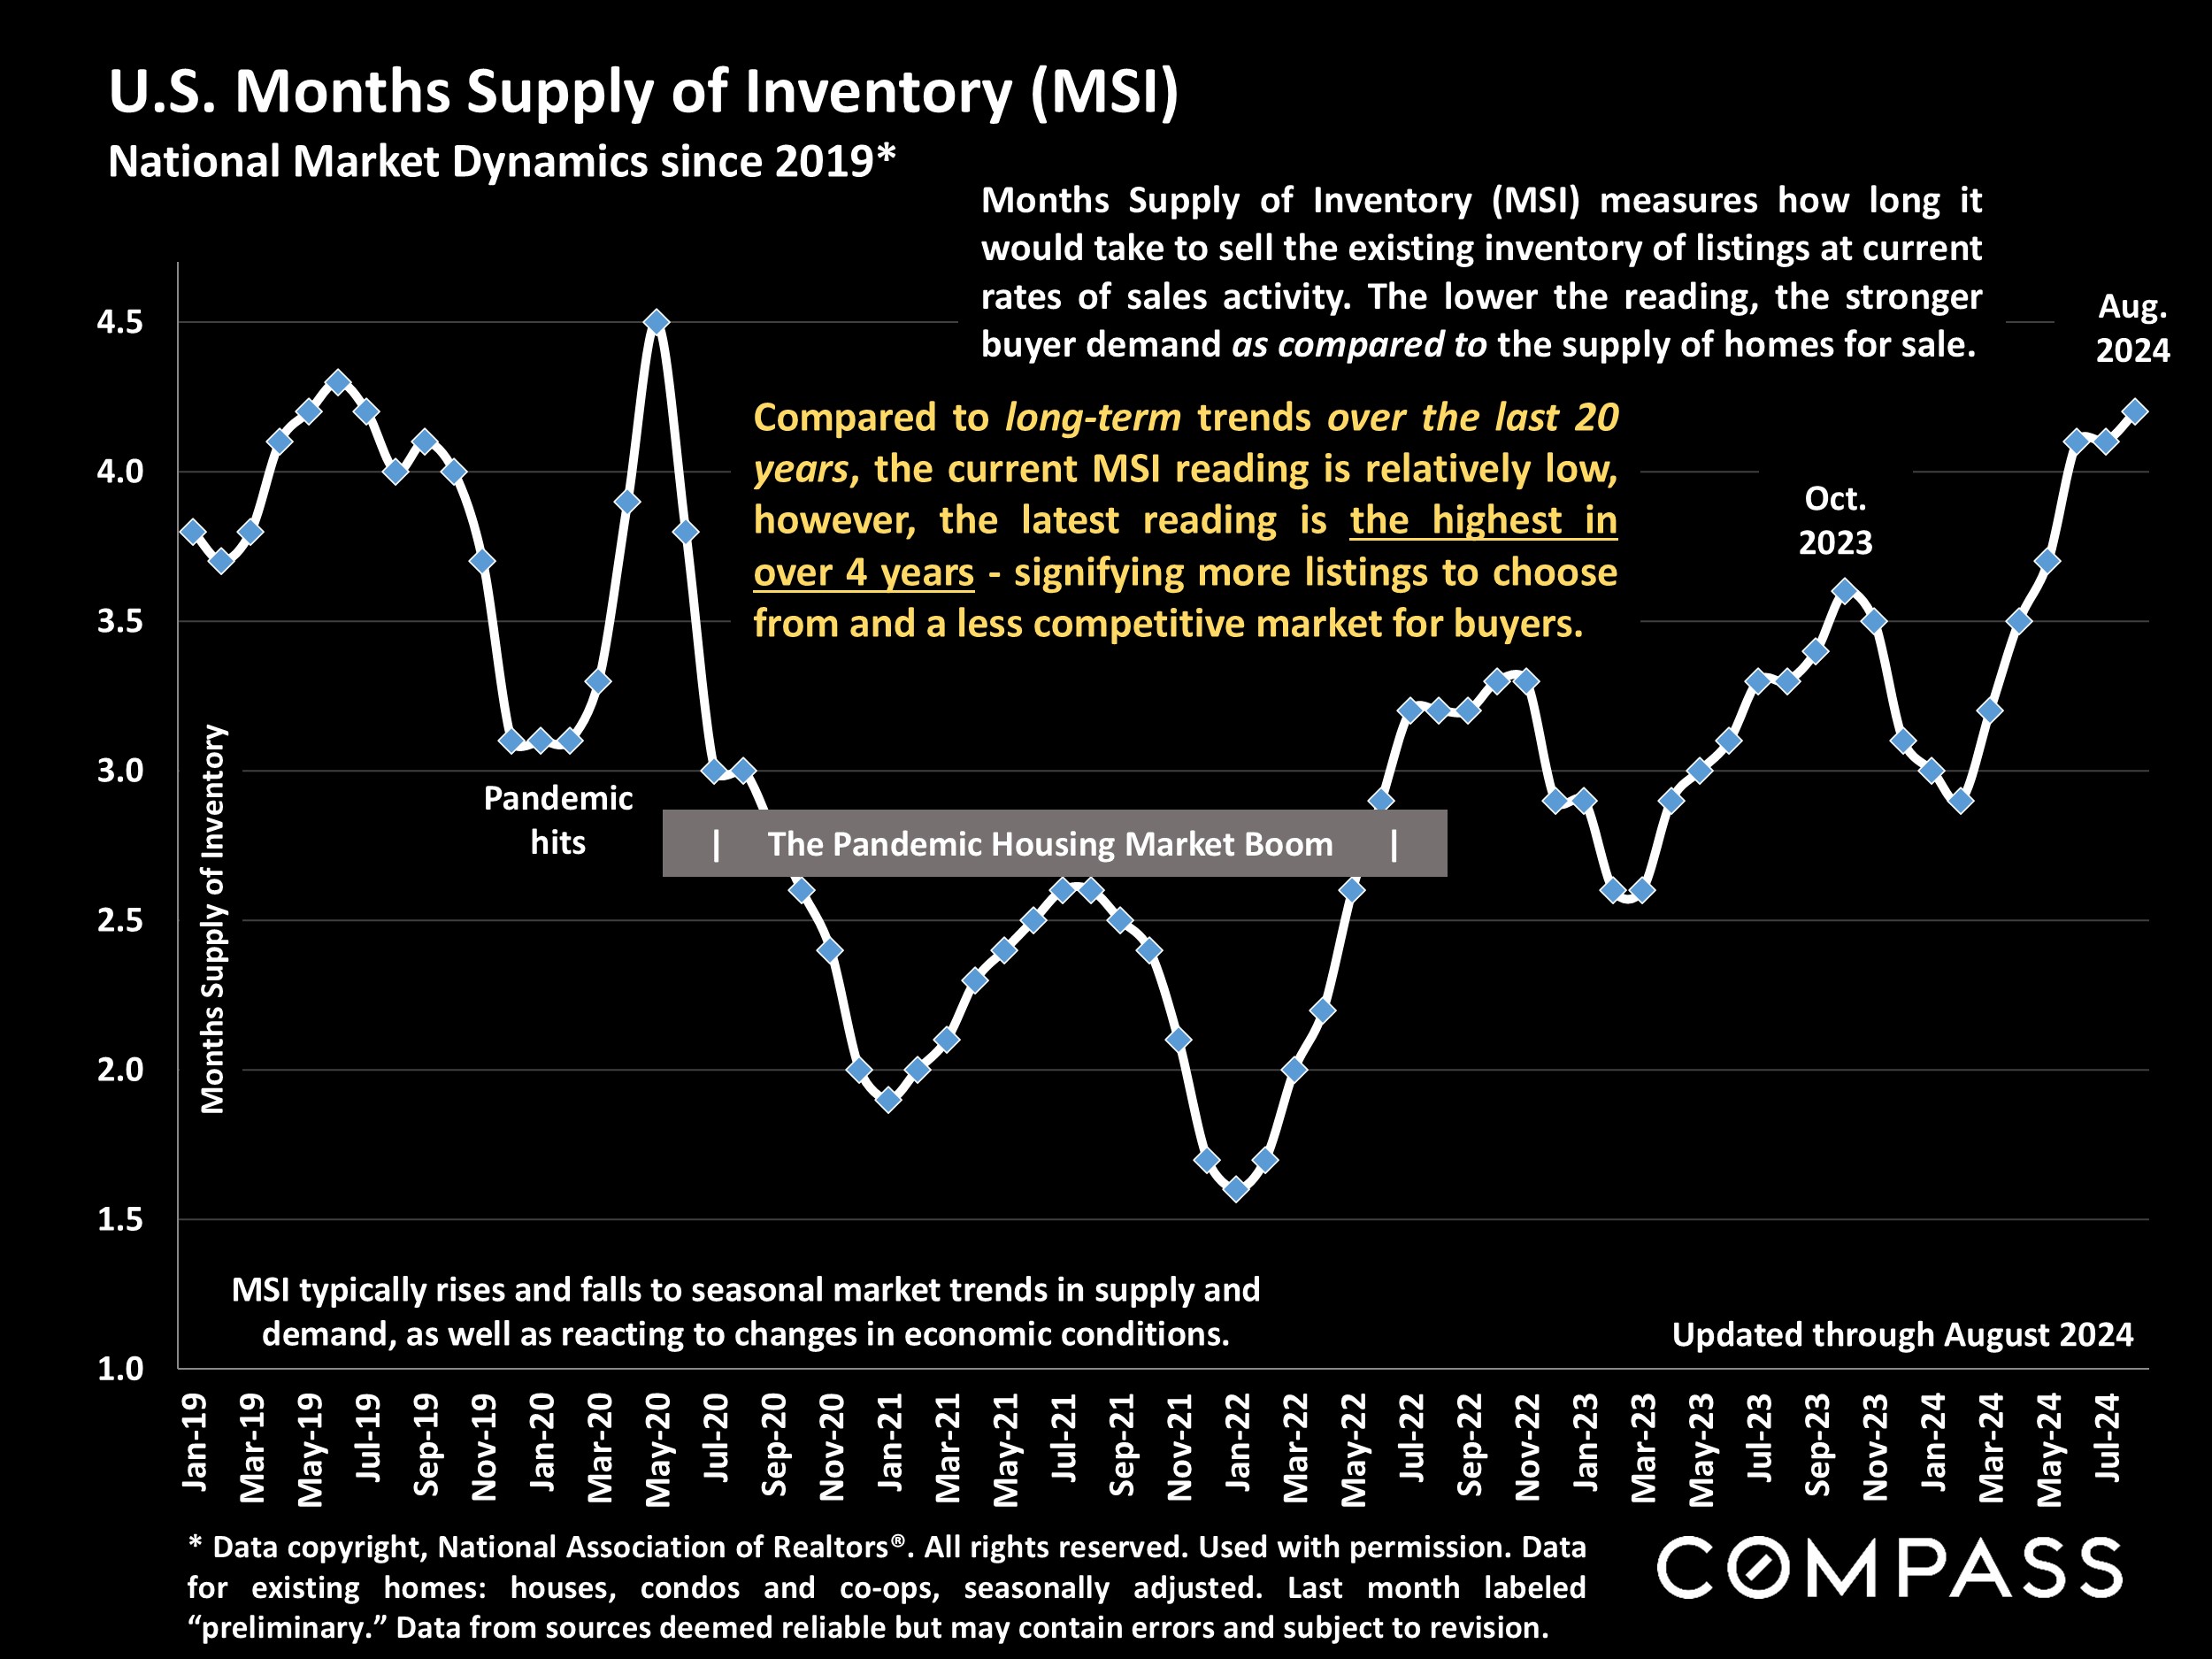
The quantity of homes for sale has been rising and in August hit its highest monthly count in almost 4 years - but the number remains low by long-term standards.
Sales volume in August declined from July and year-over-year, but August sales generally won't reflect the effects - still to be determined - of recent changes in economic conditions, such as the considerable decline in interest rates.
Those homes which sell typically go into contract relatively quickly, but not quite as quickly as in spring or compared to the very heated market of the pandemic boom
The same trends in demand illustrated above in median days-on-market are also found in the average number of offers received on listings sold: Cooler market conditions than in spring, much cooler than during the pandemic boom.
The number of price reductions ticked down in August from July, but is generally running higher than at any time since the effect of soaring interest rates in 2022.
Want to learn more about Bay Area market trends?
Let’s connect! With relationships and networks across the city, there are a variety of ways I can help you make informed real estate decisions. Call, email, or text – I’m here to help.
Contact
